The Closer – IPOs, Consumers, Allotments – 6/9/25
Log-in here if you’re a member with access to the Closer.
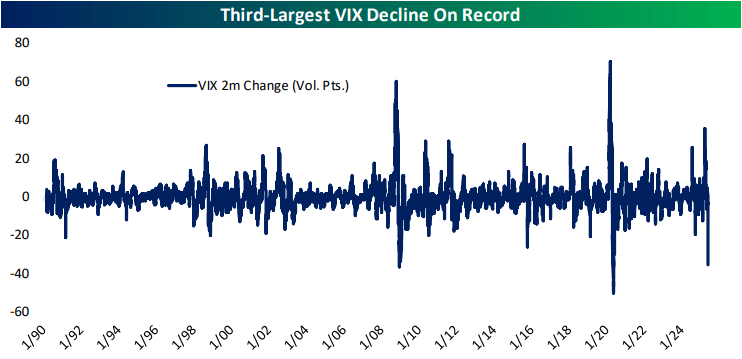
Looking for deeper insight into markets? In tonight’s Closer sent to Bespoke Institutional clients, we lead off with a look at the huge drop in the VIX over the past two months (page 1). We then check in on IPO issuance (page 2) and consumer credit (page 3). Staying on the topic of the consumer, we then review their inflation expectations and other findings from the latest New York survey (pages 4 – 6). We close out with a check in on Treasury allotment figures (page 7).
See today’s full post-market Closer and everything else Bespoke publishes by starting a 14-day trial to Bespoke Institutional today!
$1,000 in the Stock Market at Birth
There’s a real chance that newborn children in the US will begin receiving $1,000 in an investment account at birth if President Trump’s budget bill passes Congress in the months ahead. CEOs of some major public companies are actually meeting at the White House today to discuss the “$1,000 at birth” provision.
Below is a chart we created showing how much $1,000 at birth would be worth today if it were invested in the S&P 500 at the end of each month going back 50 years (with dividends re-invested).

As shown above, $1,000 invested in the S&P fifty years ago and not touched would be worth nearly $350,000 today. That number drops to roughly $127,000 if the $1,000 were invested at the end of November 1980 and $40,000 if the start date is August 1987. Even still, there are a lot of 37-year olds out there born just before the 1987 crash that wouldn’t mind having $40k in an investment account right now!
The second chart above shows the same data over just the last 25 years for better scale. Because of the Dot Com bubble and burst of the late 1990s and early 2000s and the Financial Crisis of the late 2000s, people born in various months during this period would have quite different account values right now. $1,000 invested in August 2000 just after the Dot Com peak would be worth roughly $6,200 today, while $1,000 invested nearly ten years later in February 2009 would be worth nearly $5k more at $11,000. If this provision comes to pass, we may see birth rates go up during lengthy bear markets!

Q1 2025 Earnings Conference Call Recaps: Lululemon (LULU)
Bespoke’s Conference Call Recaps use AI to summarize lengthy earnings calls. The commentary below is AI-generated and then edited by Bespoke for quality control. As always, none of these summaries should be construed as recommendations to buy or sell any securities, and investors should do their own research and/or consult with a financial professional before making any investment decisions.
Our latest recap available to Bespoke subscribers covers Lululemon’s (LULU) Q1 2025 earnings call.
![]()
Lululemon Athletica (LULU) is a premium athletic apparel company known for blending high-performance functionality with sleek, lifestyle-focused design. Originally built on yoga wear, the brand now serves fitness enthusiasts, casual wearers, and trend-driven consumers with women’s and men’s apparel, accessories, and footwear. In Q1, LULU reported 7% revenue growth, with US comps up just 2%, but China up 22%. Cautious US consumer behavior and lower store traffic weighed on performance, though new product innovations like Align No Line and Daydrift were successful. Gross margin rose 60 bps to 58.3%, but new tariffs from China are expected to pressure margins in Q2 before mitigation efforts take effect. The company reaffirmed full-year revenue guidance, expecting 7–8% growth, with stronger international expansion and pricing adjustments planned to offset FX and tariff impacts. LULU beat revenue and EPS estimates, but the stock plummeted 19.8% on 6/6…
Continue reading our Conference Call Recap for LULU by becoming a Bespoke Institutional subscriber. You can sign up for Bespoke Institutional now and receive a 14-day trial to read our newest Conference Call Recap. To sign up, choose either the monthly or annual checkout link below:
Q1 2025 Earnings Conference Call Recaps: ServiceTitan (TTAN)
Bespoke’s Conference Call Recaps use AI to summarize lengthy earnings calls. The commentary below is AI-generated and then edited by Bespoke for quality control. As always, none of these summaries should be construed as recommendations to buy or sell any securities, and investors should do their own research and/or consult with a financial professional before making any investment decisions.
Our latest recap available to Bespoke subscribers covers ServiceTitan’s (TTAN) Q1 2026 earnings call.
![]()
ServiceTitan (TTAN) is a software platform built to power the home and commercial services industries, providing end-to-end business management tools for contractors in trades like HVAC, plumbing, electrical, garage doors, roofing, and more. Its cloud-based solution takes care of everything from dispatching and customer relationship management to marketing, payments, and field technician support. TTAN serves thousands of technicians and businesses, from small shops to private equity-backed consolidators, offering insight into digitization trends across the skilled trades economy. In Q1, TTAN posted 27% YoY total revenue growth to $215.7M, with subscription revenue up 29% and usage revenue up 22%. The company saw traction with large enterprise go-lives and cited record ARR activation in commercial accounts, with more ARR in 28 hours than a typical month. AI-native products like Contact Center Pro began booking jobs autonomously, while the roofing segment advanced via new tech and partnerships (like EagleView). Leadership remained cautious on macro headwinds, especially weather-driven Q2 seasonality and tariff risks. TTAN shares were down 6.9% on 6/6 despite the triple play results…
Continue reading our Conference Call Recap for TTAN by becoming a Bespoke Institutional subscriber. You can sign up for Bespoke Institutional now and receive a 14-day trial to read our newest Conference Call Recap. To sign up, choose either the monthly or annual checkout link below:
Q1 2025 Earnings Conference Call Recaps: DocuSign (DOCU)
Bespoke’s Conference Call Recaps use AI to summarize lengthy earnings calls. The commentary below is AI-generated and then edited by Bespoke for quality control. As always, none of these summaries should be construed as recommendations to buy or sell any securities, and investors should do their own research and/or consult with a financial professional before making any investment decisions.
Our latest recap available to Bespoke subscribers covers DocuSign’s (DOCU) Q1 2026 earnings call.
![]()
DocuSign (DOCU) provides cloud-based software for automating the agreement process, best known for its eSignature product but now expanding into a broader platform called Intelligent Agreement Management (IAM). The IAM platform integrates AI to streamline how organizations create, execute, and manage contracts, offering features like biometric ID verification, automated risk review, and obligation tracking. With more than 1.7 million customers globally, DOCU serves a wide range of industries from financial services to healthcare to government. DOCU’s Q1 call centered on the rapid adoption of IAM, which now has over 10,000 customers and is contributing to stronger product usage and upsell potential. IAM self-serve launched in April and added nearly 1,000 customers within three weeks, while international IAM deals grew over 50% sequentially. Although billings growth came in at 4%, slightly below guidance due to earlier-than-expected drops in early renewals, usage trends hit multi-year highs and net dollar retention improved to 101%. DocuSign also unveiled a slate of new AI-powered tools and reaffirmed its commitment to building a long-term, efficient growth engine. DOCU added another triple play under its belt, its seventh in the last nine quarters, but the stock fell 19% on 6/6 on AI growing pains that are impacting billings growth…
Continue reading our Conference Call Recap for DOCU by becoming a Bespoke Institutional subscriber. You can sign up for Bespoke Institutional now and receive a 14-day trial to read our newest Conference Call Recap. To sign up, choose either the monthly or annual checkout link below:
Chart of the Day – Historic Rallies
Bespoke’s Morning Lineup – 6/9/25 – Industrials Leading the Way
See what’s driving market performance around the world in today’s Morning Lineup. Bespoke’s Morning Lineup is the best way to start your trading day. Read it now by starting a two-week trial to Bespoke Premium. CLICK HERE to learn more and start your trial.
“If I have to go around telling everyone how great I am, then there’s something wrong with my act.” – Les Paul

Below is a snippet of commentary from today’s Morning Lineup. Start a two-week trial to Bespoke Premium to view the full report.
It’s a generally quiet morning in markets ahead of what could be a busy day, depending on how a trifecta of potential catalysts play out. First, US-China trade talks will resume in London in London, and then we could also get an update from the Senate with its version of the reconciliation bill and what changes it made to the House’s version. To round out the trifecta, Apple (AAPL) will be holding its annual Worldwide Developer Conference (WWDC). In last Wednesday’s Chart of the Day, we looked at how the stock typically performs leading up to and after the conference, so make sure to check that out, if you haven’t yet.
The S&P 500 closed above 6,000 for the first time since 2/21, and with a gain of just over 2%, it’s firmly back into positive territory for the year. Overall breadth on the year has also been strong as eight sectors are up YTD, and just three – Consumer Discretionary (-6.8%), Energy (-3.4%), and Health Care (-2.6%) are in the red. The only other sector that’s underperforming the S&P 500 this year is Technology (1.1%), and because it’s easily the largest sector, that’s why so many sectors are outperforming, including five sectors that are up over 5%. The best performing sector, though, is Industrials which finished last week up just shy of 10% for the year.

The technical picture for Industrials also looks positive. For about the last month now, the sector has been trading right around its highs from late last year, and while it was acting as resistance, just last Friday, it broke out to new highs just as the rising 50-DMA looks like it’s on track to cross back above the 200-DMA. Late last year, we were positive on the Industrials sector given the trend of onshoring and less regulation in a second Trump administration, and that has, so far, played out this year.

Brunch Reads – 6/8/25
Welcome to Bespoke Brunch Reads — a linkfest of some of our favorite articles over the past week. The links are mostly market-related, but there are some other interesting subjects covered as well. We hope you enjoy the food for thought as a supplement to the research we provide you during the week.
Big Brother is Watching You: When George Orwell’s 1984 hit shelves on June 8, 1949, it was a jolt to the spine of postwar society. With World War II still fresh in memory and the Cold War beginning, Orwell offered a disturbing vision of the future that felt eerily plausible. The world he described, one of total surveillance, thought control, and rewritten history, resonated with readers who had seen firsthand the rise of fascism and the spread of Stalinism.
1984 quickly drew praise and unease in equal measure. Critics recognized it as a masterwork of dystopian fiction, but also a warning. It was an attempt by Orwell, already weakened by illness, to leave behind a final, urgent message. He wrote it while battling tuberculosis, often working in isolation on the island of Jura off the coast of Scotland.
On that June day in 1949, readers opened the book and met Winston Smith, Big Brother, and the terrifying machinery of the Party. Seventy-five years later, the phrases “Orwellian,” “doublethink,” and “thoughtcrime” are part of our cultural lexicon, a testament to how prophetic that day’s publication turned out to be.

Economic Trends
The stunning decline of the preference for having boys (The Economist)
After decades of skewed birth ratios caused by sex-selective abortions, especially in parts of Asia, the tide has finally started turning. The number of “missing” girls at birth has dropped from 1.6 million in 2000 to around 200,000 today. That’s huge progress, but now something new is happening: a tilt toward preferring daughters, and it has to do with how people feel about raising kids today. It’s not causing the same harm, but it does lead to some interesting questions about where all this could lead, especially if tech makes choosing a child’s sex even easier down the line. [Link]
Continue reading our weekly Brunch Reads linkfest by logging in if you’re already a member or signing up for a trial to one of our two membership levels shown below! You can cancel at any time.

The Bespoke Report – 6/6/25
To read our weekly Bespoke Report newsletter and access everything else Bespoke’s research platform offers, start a two-week trial to Bespoke Premium. In this week’s report, we cover everything happening across financial markets after another wild week.


S&P Giants and Record Highs
Within the S&P 500, 32 stocks now have market caps of at least $250 billion. Of those, four have traded at all-time highs today. Microsoft (MSFT) is the largest of these with a market cap of roughly $3.5 trillion. As for the rest of the Magnificent Seven members, there’s a variety of where they are trading relative to their respective all-time highs, with ones like NVIDIA (NVDA) within 5%, whereas Tesla (TSLA) and Apple (AAPL) are down over 20%. The two major payment processors, Visa (V) and Mastercard (MA), are the next two largest stocks at record highs, followed by Big Blue: IBM (IBM). While not closing out the week at a record, there’s another four stocks that hit record highs this week, including Netflix (NFLX), Philip Morris (PM), Broadcom (AVGO), and Palantir (PLTR).
While there are plenty of names with recent highs, three stocks trace their records to much longer ago. Bank of America (BAC) last traded at record highs way back in November 2006, and General Electric (GE) and Cisco (CSCO) have all-time highs from around 25 years ago. These three stocks are currently down double-digit percentages from those highs, but some are seeing interesting developments.

Below, we show the three aforementioned stocks with all-time highs dating back the furthest. General Electric (GE) and Cisco (CSCO) are both on the verge of long-term breakouts after moving above long term resistance in recent months. Those rallies mean the next resistance levels to watch are their early 2000s highs. As for BAC, price has come off the worst levels, but the highs from 2022 and this past spring would act as more tangible resistance before the 2006 all-time high comes into the picture.
