Bespoke’s Morning Lineup – 6/15/26 – Lift-Off
See what’s driving market performance around the world in today’s Morning Lineup. Bespoke’s Morning Lineup is the best way to start your trading day. Read it now by starting a two-week trial to Bespoke Premium. CLICK HERE to learn more and start your trial.
“There’s always one more way to do things and that’s your way, and you have a right to try it at least once.” – Waylon Jennings

Below is a snippet of commentary from today’s Morning Lineup. Start a two-week trial to Bespoke Premium to view the full report.
What looked like a questionable week for the equity market up until early Thursday afternoon quickly turned positive, and US stocks finished the week broadly higher. Of the major index ETFs we track in our Trend Analyzer, the only one to finish the week lower was the S&P 100 (OEF), which tracks the 100 largest companies in the US, and it only traded down 0.13%.
Last week’s rally was broad, with smaller-cap stocks leading the market higher. The Russell Micro-Cap ETF (IWC) traded up over 4% and finished the week in overbought territory, while the Russell 2000 (IWM) also gained 4%. Mid-cap stocks also outperformed, with the Russell Mid Cap ETF (IWR) rallying close to 2.5%. Except for the Nasdaq 100 (QQQ), other large-cap indices lagged their smaller peers, trading higher by less than 1%.
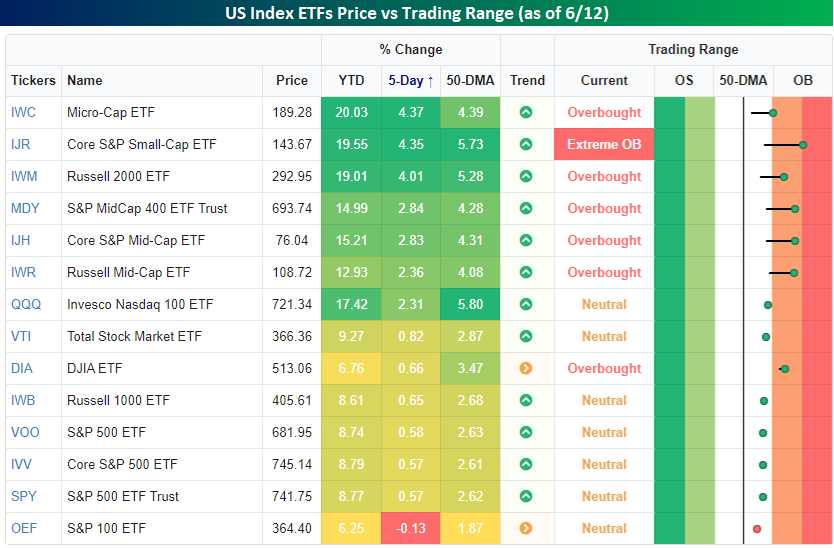
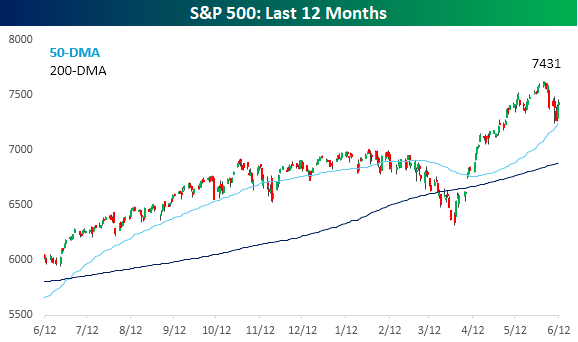
Heading into the new week, the S&P 500 is 2.5% below its all-time high, so even after today’s open, the index will be trading shy of its recent highs. However, the declines from last week look increasingly like a successful test of the 50-day moving average, and traders will look to the 7,620 level to see how much resistance it puts up.
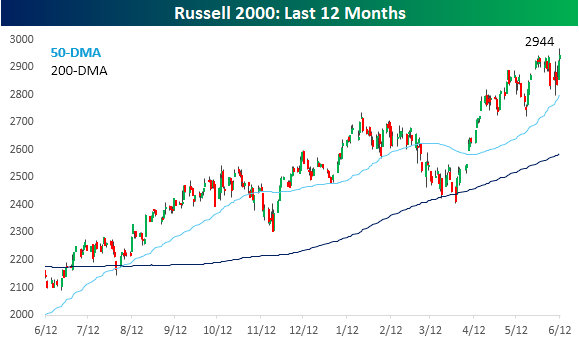
While large-cap stocks are still looking up at prior highs, smaller caps are looking in the opposite direction. The Russell 2000 traded at an all-time high to close out last week and will only add to those levels at the open this morning.
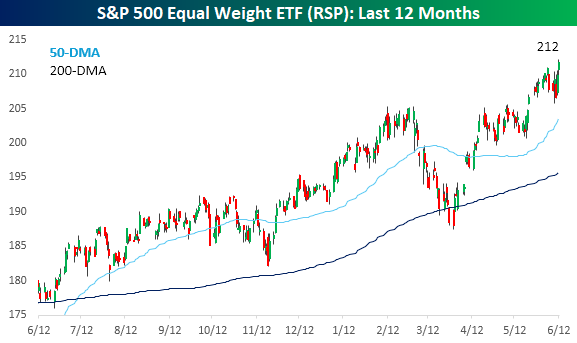
The broadening of the rally also shows up in the performance of the S&P 500 Equal Weight ETF (RSP), which closed at an all-time high last week. While the S&P 500 tested its 50-DMA last week, its Equal Weight peer never even got close to that level.
Start a two-week trial to Bespoke Premium to continue reading today’s full Morning Lineup.
Brunch Reads – 6/14/26
Welcome to Bespoke Brunch Reads — a linkfest of some of our favorite articles over the past week. The links are mostly market-related, but there are some other interesting subjects covered as well. We hope you enjoy the food for thought as a supplement to the research we provide you during the week.
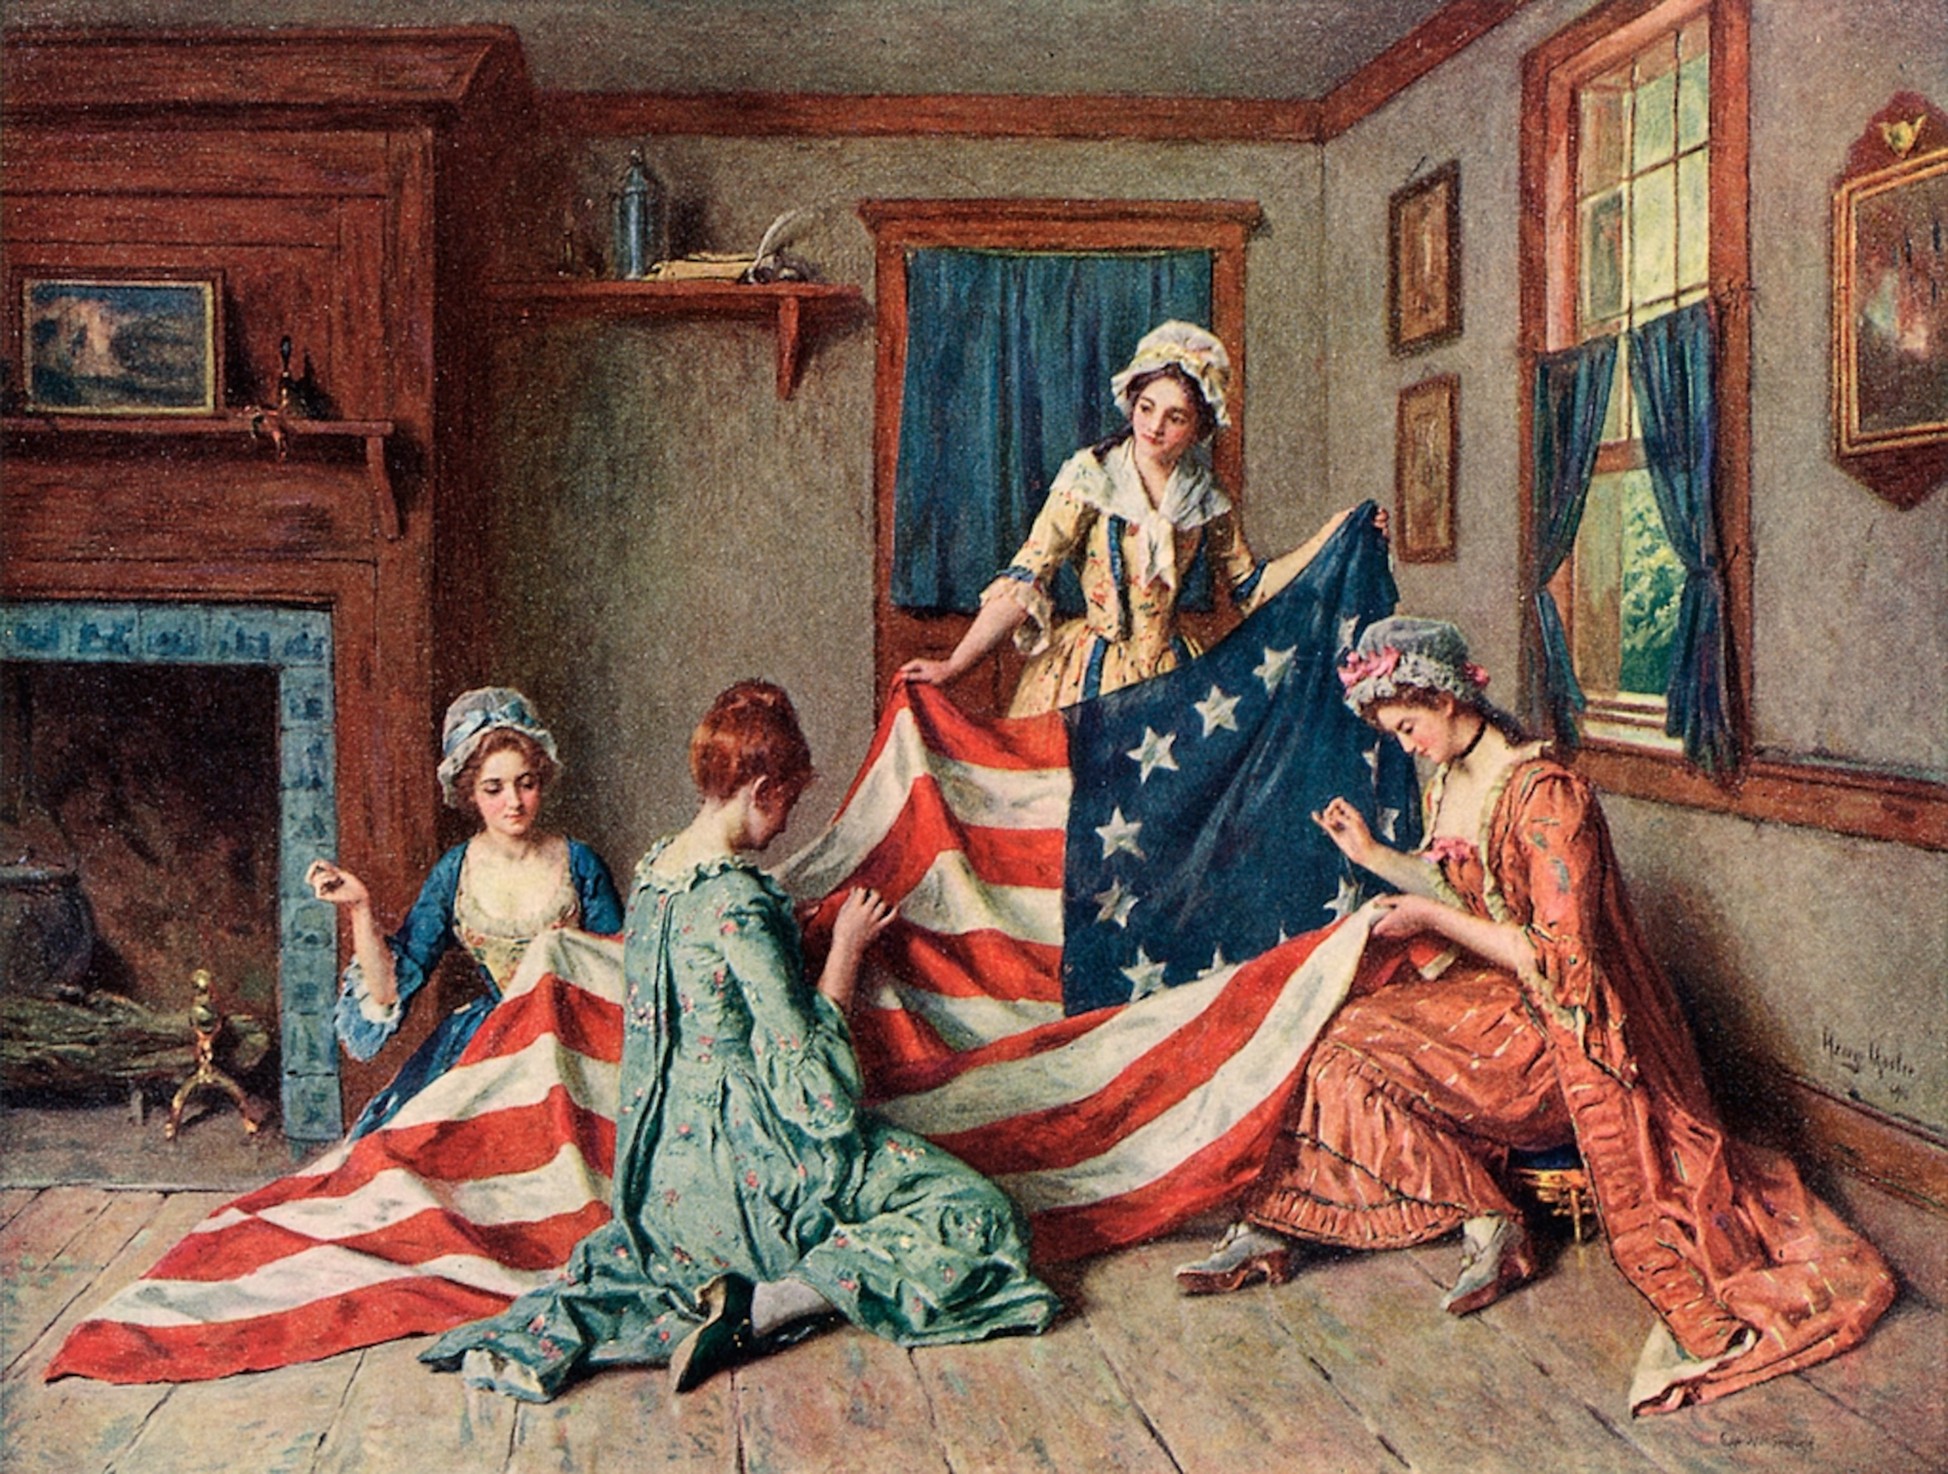
Stars and Stripes: Today is Flag Day, and on this day in 1777, the Continental Congress adopted what would become the first official flag of the United States. With the Revolutionary War still raging and American independence far from guaranteed, Congress passed a simple resolution declaring that the flag should feature thirteen alternating red and white stripes and thirteen white stars on a blue field, representing the thirteen states united in a “new constellation.”
The resolution was only one sentence long, and it left many details, including the arrangement of the stars, unspecified. While the familiar story of Betsy Ross sewing the first flag remains a cherished piece of American folklore, historians continue to debate her role in its creation. What is certain is that the new nation needed a symbol of unity as it fought for survival against Britain. More than two centuries later, the design adopted that day remains one of the most recognizable flags in the world.
Health & Wellness
Is the iPhone Birth Control? Causal Evidence from AT&T’s 2007–2011 Carrier Monopoly (NBER)
The long-running decline in US birth rates may be tied in part to the arrival of smartphones, with areas that gained early access to the iPhone experiencing noticeably larger drops in births, especially among teenagers and women in their early twenties. The findings suggest smartphones changed how people spent their time and interacted with one another, reducing face-to-face socializing and sexual activity enough to account for a substantial share of the nationwide fertility decline. [Link]
Continue reading our weekly Brunch Reads linkfest by logging in if you’re already a member or signing up for a trial to one of our two membership levels shown below! You can cancel at any time.

The Bespoke Report – 6/12/26 – Debt, Growth, & Animal Spirits
To read our weekly Bespoke Report newsletter and access everything else Bespoke’s research platform offers, start a two-week trial to Bespoke Premium. In this week’s report we start with a review of the successful trading debut for SpaceX (SPCX). While that event sucked up all the headlines this week, one relatively obscure US economic release was far more important and we go into detail why. We also dive into the performance of a range of stocks in our Bespoke AI Basket, review the strong year for emerging markets and which countries are driving returns, discuss Chinese economic data this week, and review the week that was in US data including inflation, housing, and labor markets. Give it a read!

Q1 2026 Earnings Conference Call Recaps: RH (RH)
Bespoke’s Conference Call Recaps use AI to summarize lengthy earnings calls. The commentary below is AI-generated and then edited by Bespoke for quality control. As always, none of these summaries should be construed as recommendations to buy or sell any securities, and investors should do their own research and/or consult with a financial professional before making any investment decisions.
Our latest recap available to Bespoke subscribers covers RH’s (RH) Q1 2026 earnings call.
![]()
RH (RH) is a luxury home furnishings and design company that sells high-end furniture, lighting, textiles, décor, and interior design services through large-format galleries, sourcebooks, and a growing international footprint. The company provides a useful read on affluent consumer spending, luxury housing trends, interior design demand, and the health of the high-end home furnishings market. RH reported better-than-expected first-quarter results despite ongoing tariff-related sourcing disruptions that left backorders and special orders roughly $75 million above normal levels. Management argued that growth will accelerate sharply in the second half as those delayed orders ship, new galleries contribute, and RH Estates launches. Estates was the dominant topic on the call, with CEO Gary Friedman describing it as RH’s biggest initiative ever as a push into the highest end of the luxury home market featuring designer brands, bespoke customization, and new incentives for architects and interior designers. Management also emphasized that the company does not need a housing recovery to meet guidance, noting that the housing downturn has already stretched toward four years. International expansion remained another key focus, with Madrid and Milan now open and London viewed as the critical launch point for building RH into a global luxury brand. RH shares were down roughly 5% for the better part of the trading day on 6/12…
Continue reading our Conference Call Recap for RH by becoming a Bespoke Institutional subscriber. You can sign up for Bespoke Institutional now and receive a 14-day trial to read our newest Conference Call Recap. To sign up, choose either the monthly or annual checkout link below:
SpaceX (SPCX) Settles
Bankers working the deal, led by Goldman Sachs (GS) and Morgan Stanley (MS) as the co-lead, priced SpaceX (SPCX) at $135/share last night, giving the company a market cap of roughly $1.77 trillion at the IPO.
Shares began trading on secondary markets just after 11:30 AM ET at $150/share, and with about a half hour to go in the trading day, shares have settled in around $165/share after peaking just above $176 at 1 PM ET.
At $165, SpaceX has a market cap of $2.2 trillion.
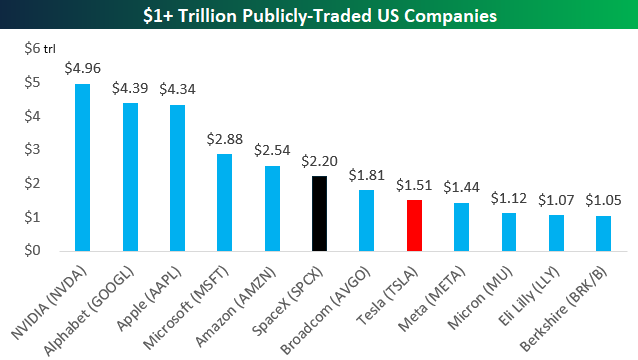
Below is a look at where SPCX ranks among the current crop of publicly-traded $1+ trillion companies.
As of now, SpaceX is the sixth largest US company behind Amazon (AMZN) at $2.54 trillion and ahead of Broadcom (AVGO) at $1.81 trillion.
Elon Musk’s SPCX is already $700 billion larger than Tesla (TSLA), and it’s more than twice the size of Berkshire Hathaway (BRK/B).
Before the end of the year, we’re expected to get two more private companies that will make a run for the $1+ trillion club: Anthropic and OpenAI.
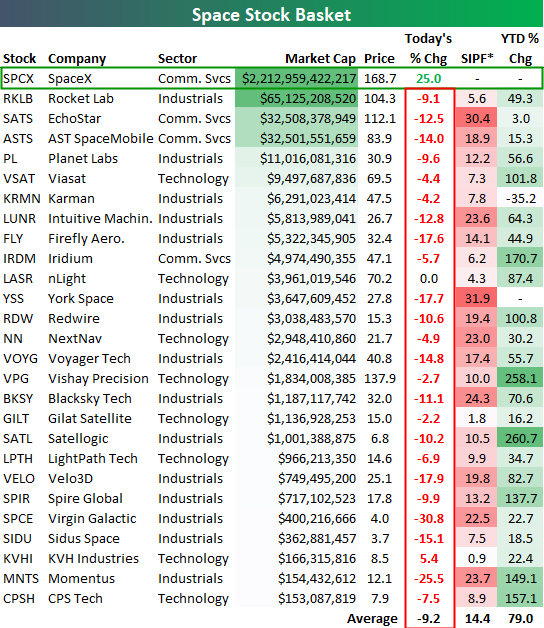
Over the past couple of months, we’ve been covering the growing list of space stocks. Below is a snapshot of our space-stock basket with SpaceX (SPCX) now included.
Obviously with a $2.2 trillion market cap, SPCX dwarfs the rest of the group. The 26 other stocks in the basket have a combined market cap of just under $200 billion; less than 10% the size of SpaceX!
While the space stocks had massive runs higher ahead of the SPCX IPO, today they’re getting slammed. It appears that traders “bought the rumor” and are now “selling the news” in non-SPCX names, or maybe they were just using all of the other space stocks as proxies until SPCX began trading.
On average, the non-SPCX space stocks are down 10.5% today. In the past few weeks, there were stories that Virgin Galactic was rallying because traders thought its ticker — SPCE — stood for SpaceX. Shares of Virgin Galactic (SPCE) are trading down 30.8% today, so as dumb as it sounds, maybe there was some truth to the rumors.
Want more from Bespoke? You can start by joining our Think BIG mailing list where you’ll receive an interesting market stat in your inbox a few times per week. All we need is your email address. Join now by clicking here or on the image below.

Q2 2026 Earnings Conference Call Recaps: Adobe (ADBE)
Bespoke’s Conference Call Recaps use AI to summarize lengthy earnings calls. The commentary below is AI-generated and then edited by Bespoke for quality control. As always, none of these summaries should be construed as recommendations to buy or sell any securities, and investors should do their own research and/or consult with a financial professional before making any investment decisions.
Our latest recap available to Bespoke subscribers covers Adobe’s (ADBE) Q2 2026 earnings call.
![]()
Adobe (ADBE) is the leading provider of creative software, document productivity tools, and digital marketing platforms. Its products, including Photoshop, Illustrator, Premiere Pro, Acrobat, Firefly, and Adobe Experience Cloud, serve everyone from individual creators and students to Fortune 500 marketing teams. Adobe sits at the intersection of several major technology trends, making it a useful barometer for AI-driven content creation, digital advertising, enterprise marketing software, and the broader creator economy. Its scale is notable, with more than 850 million Acrobat and Express monthly active users and over 90 million users across its Creative freemium products. Adobe delivered a triple play this quarter, growing revenue 11% to $6.62 billion and raising full-year guidance, but the biggest story was a push toward aggressive AI-driven user acquisition. Management believes AI is fundamentally changing how people discover and use software, prompting Adobe to prioritize frictionless freemium experiences in Firefly, Acrobat AI Assistant, and Express over near-term ARR growth. Traffic to adobe.com grew more than 40%, Firefly ARR increased roughly 50% sequentially, and AI-first ARR surpassed $500 million. On the enterprise side, Adobe highlighted growing demand for agentic AI marketing tools, customer experience orchestration, and brand visibility solutions, bolstered by the recent SEMrush acquisition. Despite the triple play, ADBE shares fell 7.1% at the open on 6/12 due to news that the company’s CFO will be leaving…
Continue reading our Conference Call Recap for ADBE by becoming a Bespoke Institutional subscriber. You can sign up for Bespoke Institutional now and receive a 14-day trial to read our newest Conference Call Recap. To sign up, choose either the monthly or annual checkout link below:
Bespoke’s Morning Lineup – 6/12/26 – Ready for Launch
See what’s driving market performance around the world in today’s Morning Lineup. Bespoke’s Morning Lineup is the best way to start your trading day. Read it now by starting a two-week trial to Bespoke Premium. CLICK HERE to learn more and start your trial.
“I think we have a duty to maintain the light of consciousness, to make sure it continues into the future.” – Elon Musk
Below is a snippet of commentary from today’s Morning Lineup. Start a two-week trial to Bespoke Premium to view the full report.
Start a two-week trial to Bespoke Premium to continue reading today’s full Morning Lineup.
The Closer – Deal or No Deal, AI Chart Check, Z.1 – 6/11/26
Log-in here if you’re a member with access to the Closer.
- In reaction to more peace talk headlines, Brent crude oil fell to the lowest level since mid-March and the 30-year Treasury yield fell below the 50-DMA on an impressive outside day reversal.
- AI stocks have been pulling back leaving some Implementation basket stocks at interesting technical levels.
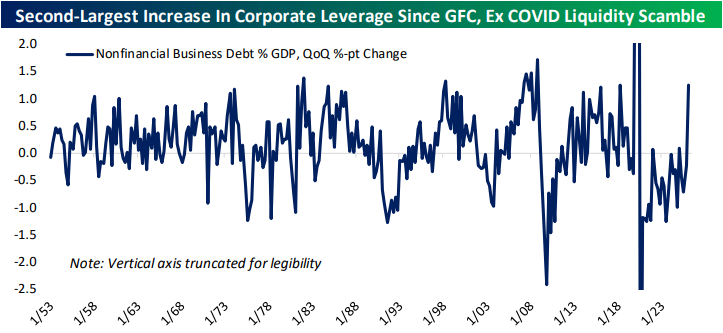
- Nonfinancial business debt as a percentage of GDP rose by one of the largest amounts on record since the end of the GFC.
See today’s full post-market Closer and everything else Bespoke publishes by starting a 14-day trial to Bespoke Institutional today!
Sentiment Sours as Stocks Pull Back
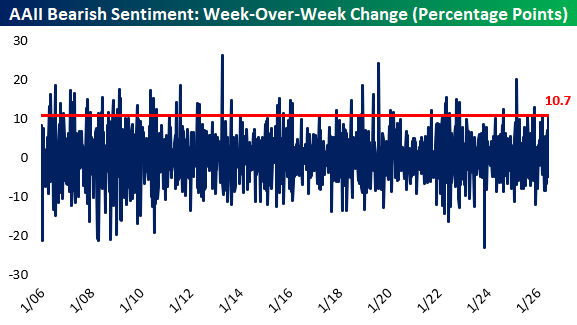
This week’s release of the American Association of Individual Investors survey resulted in 30.4% of respondents reporting bullish sentiment, tied for the lowest level of bullishness this year (tied with the March 19th release). Not only that, but the percentage of respondents reporting bearish sentiment ticked up to 47.7%, the highest since April 2nd.
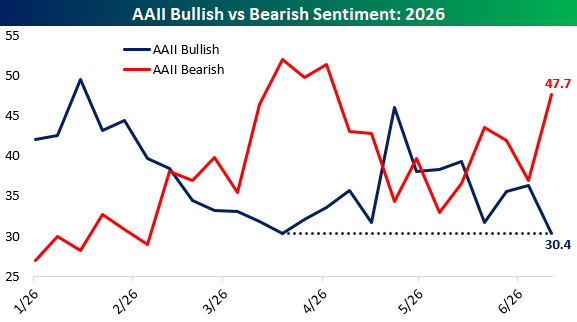
Through yesterday’s close, the S&P 500 has fallen 4.5% from its June 2nd all-time high. Consequently, bears are coming out of hibernation as the tech-led rally has lost some of its steam, and geopolitical uncertainty continues to rattle markets.
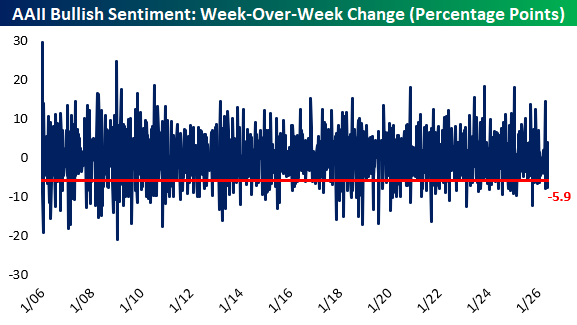
Bullish sentiment fell by 5.9 percentage points this week, a decline larger than roughly 80% of all weekly changes since 1987 when the survey began.
While the decline in bullish sentiment was notable, the deterioration was very apparent in the pop of bearishness. Bearish sentiment jumped by 10.7 percentage points this week, an increase larger than roughly 93% of all weekly changes since 1987 and 96% of the changes recorded so far in 2026.
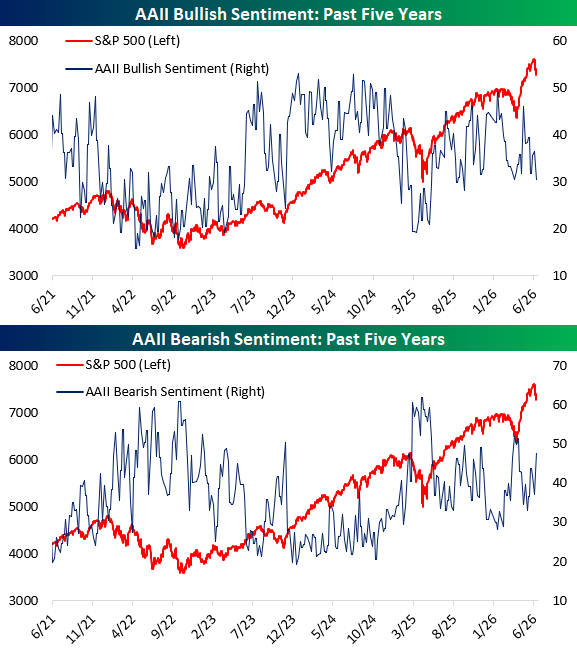
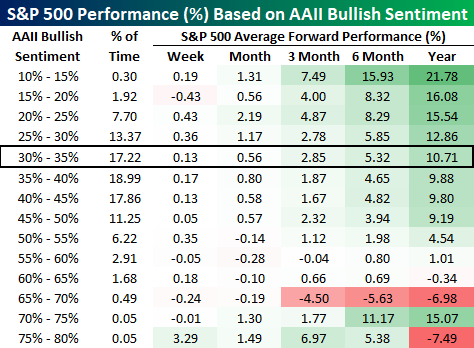
While the broader market has seen a pullback from its peak over the last week, and AAII bullish sentiment has dropped to its lowest level of the year, forward performance of the S&P 500 has been less grim in similar environments. Since 1987, AAII bullish readings between 30% and 35% have occurred roughly 17% of the time. Following those readings, the S&P 500 has posted positive average returns over every measured horizon, including gains of 2.9% over the next three months, 5.3% over the next six months, and 10.7% over the following year. In fact, the market tends to sour most when bulls are feeling their best, though the sample size for readings above 65% is slim. In contrast, some of the strongest forward returns, on average, occur when individual investors are least optimistic.
Want more from Bespoke? You can start by joining our Think BIG mailing list where you’ll receive an interesting market stat in your inbox a few times per week. All we need is your email address. Join now by clicking here or on the image below.
Q2 2026 Earnings Conference Call Recaps: Oracle (ORCL)
Bespoke’s Conference Call Recaps use AI to summarize lengthy earnings calls. The commentary below is AI-generated and then edited by Bespoke for quality control. As always, none of these summaries should be construed as recommendations to buy or sell any securities, and investors should do their own research and/or consult with a financial professional before making any investment decisions.
Our latest recap available to Bespoke subscribers covers Oracle’s (ORCL) Q4 2026 earnings call.
![]()
Oracle (ORCL) is one of the world’s largest enterprise software and cloud computing companies, selling the software, databases, and cloud infrastructure that large organizations use to run their operations. While Oracle is best known for its database business, the company has become an important player in cloud computing and AI because so much enterprise data already sits on Oracle systems. That gives Oracle a view into where companies are actually spending on AI and how quickly those projects are moving from testing to real-world deployment. Oracle’s quarter was dominated by one theme: demand for AI computing power is growing faster than the industry can build it. Cloud infrastructure revenue jumped 93%, while the company’s backlog of signed but unrecognized business reached $638 billion, up 363% year-over-year. Oracle signed $67 billion of new AI infrastructure contracts during the quarter and said customers continue to commit billions of dollars years in advance, often prepaying or supplying their own hardware to secure capacity. To keep up, Oracle plans to spend roughly $70 billion on data center expansion in fiscal 2027 and expects to bring significant new capacity online throughout the year. Outside of infrastructure, management said customers have largely moved beyond AI experimentation and are now deploying AI agents inside business software to automate tasks like recruiting, customer service, and healthcare workflows. Despite better-than-expected revenue and EPS, ORCL shares opened 11.2% lower on 6/11…
Continue reading our Conference Call Recap for ORCL by becoming a Bespoke Institutional subscriber. You can sign up for Bespoke Institutional now and receive a 14-day trial to read our newest Conference Call Recap. To sign up, choose either the monthly or annual checkout link below: