
Chart of the Day – Bull Market Ten-Baggers
Not the Best October for Semis
It’s feeling a little like Groundhog Day for semiconductor stocks lately, as the nearly 3% decline in the Philadelphia Semiconductor Index (SOX) has the index on pace for a sixth straight down day, a stretch in which it has fallen more than 10%. Since the SOX’s inception in 1994, this current rut would mark the 40th time that the index had a losing streak of at least six trading days. If you want a silver lining, consider that only 15 of the prior 39 streaks lasted a seventh day, so there’s a greater than 60% chance that the group finishes higher tomorrow. Fingers crossed. The longest losing streak for the SOX was nine trading days, and that happened twice: once in July 1996 and then again in 2006.

The chart below shows each of the prior six-day losing streaks on a long-term chart of the SOX. The current streak is the first since May 2025, or a little less than a year and a half ago. One aspect of the chart that stands out is how much less frequent streaks of the current length have become. In the 14 years from the SOX’s inception through 2008, there were 25 streaks of at least six down days in a row. In the 18 years since then, there have only been 15. That’s what you would call a maturing market.

As investors and traders we can try to read into these types of streaks as a sign of impending doom, or an impending bounce back, but the reality is that forward returns after six down days in a row for the SOX are roughly in line with the average for all periods since 1994. As shown in the chart below, median returns following the 39 prior six-day losing streaks were above the long-term average for all periods since 1994 over the following one, three, and 12 months, but below the average for the long-term over the next six months.

The incessant decline of semiconductor stocks over the last several trading days has been a pain to deal with, but markets go up and down, and we didn’t hear many complaints over the last year when it seemed like semis did nothing but go up.

Bespoke’s Morning Lineup – 10/14/26 – CP-High
See what’s driving market performance around the world in today’s Morning Lineup. Bespoke’s Morning Lineup is the best way to start your trading day. Read it now by starting a two-week trial to Bespoke Premium. CLICK HERE to learn more and start your trial.
“If you want total security, go to prison. There you’re fed, clothed, given medical care and so on. The only thing lacking… is freedom.” – Dwight D. Eisenhower
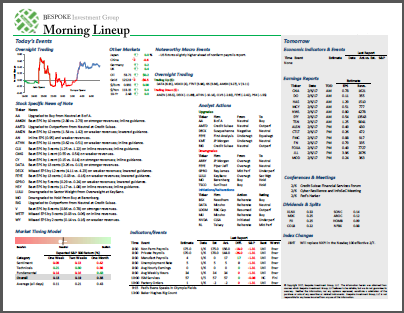
Below is a snippet of commentary from today’s Morning Lineup. Start a two-week trial to Bespoke Premium to view the full report.
Heading into this morning’s CPI report, equity futures were modestly higher for the S&P 500 while the Nasdaq was slightly lower. The gains came despite higher oil prices, but lower Treasury yields provided a tailwind. Gold prices were slightly lower while Bitcoin was up nearly 1%.
The gains were fleeting, though. Headline CPI was right in line with expectations while Core CPI was a tenth hotter. The immediate reaction has been lower equity prices and higher yields.
It was another down but not drastically lower session for Asian stocks last night as the Nikkei fell less than 0.1% for its fifth straight decline. Chinese stocks were weaker as the Shanghai Composite dropped closer to 1% and the Kospi was right in the middle at 0.4%. The culprit behind the weakness continues to be AI as investors worry about future investment down the road. CPI in China rose 0.2% m/m which was weaker than the 0.3% forecast while PPI came in hotter than expected on a y/y basis (5.0% vs 4.4%). Chinese trade data also showed a major surge in exports with a 36.3% y/y gain versus forecasts for an increase of 25.5%. We have more coverage of the economic data from China in the commentary section of the Morning Lineup.
In what seems like a recurring trend lately, even as Asian stocks were lower, European stocks are in the green this morning. The STOXX 600 is up 0.5% with Germany and France leading the gains, while Italy lags, barely hanging on to positive territory. Wholesale prices in Germany rose more than expected while Spanish CPI was inline with forecasts.
Doubts over the durability of AI investment have put pressure on technology stocks over the last one to two weeks, and semis have been victim to the decline. The sector broke its downtrend from the summer peak over a month ago, and while it’s still comfortably above that downtrend line, just yesterday it traded below the 50-DMA before rallying later in the day to finish slightly above.

Despite the intraday rebound, the Philadelphia Semiconductor Index (SOX) has still declined for five straight days. Five-day losing streaks are never fun when you’re in the middle of one, but for the SOX, they’re common. The current one is the 98th such streak since 1994, but less than half of those have extended to a six-day streak.

Shifting to the economy, the September CPI report was the major area of focus this morning, and today’s report was the 66th straight month that the year/year headline reading was above 2%. Over the last 100 years, this current streak is just the third time that consumer inflation has been above the Fed target for five years or longer. That said, the current streak is nowhere near close to eclipsing either of the two longer streaks which lasted 129 months and 242 months and occurred with a gap of less than a year between the two. Essentially, from February 1966 through October 1997, headline CPI was above 2% on a y/y basis.

Start a two-week trial to Bespoke Premium to continue reading today’s full Morning Lineup.
Bespoke’s Consumer Pulse Report – October 2026
Bespoke’s Consumer Pulse Report is an analysis of a huge consumer survey that we run each month. Our goal with this survey is to track trends across the economic and financial landscape in the US. Using the results from our proprietary monthly survey, we dissect and analyze all of the data and publish the Consumer Pulse Report, which we sell access to on a subscription basis. Sign up for a 30-day free trial to our Bespoke Consumer Pulse subscription service. With a trial, you’ll get coverage of consumer electronics, social media, streaming media, retail, autos, and much more. The report also has numerous proprietary US economic data points that are extremely timely and useful for investors.
We’ve just released our most recent monthly report to Pulse subscribers, and it’s definitely worth the read if you’re curious about the health of the consumer in the current market environment. Start a 30-day free trial for a full breakdown of all of our proprietary Pulse economic indicators.
The Closer – Freight Hit, AI Credit, Housing Hurt – 10/13/26
Log-in here if you’re a member with access to the Closer.
- Tanker rates and other freight cost indicators continue to soar as there have been a number of attacks on merchant vessels.
- CoreWeave (CRWV) credit spreads, a uniquely exposed proxy for AI, have blown out over the past week.
- There has been an acceleration in deteriorating housing affordability.

See today’s full post-market Closer and everything else Bespoke publishes by starting a 14-day trial to Bespoke Institutional today!
Market Cap Disconnects
As we discussed in an earlier post, large-caps have been outperforming small-caps recently. As shown below, year to date it is the Nasdaq 100 that has rallied the most, up over 20%. Up until recently, small-caps and micro-caps were in the lead, but they’ve both been fading since the summer as large-caps have continued to push higher.

Coming into today, small-caps were trading well below their 50-DMAs in oversold territory, while large-caps were trading well above their 50-DMAs in overbought territory. As shown below, it’s rare to see such a wide divergence in these measures.
In fact, the spread between 50-DMAs for the S&P 500 versus the Russell 2,000 and the Nasdaq 100 versus the Russell 2,000 are in the 99th and 98th percentile of readings, respectively.

Based on speculator positioning, investor sentiment towards large-caps and small-caps is disconnected as well. In last night’s Closer, we recapped the latest positioning data from the CFTC’s Commitments of Traders report. We typically express this data as the net share of open interest that is long or short in various futures contracts. As shown below, positioning for small caps has gotten overwhelmingly net short at -20%; the lowest since August 2025. Meanwhile, the Nasdaq has seen a surge in long bets as net positioning just reached its most optimistic levels since July 2020.

Taking the standard deviations of these readings and comparing large caps (the S&P 500 and Nasdaq 100) to small caps (the Russell 2,000), current spreads are historically wide. The S&P 500 versus the Russell is just off of peak readings from early September, but nonetheless, sits in the top quartile of readings over the history of the CFTC data. The Nasdaq, on the other hand, indicates the highest share of long bets relative to small caps in almost a decade (April 2017).

Small Business Problems
This morning, the NFIB published its latest small business sentiment readings. The overall optimism index disappointed, falling to 97.9, slightly weaker than the expected reading of 98.0. One key item from the September report was a big shift in the most important problem reported by small businesses. As shown in the table below, the share of firms reporting inflation and quality of labor as their biggest problems surged (both were top-decile monthly gains). Taxes and poor sales ranked as the most pressing issues for the next-largest share of firms.

The largest share of businesses cited quality of labor as their biggest issue in September. That index rose to 26, up three points month over month, leaving it just shy of the recent high of 27 hit two months ago. That earlier high came on a much larger eight-point monthly jump. Even so, the index currently sits in the 97th percentile of readings going back to 1986, and the September gain likewise ranks in the top decile.
Although that suggests small businesses are struggling to find quality workers, cost of labor no longer seems to be a prevalent issue. That index has collapsed a cumulative eight points since its all-time high in May. Now at 6, it is at the lowest level since December 2020.

Behind labor concerns, government-related categories have historically accounted for a large share of responses for the most important problems. On a combined basis, respondents pointing to regulation or taxes as their biggest issues experienced a huge decline in September, with a five-point drop in taxes and a two-point drop in regulation. That cumulative seven-point decline was the largest single-month drop for these two categories since July 2013 and brought the reading to new multi-year lows.

Of course, large declines in one set of problems mean the share must rise elsewhere. In September, poor sales and inflation picked up the difference. Poor sales rose only one percentage point to 11. While that wasn’t the largest monthly gain, and the level remains below its historical median, it is tied for the highest print since February 2021.
Inflation is not being reported as the largest problem at anywhere near the rate it was in 2021/2022; however, current readings remain historically elevated and are once again climbing. Additionally, the four-percentage-point increase in September was the largest monthly gain since July 2024 and ranks in the top decile of monthly moves over the survey’s history.


Chart of the Day – Analyst Sentiment Extremes
Staples Is on a Roll. Can It Clear the Shelf?
Consumer Staples made it seven in a row yesterday, recording its longest winning streak since the seven trading days ending on 8/21/24. The sector has gained 5.26% during the streak, bringing it from oversold to overbought territory in short order, and yesterday was its first overbought close since 8/24/26, ending a 33-trading-day stretch without one.
As shown below, winning streaks of this length haven’t been especially common. Since 1990, Consumer Staples has recorded 37 prior streaks lasting seven or more trading days. The longest lasted 13 days in May 1996.

The rally also brings Staples back to a familiar hurdle. After peaking in February, the sector has made a series of lower highs, with rebounds in May and late July stopping short of the prior peaks. Its latest advance has brought it close to the downtrend connecting those highs. Getting above that resistance would be encouraging for investors in the sector, although the sector still has a way to go before it catches its February high.

Historically, performance after winning streaks of seven or more trading days has been mixed in the near term. Staples has averaged a decline of 0.18% over the next week and a gain of 0.53% over the next month, with positive returns less than half the time at both intervals. Longer-term results have been more positive. Six months out, the sector averaged a gain of 4.89%, with gains 73% of the time. One year out, the average gain is 9.80%, with positive returns 83.8% of the time. For now, the immediate test is whether this rally can carry Staples above the downtrend that has capped its rebounds since February.
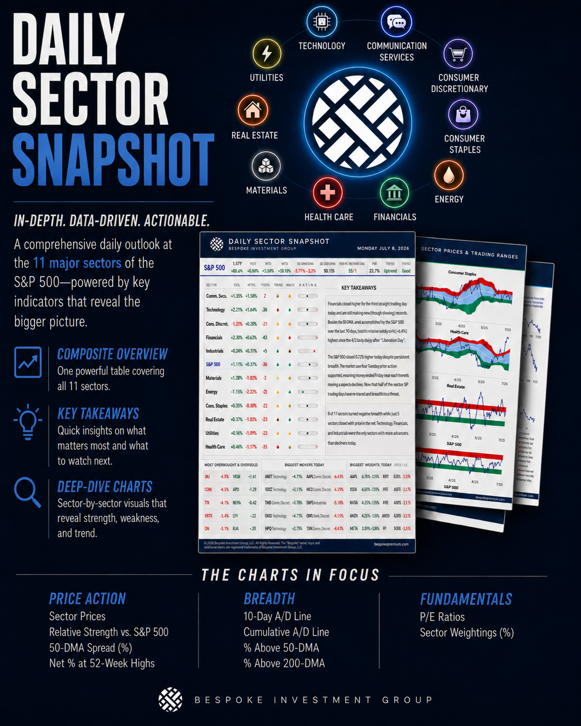
You can find more sector research like this in Bespoke’s Daily Sector Snapshot.
Read about Bespoke’s premium membership options to find out how to receive our Sector Snapshot in your inbox daily.
Rotation Away From AI Lately
There’s been a big divergence between large-caps and small-caps lately. As shown below, large-cap index ETFs entered today trading in “overbought” territory, solidly above their 50-DMAs. Small-caps and micro-caps, however, have been moving lower and entered today at “oversold” levels. And just as you would expect given where large and small caps are, mid caps are right in the middle in neutral territory!

September was a horrible month for the “average” stock even though the cap-weighted S&P 500 held up fine on the back of mega-caps and big AI infrastructure stocks like the semis.
In the last week or so, however, we’ve finally seen “average” start to do better than average, while areas like the semis have gotten hit. The price charts below for the semis ETF (SOXX) and the S&P 500 Equal Weight ETF (RSP) highlight this recent rotation.

The biggest and most well-known consumer stocks also had a rough September as interest rates and oil prices rose sharply. These stocks have also bounced back a bit in the last week, as shown in the snapshot from our Trend Analyzer tool below:

“Big software” is another area that has quietly been doing very well in recent months. Below are price charts for six of the most well-known stocks in the Software ETF (IGV). You’d be hard-pressed to find better-looking charts right now outside of the Energy sector.
In the first half of 2026, software was treated like a dead industry group because of the perceived threat of obsolescence from AI. As we said at the time, while some software stocks will likely fall victim to AI, others will adapt and largely benefit from AI implementation. Recent price action for names like Salesforce (CRM), ServiceNow (NOW), and Atlassian (TEAM) shows how quickly narratives can change:
