Q3 2025 Earnings Conference Call Recaps: CarMax (KMX)
Bespoke’s Conference Call Recaps use AI to summarize lengthy earnings calls. The commentary below is AI-generated and then edited by Bespoke for quality control. As always, none of these summaries should be construed as recommendations to buy or sell any securities, and investors should do their own research and/or consult with a financial professional before making any investment decisions.
Our latest recap available to Bespoke subscribers covers CarMax’s (KMX) Q2 2026 earnings call.
![]()
CarMax (KMX) is the largest used-car retailer in the US, operating with an omni-channel model that lets customers buy online, in-store, or a blend of both. It serves individual consumers through retail vehicle sales and sourcing, and dealers via its wholesale auctions. The company’s financing arm, CarMax Auto Finance (CAF), broadens access across the credit spectrum while generating profits. This quarter, sales fell 6% to $6.6B, with retail unit comps down 6.3%. A $1,000 monthly depreciation swing forced price cuts and margin compression, though management stressed improved competitiveness heading into Q3. Consumer demand was soft, especially among higher-FICO buyers, but older, higher-mileage cars gained traction. The new “Wanna Drive?” campaign launched with a record-high NPS (Net Promoter Score) and heavier planned ad spend. Cost control remained central, with a goal of $150M in SG&A savings, aided by AI adoption. CAF penetration rose modestly, but provisions increased on weaker 2022–23 vintages, even as newer loans outperformed. Management reaffirmed plans to grow market share despite an aggressive competitive environment. With weaker results in a tougher environment, KMX shares tumbled more than 20% on 9/25…
Continue reading our Conference Call Recap for KMX by becoming a Bespoke Institutional subscriber. You can sign up for Bespoke Institutional now and receive a 14-day trial to read our newest Conference Call Recap. To sign up, choose either the monthly or annual checkout link below:
Chart of the Day: AI Dominance
Bespoke’s Morning Lineup – 9/25/25 – Three’s a Streak
See what’s driving market performance around the world in today’s Morning Lineup. Bespoke’s Morning Lineup is the best way to start your trading day. Read it now by starting a two-week trial to Bespoke Premium. CLICK HERE to learn more and start your trial.
“The best fiction is far more true than any journalism.” – William Faulkner

Below is a snippet of commentary from today’s Morning Lineup. Start a two-week trial to Bespoke Premium to view the full report.
Just when it seems like the market can only go up, it does nothing but go down. Futures on the S&P 500 and Nasdaq are in firmly negative territory this morning, putting both indices on pace for their third straight day of losses. The S&P 500 is indicated to open down by about 0.4% while the Nasdaq is on pace to open down closer to 0.6%. The weakness in US stocks follows a weak morning in Europe, where the STOXX 600 is down over 0.75%, and other major country-level indices are down by 0.15% to 1.0%.
Despite the weaker tone in equities, investors aren’t rotating into treasuries as yields are modestly higher as well. Crude oil is also lower, although gold and other precious metals are all up at least 0.5%. One are where investors certainly aren’t rotating is into crypto. Bitcoin is down nearly 2% while Ethereum is down over 3.7% as it struggles to hang onto the $4,000 level. There may have been a decent amount of froth in the sector heading into the month, but it has definitely worked itself off over the last several days.
We also have a ton of economic data to contend with this morning, with Wholesale Inventories, GDP, Personal Consumption, Durable Goods, and Jobless Claims at 8:30, followed by Existing Home Sales at 10 and the KC Fed Manufacturing report at 11. Besides those reports, there are also a ton of Fed speakers on the calendar. Should be fun! Of the reports hitting the tape at 8:30, most of them came in better than expected, with a much weaker-than-expected initial jobless claims reading of 218K being the big standout. The market response has been even higher yields and lower futures.
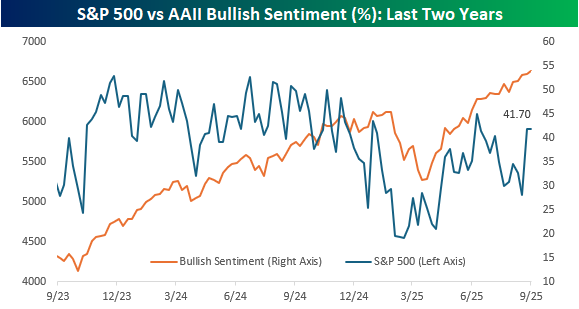
While the last couple of days have started to show some cracks in the market, sentiment was little changed based on the weekly survey from the American Association of Individual Investors (AAII). Bullish sentiment remained unchanged at 41.7% while bearish sentiment dropped to 39.2% and neutral sentiment increased to 19.1%. As shown in the chart below, even as stocks have recovered from their April lows, sentiment hasn’t experienced anywhere nearly as big a lift.
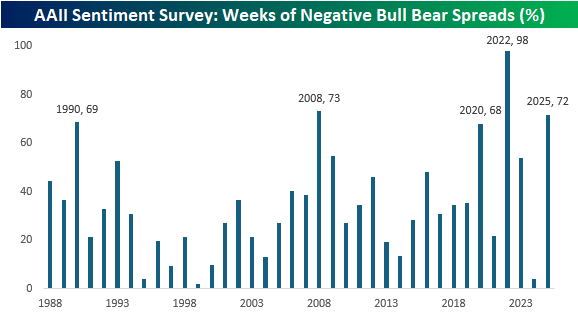
In fact, while the bull-bear spread in sentiment broke a streak of seven weeks in a row of negative readings, nearly three-quarters of all weeks this year have had negative spreads, and if the year were to end now, it would rank as the third-most weeks of negative bull-bear spreads in the survey’s history. The only years with a higher percentage were 2022, when the spread was only positive once (March 2022), and 2008, when 73% of weekly readings were negative. Outside of those two years, the only others when the bull-bear spread was negative more than two-thirds of the time were 1990 (69%) and 2020 (68%).
The Closer – Trucking, Energy System, CFO Survey – 9/24/25
Log-in here if you’re a member with access to the Closer.
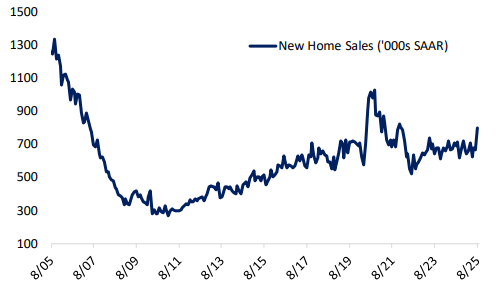
Looking for deeper insight into markets? In tonight’s Closer sent to Bespoke Institutional clients, we kick off with a look into trucking activity (page 1) and various baskets including those of trucking stocks, restaurant stocks, and private equity names (page 2). We then recap the latest new home sales data (page 3) before pivoting over to a note on energy (pages 4 – 6). We then close out with a recap of today’s CFO survey (pages 7 & 8).
See today’s full post-market Closer and everything else Bespoke publishes by starting a 14-day trial to Bespoke Institutional today!
Daily Sector Snapshot — 9/24/25
Eye-Popping Moves in Quantum Stocks
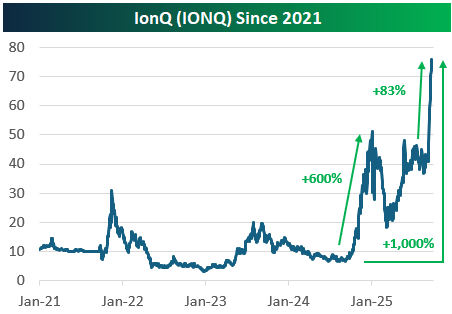
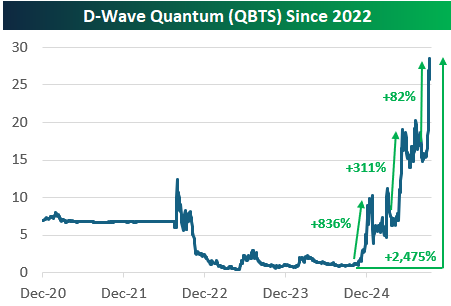
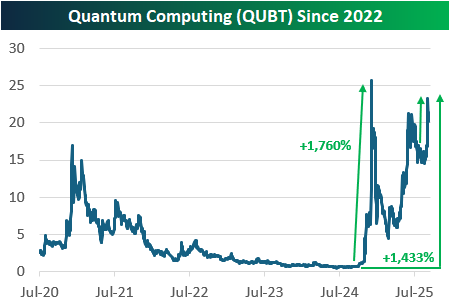
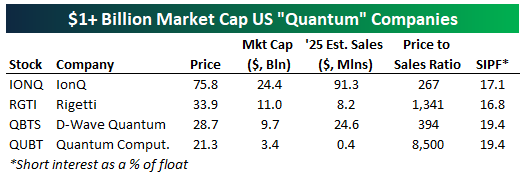
Quantum computing stocks have had another parabolic run recently. There are now four “quantum” stocks with market caps in the billions, and we provide recent price charts of them below.
IonQ (IONQ) is up the least of the bunch with a gain of 1,000% since its lows late last year. Quantum Computing (QUBT) is up the 3rd most with a gain of 1,433%, while Rigetti (RGTI) and D-Wave Quantum (QBTS) are both up more than 2,400%.
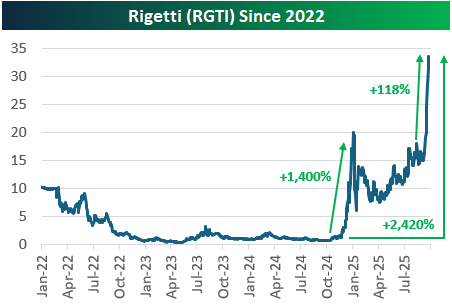
At their core, these “quantum” companies are working on the long-term promise of quantum computing: leveraging quantum mechanics to perform computations exponentially faster than today’s computers. The technology has the potential to transform industries such as cryptography, pharmaceuticals, and logistics, but the reality is that commercial viability remains decades away. Systems are still experimental, error-prone, and difficult to scale, with many breakthroughs required before they can solve real-world problems at scale. That hasn’t stopped speculators from bidding up quantum stocks to ungodly valuations, though.
As shown below, IONQ is projected to do $91.3 million in sales this year, which is the most of the group. Its market cap is all the way up to $24.4 billion, however, which gives it a price to sales ratio of 267! And that’s the smallest P/S ratio of the four stocks shown. 2025 sales estimates for RGTI are $8.2 million, while they’re $24.6 million for QBTS and just $400k for QUBT.

Q3 2025 Earnings Conference Call Recaps: Cintas (CTAS)
Bespoke’s Conference Call Recaps use AI to summarize lengthy earnings calls. The commentary below is AI-generated and then edited by Bespoke for quality control. As always, none of these summaries should be construed as recommendations to buy or sell any securities, and investors should do their own research and/or consult with a financial professional before making any investment decisions.
Our latest recap available to Bespoke subscribers covers Cintas’ (CTAS) Q1 2026 earnings call.
![]()
Cintas (CTAS) provides uniforms, safety gear, first aid, and facility services to over one million businesses across North America, ranging from healthcare and education to state and local governments. The company is best known for its massive uniform rental business, but it also runs first aid and fire protection divisions. What makes Cintas stand out is its ability to thrive across economic cycles by converting “do-it-yourself” customers into long-term outsourcing clients, giving investors a real-time window into small and mid-sized business sentiment across the US. Q1 FY26 revenue grew 8.7% to $2.72B, with organic growth of 7.8%. Themes included resilient demand despite “somewhat uncertain” macro conditions, steady customer behavior, and continued success converting non-programmers. Labor market softness was noted but was not viewed as limiting growth. Tariff impacts are being managed via a diverse supply chain, rather than passed off on customers. Tech investments like AI, SAP, myCintas, and SmartTruck are improving customer self-service and salesforce productivity. CTAS shares stayed flat most of the day on 9/24 despite EPS and revenue beats…
Continue reading our Conference Call Recap for CTAS by becoming a Bespoke Institutional subscriber. You can sign up for Bespoke Institutional now and receive a 14-day trial to read our newest Conference Call Recap. To sign up, choose either the monthly or annual checkout link below:
Chart of the Day – Lithium and Uranium Power Surge
Q2 2025 Earnings Conference Call Recaps: Thor Industries (THO)
Bespoke’s Conference Call Recaps use AI to summarize lengthy earnings calls. The commentary below is AI-generated and then edited by Bespoke for quality control. As always, none of these summaries should be construed as recommendations to buy or sell any securities, and investors should do their own research and/or consult with a financial professional before making any investment decisions.
Our latest recap available to Bespoke subscribers covers Thor Industries’ (THO) Q4 2025 earnings call.
![]()
Thor Industries (THO) is the world’s largest manufacturer of recreational vehicles, producing towable trailers and motorhomes under brands like Airstream, Jayco, and Keystone. The company gives unique insight into discretionary consumer spending, dealer sentiment, and broader macro forces like interest rates, tariffs, and labor market health, since RVs are big-ticket purchases that rely heavily on financing and consumer confidence. THO does not have a standard quarterly earnings call, but does release a presentation and Q&A document. In the Q&A, the company described a mixed backdrop: North American dealers are cautiously optimistic, but industry shipments are forecast to decline about 6% in the second half of 2025. Retail demand strengthened in spring, yet THO expects a low- to mid-single digit retail decline in fiscal 2026, citing affordability challenges and tariff pressures. Rising household debt and a softening labor market are clouding consumer sentiment, though falling borrowing costs could unlock demand if rates continue to ease. In Europe, sales remain flat as mainstream models lose share to premium and entry-level offerings, though new products debuted at Düsseldorf were well received. Innovation was a bright spot, with Keystone’s product refresh and the launch of Jayco’s Entegra Embark hybrid Class A motorhome, a notable step toward electrification. On the better-than-expected results, THO shares rose as much as 7% on 9/24…
Continue reading our Conference Call Recap for THO by becoming a Bespoke Institutional subscriber. You can sign up for Bespoke Institutional now and receive a 14-day trial to read our newest Conference Call Recap. To sign up, choose either the monthly or annual checkout link below:
Q3 2025 Earnings Conference Call Recaps: AutoZone (AZO)
Bespoke’s Conference Call Recaps use AI to summarize lengthy earnings calls. The commentary below is AI-generated and then edited by Bespoke for quality control. As always, none of these summaries should be construed as recommendations to buy or sell any securities, and investors should do their own research and/or consult with a financial professional before making any investment decisions.
Our latest recap available to Bespoke subscribers covers AutoZone’s (AZO) Q4 2025 earnings call.
![]()
AutoZone (AZO) is the largest US retailer and distributor of aftermarket automotive parts and accessories, operating more than 7,000 stores across the US, Mexico, and Brazil. It serves both do-it-yourself (DIY) customers and professional repair shops. The company’s massive hub and mega hub store network, along with new distribution centers, gives it an edge in parts availability and delivery speed. Q4 FY25 results held up despite tariffs and FX headwinds. Domestic commercial sales jumped 12.5% on a 16-week basis, with traffic up 6.2% and ticket growth of 3.7%, highlighting share gains from faster delivery and expanded parts availability. DIY comps rose 2.2% as tickets climbed 3.9% while traffic fell 1.9%, with discretionary categories showing “green shoots” for the first time since 2023. International comps grew 7.2% constant currency, though Mexico faced a $36M FX headwind. Inflation and tariffs remain central, with at least 3% SKU inflation expected and $120M in LIFO charges projected for Q1 FY26. AutoZone opened a record 304 net new stores this year, representing confidence in long-term demand. AZO shares were up less than 1% on 9/23 after posting weaker results…
Continue reading our Conference Call Recap for AZO by becoming a Bespoke Institutional subscriber. You can sign up for Bespoke Institutional now and receive a 14-day trial to read our newest Conference Call Recap. To sign up, choose either the monthly or annual checkout link below: