Bespoke Stock Profile: Symbotic (SYM)
Home Sale Strength
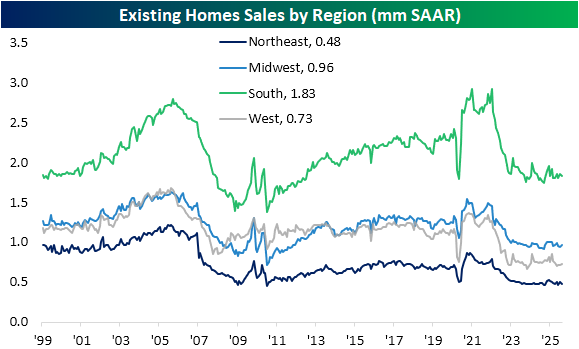
It was an eventful week for housing data as New Home Sales were released on Wednesday and Existing Home Sales came out yesterday. Working in reverse order, Existing Home Sales came in ahead of forecasts on a national level, although the sales pace has remained sluggish relative to pre-pandemic or early post-pandemic levels. As shown below, on a regional basis, sales are strongest in the South by a solid margin, although that is historically normal. Current levels are hovering around the lows from the spring of 2020 and the same applies to the West and Northeast. As for the Midwest, sales are well below those lows.
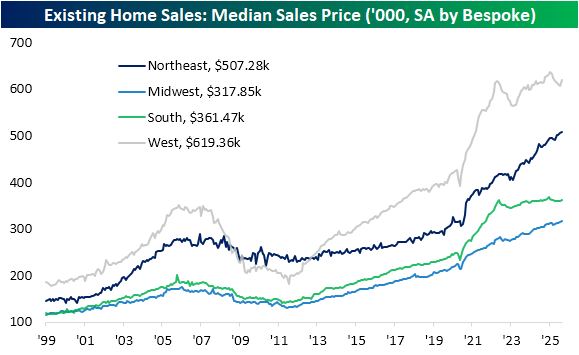
Turning over to prices, trends have a bit more variation. Prices are highest in the West and that has been the case for over a decade now. With that said, the past few years since higher rates came into play have seen far less steady gains compared to the exponential move higher from 2020 to 2022. Likewise, the South has seen prices flatline in the past few years amid higher inventories. The Midwest and Northeast are entirely different stories. The torrid price gains of the early pandemic years have continued for those two regions with only a minor dip occurring in late 2022/early 2023.
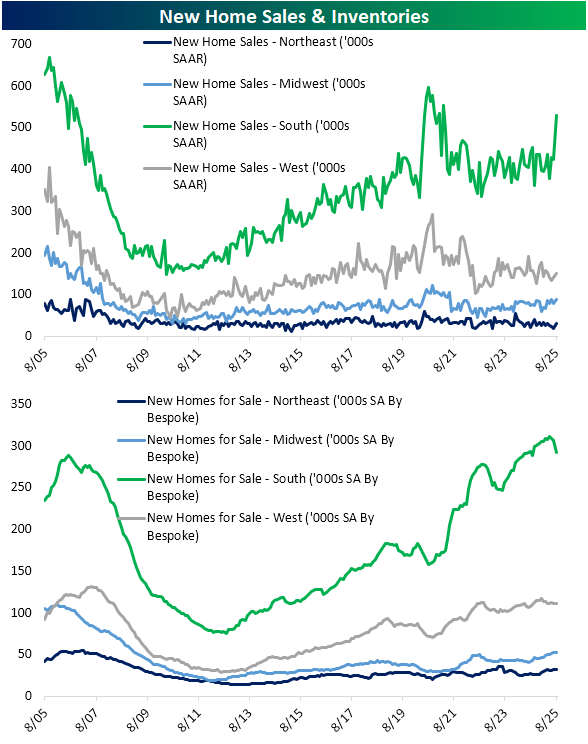
Turning over to New Home Sales data updated on Wednesday, there was a very strong print on a national scale, surging 20% MoM versus estimates of a small decline. The huge beat was driven by strong sales in completed homes, although sale of homes under construction also surged. Geographically, that strength was broad with all regions ticking up during the month of August. While accounting for the smallest share of total homes, sales in the Northeast were up an impressive 72% MoM and sales in the South (the largest share of national sales and inventories) jumped by 24.7%. As shown in the second chart below, new homes for sale (inventories) have fallen meaningfully after the latest surge in sales in the South. Meanwhile, the Midwest now has some of the highest inventories for new homes since February 2009.

Matrix of Economic Indicators – 9/26/25
Our Matrix of Economic Indicators provides a concise summary analysis of the US economy’s momentum. We combine trends across the dozens and dozens of economic indicators in various categories like manufacturing, employment, housing, the consumer, and inflation to provide a directional overview of the economy.
To access our newest Matrix of Economic Indicators, start a two-week free trial to either Bespoke Premium or Bespoke Institutional now!

Price and 10-Day A/D Line Divergence
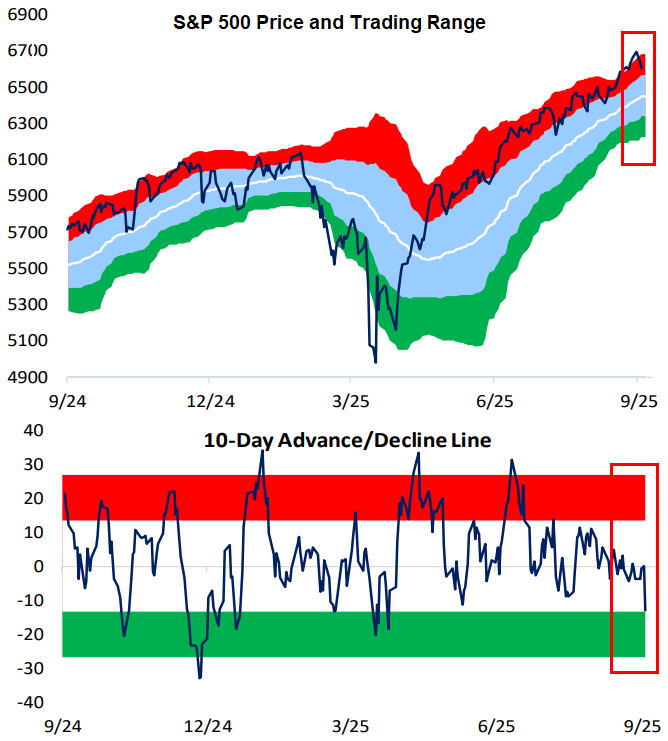
While the S&P 500 remains overbought in price (>1 standard deviation above its 50-DMA), its 10-day advance/decline line actually moved near oversold territory yesterday. The 10-day A/D line measures the average number of daily advancers minus decliners in an index over the last ten trading days. It’s a helpful measure of short-term market breadth. When the 10-day gets overbought, it’s a sign that stocks have had a large upward thrust over the last two weeks, often preceding some downside mean reversion. The opposite is also the case: when the 10-day gets oversold, it’s a sign that stocks within an index have struggled in the short-term, and thus upside mean reversion may be in store.
Usually, an index’s price and its 10-day track each other, but for the top-heavy S&P, there can be divergences because of how large the mega-caps have become. Because the mega-caps have held up well over the last two weeks, it has masked underlying weakness in the majority of stocks.
From a mean reversion perspective, the oversold 10-day suggests that the average stock could be in store for a bounce, while the mega-caps causing the S&P’s price to remain overbought could take a breather.
Bespoke subscribers can monitor the 10-day A/D line and other measures of breadth in our daily Sector Snapshot. If you’d like to check it out, start a trial to Bespoke Premium today.
Bespoke’s Morning Lineup – 9/26/25 – Wistful for Monday
See what’s driving market performance around the world in today’s Morning Lineup. Bespoke’s Morning Lineup is the best way to start your trading day. Read it now by starting a two-week trial to Bespoke Premium. CLICK HERE to learn more and start your trial.
“This is the way the world ends, not with a bang but a whimper.” – T.S. Eliot

Below is a snippet of commentary from today’s Morning Lineup. Start a two-week trial to Bespoke Premium to view the full report.
Futures were higher heading into this morning’s economic data, and after the 8:30 batch of data, equities have built modestly on their gains. Personal Income and Personal Spending were both a tenth higher than expected, and PCE inflation was in line with forecasts at both the headline and core levels. While the inflation data was right inline, it remains at uncomfortably high levels with y/y headline coming in at 2.7% while the core reading was 2.9%. As long as these readings can stay below 3%, markets should be able to handle it.
Mondays aren’t usually a day we look forward to, but looking back, it’s been the best day of the week. After riding the optimism of Fed rate cuts to record highs last week, investors took the weekend to think about it and liked what they saw. On Monday, the S&P 500 rallied for the third day in a row, hitting its eighth record high of the month and the 28th record high of the year.
Since that record high on Monday, however, the S&P 500 has traded down for three straight days and is now trading back to where it closed last Tuesday – before the Fed cut rates. Instead of optimism for lower rates, investors are increasingly worried that the market is getting ahead of itself as terms like euphoria and bubble enter the lexicon.
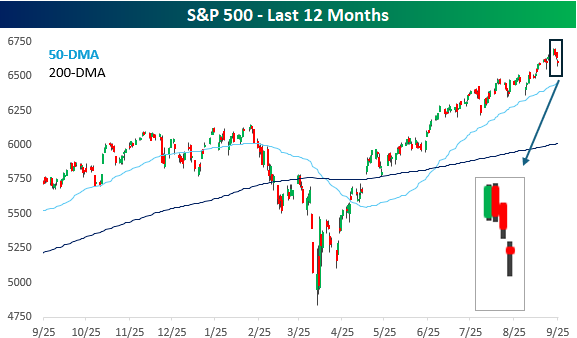
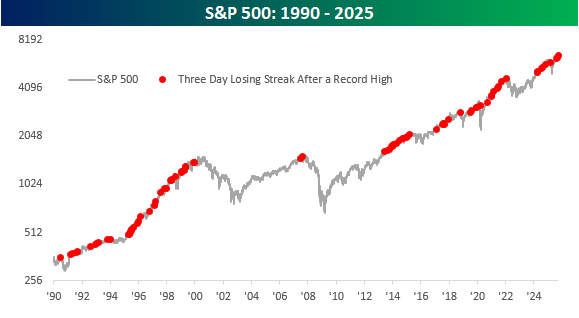
The severity of the declines this week has been extremely modest. Over the course of the three-day losing streak, the S&P 500 is down less than 1%, so if this type of ‘pullback’ makes you nervous, you’re taking too much risk. Besides the shallow nature of the decline, the fact that the S&P 500 is down three days in a row after hitting a record high is hardly unusual. The chart below shows the S&P 500 dating back to 1990, and the red dots show every three-day losing streak that followed a record closing high. Just this year, there have been three other occurrences. One occurred back in February ahead of the tariff-tantrum, but there was also another one in late July and then again in mid-August. Remember those? We didn’t either.
Looking at other occurrences, yes, similar scenarios have played out right around major market tops, but there were dozens more that no one remembers anymore. The only way we’ll know if this occurrence is a significant one is with hindsight, but the odds are that it’s not.
The Closer – Volatility, Price and Breadth, GDP – 9/25/25
Log-in here if you’re a member with access to the Closer.
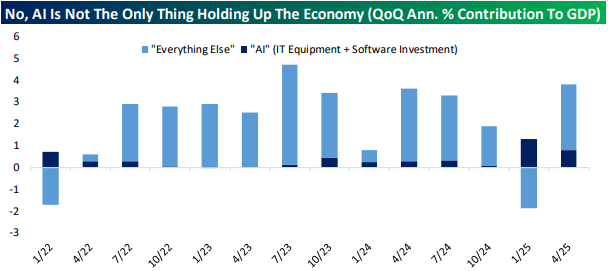
Looking for deeper insight into markets? In tonight’s Closer sent to Bespoke Institutional clients, we start out with a look at how the most volatile stocks have performed (page 1) in addition to a look at the historic disconnect between price and breadth (page 2). Next, we turn over to macro data with a review of the latest GDP figures including some data on AI’s impact on GDP and the update to the National Income and Product Accounts (pages 3-5). Next, we review existing home sales and affordability (page 6) before rounding out with a recap of claims data (page 7).
See today’s full post-market Closer and everything else Bespoke publishes by starting a 14-day trial to Bespoke Institutional today!
Record-High Price to Sales But Not For Equal Weight
As shown below, the S&P 500’s price-to-sales ratio has climbed to historically elevated levels, recently hitting 3.33. For context, the Dot-Com bubble peak in 2000 topped out at 2.27, and the post-COVID boom peaked at 3.21 before valuations pulled back. While strong corporate profitability and the AI growth theme have gotten us to these levels, this chart highlights just how extended valuations have become relative to revenues.
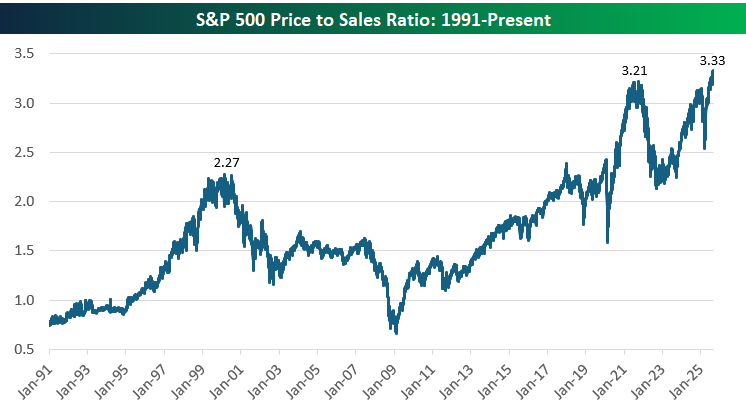
But there’s also a catch…
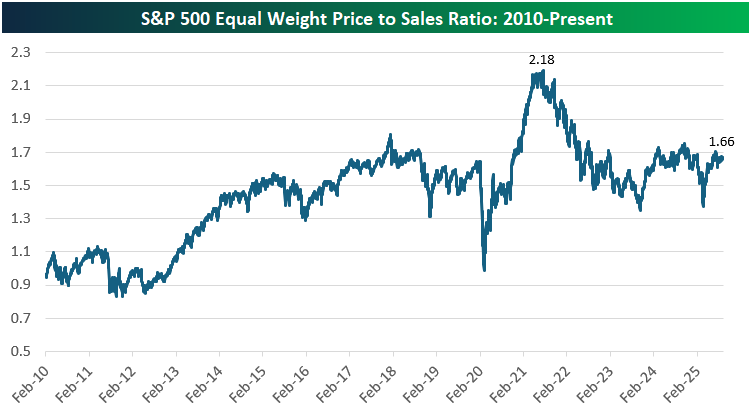
The equal-weighted version of the S&P 500 tells a different story, with its price-to-sales ratio currently sitting at 1.66, well below its 2021 peak of 2.18. This highlights the outsized role that mega-cap stocks have played in driving overall index valuations higher, as the typical stock trades at a much more modest multiple of sales compared to the market-cap-weighted index. While still elevated relative to the early 2010s, the equal-weight P/S ratio is right in the middle of its 12-year range. While valuation excesses are concentrated in the largest companies, much of the broader market is trading at far more reasonable levels.
The Bespoke 50 Growth Stocks – 9/25/25
The “Bespoke 50” is a basket of noteworthy growth stocks in the Russell 3,000. To make the list, a stock must have strong earnings growth prospects along with an attractive price chart based on Bespoke’s analysis. There were 7 changes to the list this week.
The Bespoke 50 is available with a Bespoke Premium subscription or a Bespoke Institutional subscription. With Bespoke Premium, you’ll receive a number of daily market updates from us along with our weekly newsletter and a portion of our investor tools. With Bespoke Institutional, you’ll receive everything that’s included with Premium plus additional daily macro analysis and more stock-specific research.
To see all 50 stocks that currently make up the Bespoke 50, simply start a two-week trial to Bespoke Premium or Bespoke Institutional.
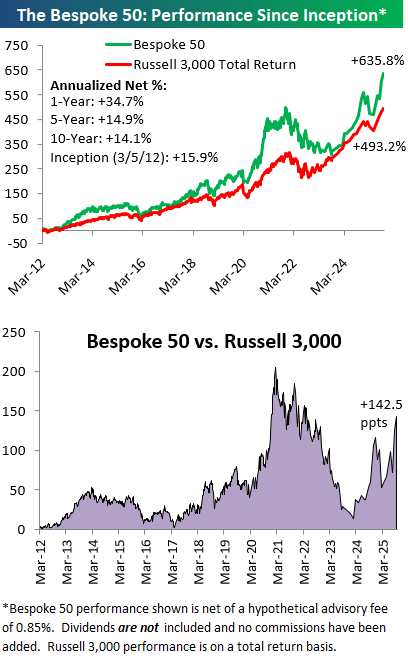
The Bespoke 50 performance chart shown does not represent actual investment results. The Bespoke 50 is updated monthly on Thursdays unless otherwise noted. Performance is based on equally weighting each of the 50 stocks (2% each) and is calculated using each stock’s opening price as of Friday morning after publication. Entry prices and exit prices used for stocks that are added or removed from the Bespoke 50 are based on Friday’s opening price. Any potential commissions, brokerage fees, or dividends are not included in the Bespoke 50 performance calculation, but the performance shown is net of a hypothetical annual advisory fee of 0.85%. Performance tracking for the Bespoke 50 and the Russell 3,000 total return index begins on March 5th, 2012 when the Bespoke 50 was first published. Past performance is not a guarantee of future results. The Bespoke 50 is meant to be an idea generator for investors and not a recommendation to buy or sell any specific securities. It is not personalized advice because it in no way takes into account an investor’s individual needs. As always, investors should conduct their own research when buying or selling individual securities. Click here to read our full disclosure on hypothetical performance tracking. Bespoke representatives or wealth management clients may have positions in securities discussed or mentioned in its published content.
Bespoke’s Weekly Sector Snapshot — 9/25/25
Q3 2025 Earnings Conference Call Recaps: KB Home (KBH)
Bespoke’s Conference Call Recaps use AI to summarize lengthy earnings calls. The commentary below is AI-generated and then edited by Bespoke for quality control. As always, none of these summaries should be construed as recommendations to buy or sell any securities, and investors should do their own research and/or consult with a financial professional before making any investment decisions.
Our latest recap available to Bespoke subscribers covers KB Home’s (KBH) Q3 2025 earnings call.
![]()
KB Home (KBH) is one of the largest US homebuilders, known for its Built-to-Order (BTO) model that lets buyers personalize floor plans, lots, and finishes through its design studios. The company primarily serves first-time and first move-up buyers, who make up about 70% of its customer base. Its footprint spans high-growth markets across the West, Southwest, Southeast, and Central regions. This quarter, ended 8/31, KBH generated $1.62B in revenue. Net orders were 2,950, with absorption of 3.8 per community (each community sold about 3.8 homes per month, on average). Mortgage rates falling about 60 bps gave buyers roughly $30K more purchasing power, though many remain cautious. The company cut build times to 130 days (122 for BTO) and lowered direct costs by about 3% YoY, sharpening its BTO advantage (250–400 bps margin higher than speculative homes, or “specs”). KBH canceled about 6,800 lots that no longer met underwriting hurdles as land prices soften. Better-than-expected results yielded modest gains for the stock on 9/25, up a bit more than 1%…
Continue reading our Conference Call Recap for KBH by becoming a Bespoke Institutional subscriber. You can sign up for Bespoke Institutional now and receive a 14-day trial to read our newest Conference Call Recap. To sign up, choose either the monthly or annual checkout link below: