Daily Sector Snapshot — 7/20/22
Bespoke Baskets Update — July 2022
Fixed Income Weekly: 7/20/22
Searching for ways to better understand the fixed income space or looking for actionable ideas in this asset class? Bespoke’s Fixed Income Weekly provides an update on rates and credit every Wednesday. We start off with a fresh piece of analysis driven by what’s in the headlines or driving the market in a given week. We then provide charts of how US Treasury futures and rates are trading, before moving on to a summary of recent fixed income ETF performance, short-term interest rates including money market funds, and a trade idea. We summarize changes and recent developments for a variety of yield curves (UST, bund, Eurodollar, US breakeven inflation and Bespoke’s Global Yield Curve) before finishing with a review of recent UST yield curve changes, spread changes for major credit products and international bonds, and 1 year return profiles for a cross section of the fixed income world.
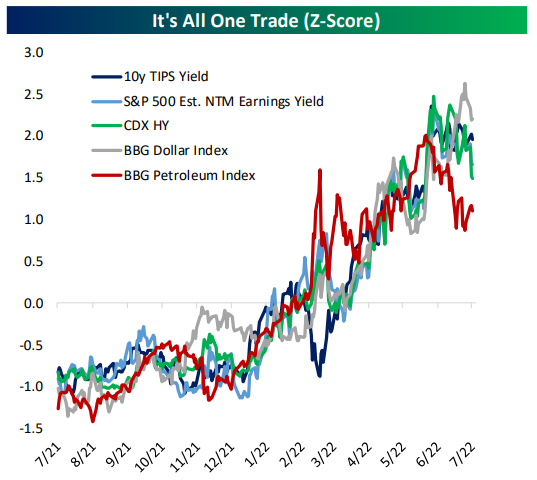
In this week’s report we take a look at how US fixed income is driving global risk appetite.
Our Fixed Income Weekly helps investors stay on top of fixed income markets and gain new perspective on the developments in interest rates. You can sign up for a Bespoke research trial below to see this week’s report and everything else Bespoke publishes free for the next two weeks!
Click here and start a 14-day free trial to Bespoke Institutional to see our newest Fixed Income Weekly now!
Best Performers Since Mid-June Low
Since June 16th, the market has reversed course higher, making the date at least a near-term bottom. From a technical perspective, the Russell 1000 broke through its 50-day moving average yesterday and broke above its upper downtrend line today. The 50-DMA is still moving lower, but this is the first time that the Russell 1000 has been above the 50-DMA since April 20th. However, the index is still 9.7% below its 200-DMA. These moves come as commodity prices have pulled back and earnings season begins.

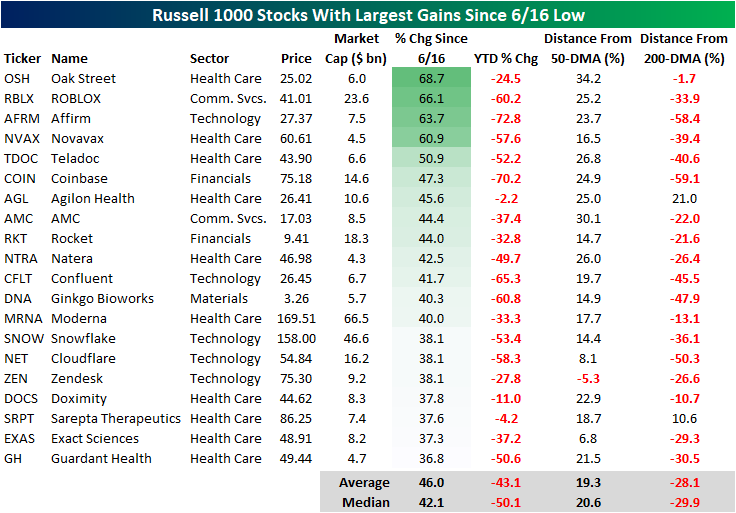
As we highlighted in a Chart of the Day earlier this week, the lagging sectors during bear market declines tend to be the leaders in bear market rallies, which is holding true in the bounce since 6/16. The table below shows the 20 best performing stocks in the Russell 1000 Index since the 6/16 low. As you can see, these stocks are all still down considerably on a YTD basis, declining a median of 50.1%. However, these stocks have rebounded by a median of 42.1% since the low on 6/16. Only one of these stocks is below its 50-DMA, and only two are above their respective 200-DMA. If you think that the bear market has concluded, these would be some of the names worth looking deeper into.
On the other hand, the best performing sectors during bear market declines tend to be the worst performing sectors during bear market rallies. Of the 20 worst performing Russell 1000 stocks since 6/16, 14 belong to the energy sector (which has been the best sector on a YTD basis by a wide margin). On a median basis, these 20 stocks are still up 13.6% on a YTD basis, but they’ve shed 13.7% of their value since the market bottomed in mid June. Notably, these stocks (on a median basis) are closer to their 200-DMAs than they are to their 50-DMAs. If you think that we are currently in a bear market rally that is bound to reverse course, these names would be worth looking deeper into.

Declines Abound in Mortgage Data
Roughly one month ago, the national average for a 30 year fixed rate mortgage peaked above 6%. Since then, the rate has pulled back and stabilized around 5.75% in the past several weeks. Although mortgage rates have stabilized a bit, they remain at some of the highest levels since 2008 and have been heading marginally higher in the past week.

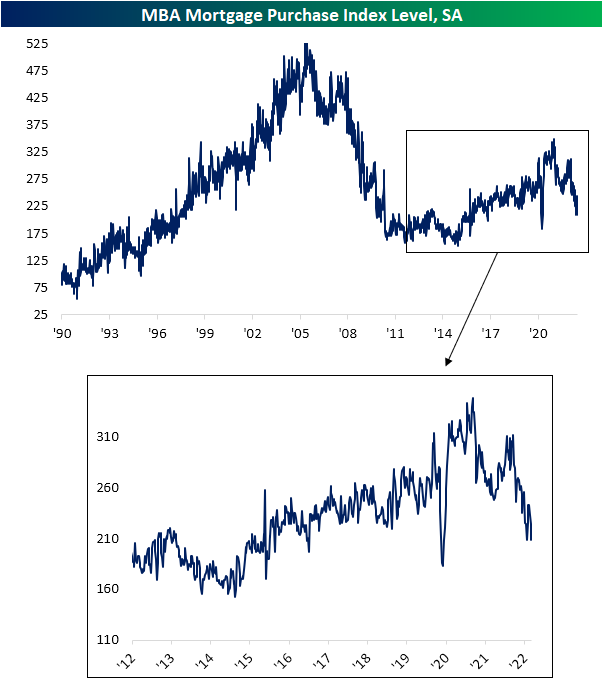
Given the slight rise in rates, demand for mortgages continues to predict further weakness in upcoming home sales data as we noted in today’s Morning Lineup. The MBA’s Mortgage Purchase index released this morning came in at a slightly lower reading than the June 3rd low for the weakest reading in the index since March and April of 2020. This week’s low is also below the range from the few years prior to the pandemic.
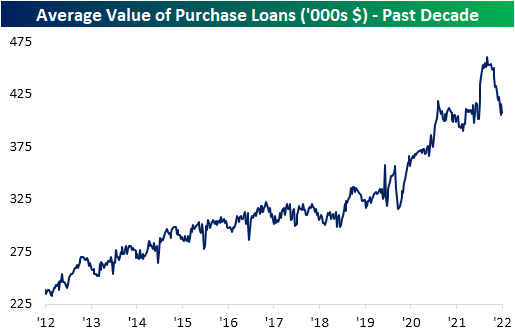
Not only has there been a lower volume of mortgages being applied for, but the actual dollar value of those loans has also plummeted amidst higher rates. As shown below, the average value of purchases reached a high of $460K back in March after a big increase in the first few months of this year. Since then, it has entirely reversed that move with the average value of loans having fallen all the way back down to $406K. That echoes the findings in other recent housing data which has similarly shown declines in home prices.
Higher rates have had an even more significant impact on refinance activity. Following another drop this week, the MBA’s index tracking refinancings has now reached the lowest level since November 2000. Click here to learn more about Bespoke’s premium stock market research service.

Chart of the Day – All You Wanted to Know About the S&P 500 Breaking Above the 50-DMA
Bespoke’s Morning Lineup – 7/20/22 – To The Moon
See what’s driving market performance around the world in today’s Morning Lineup. Bespoke’s Morning Lineup is the best way to start your trading day. Read it now by starting a two-week trial to Bespoke Premium. CLICK HERE to learn more and start your trial.
“The single observation I would offer for your consideration is that some things are beyond your control.” – Neil Armstrong

Below is a snippet of content from today’s Morning Lineup for Bespoke Premium members. Start a two-week trial to Bespoke Premium now to access the full report.
It was over 50-years ago today that Neil Armstrong became the first human to walk on the moon. Stocks didn’t go into orbit yesterday, but the S&P 500 and Nasdaq did manage to finally break back above their 50-day moving averages, ending, for the S&P 500, what was the longest streak since the Financial Crisis. This morning, the tone is much more subdued as futures have given up earlier gains as investors digest the latest batch of earnings. On the economic calendar, the only report of note is Existing Home Sales, which is expected to show a modest decline relative to last month.
Today’s Morning Lineup discusses earnings news out of Europe and the US, major earnings reports, and economic data from around the world including UK home prices and weekly US mortgage application data.
Both the S&P 500 and Nasdaq broke some extended streaks of trading below their 50-DMAs yesterday. For the S&P 500, the streak ending at 60 trading days was the longest since the 72-day streak ending all the way back in 2008, and it was just the 19th streak of 60 or more trading days in the post-WWII period. Now the S&P 500 just needs to work up enough strength to get back to its 200-DMA which is still 10.7% above yesterday’s close.

The Nasdaq’s streak of closes below its 50-DMA was even longer at 68 trading days, although that was only the longest streak of closes below that level since the 69-day streak ending in January 2019. Before that you have to go back to the 72 trading day streak ending in December 2008 to find a longer streak. In the Nasdaq’s history dating back to 1971 there have now only been 15 streaks where the index traded below its 50-DMA for 60 or more trading days. Finally, while the S&P 500 is 10.2% below its 200-DMA, the Nasdaq is much further in the hole at 17.2% below its 200-DMA.

Start a two-week trial to Bespoke Premium to read today’s full Morning Lineup.
The Closer – Netflix Margin, Construction Slows, Triple Plays No More – 7/19/22
Log-in here if you’re a member with access to the Closer.
Looking for deeper insight into markets? In tonight’s Closer sent to Bespoke Institutional clients, we start out tonight with a recap of the earnings of Netflix (NFLX), JB Hunt (JBHT), and Interactive Brokers (IBKR) (page 1) followed by a deep dive into today’s residential construction numbers (pages 2 – 5). Next we show the turn around in junk bonds as the NASDAQ 100 took out its 50-DMA (page 6) before finishing with an update on the number of stocks that have been reporting triple plays (page 7).

See today’s full post-market Closer and everything else Bespoke publishes by starting a 14-day trial to Bespoke Institutional today!
Daily Sector Snapshot — 7/19/22
Speculators Head for the Hills
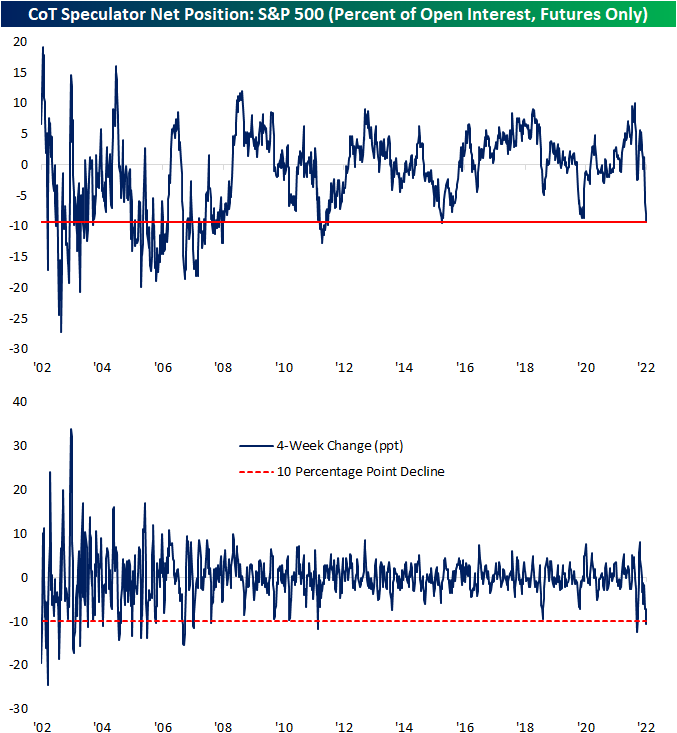
As we do each Monday in our Closer report, we reviewed the latest data from Friday’s release of the CFTC’s Commitments of Traders (CoT) Report. This data shows how speculators are positioned in various assets based on positions in the various futures contracts. One asset that has seen some of the most notable changes of the report in recent weeks has been the S&P 500. As recently as one month ago, that data showed a net 1.29% of open interest was positioned long. Even though the S&P 500 has managed to come off the lows in the past month, positioning has collapsed with a massive move lower meaning there are far more speculators positioned short than long.
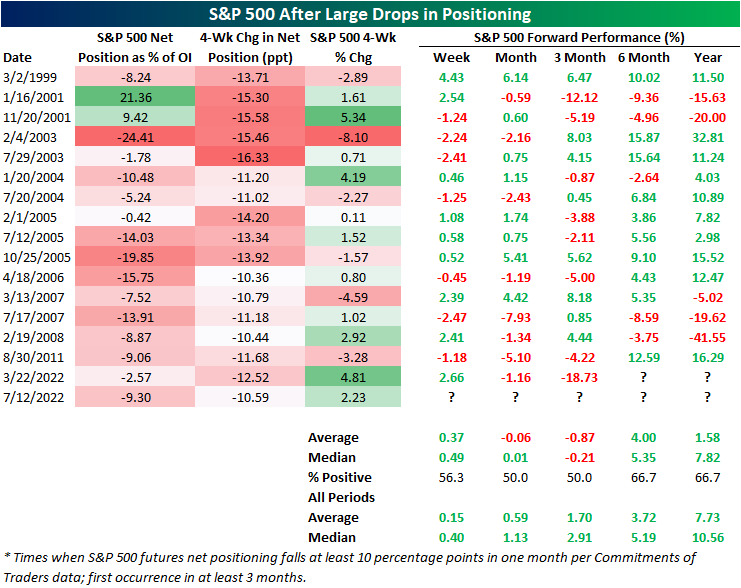
Whereas one month ago the reading was net long, in the latest data as of last Tuesday a net 9.3% of open interest was short. That made for the lowest reading since October 2015. In other words, speculators are positioned more pessimistically now than they were during the COVID crash, during the late 2018 near bear market, or any other time over the past several years. The change in positioning has also been rapid. As shown in the second chart below, that net positioning reading has fallen over 10 percentage points in just 4 weeks. Earlier this year in March there was an even larger 12.5 percentage point decline but prior to that, looking back through the history of this data, such large moves have been much rarer over the past decade than was the case in the 2000s and before. In fact, prior to this year the last time positioning in S&P 500 futures fell double digits in four weeks was all the way back in August 2011. On the other hand, the early 2000s frequently saw moves of this size if not larger.
Typically, sentiment data is considered contrarian in nature. In other words, pessimistic sentiment readings are followed by stronger forward performance of equities and vice versa. That has not exactly been the case for this CoT positioning data. Following past declines of at least 10 percentage points, returns have been mixed.
After declines of similar magnitude, the S&P 500 has experienced modest outperformance over the next week. One and three months out, however, have tended to be weaker with postive returns only half the time with negative returns on an average basis. Over the next month, each of the past four instances have been followed by declines.
Six and twelve months out have seen the S&P 500 higher two-thirds of the time, but average and median returns are not significantly better relative to all periods. Click here to learn more about Bespoke’s premium stock market research service.