
Bespoke Morning Lineup — 8/18/22 — The Rise of the Utes
See what’s driving market performance around the world in today’s Morning Lineup. Bespoke’s Morning Lineup is the best way to start your trading day. Read it now by starting a two-week trial to Bespoke Premium. CLICK HERE to learn more and start your trial.
“Remember this: When you are doing nothing, those speculators who feel they must trade day in and day out, are laying the foundation for your next venture. You will reap benefits from their mistakes.” – Edwin Lefèvre, Reminiscences Of A Stock Operator

Below is a snippet of content from today’s Morning Lineup for Bespoke Premium members. Start a two-week trial to Bespoke Premium now to access the full report.
US equity futures are slightly higher ahead of the open this morning as jobless claims just came in weaker (better) than expected and Philly Fed came in stronger than expected. Outside of the 8:30 AM ET data, there’s not much else going on today.
The S&P 500’s action around resistance at its 200-DMA continues to be watched closely by traders. Yesterday’s declines continued the pullback that began late in the day on Tuesday when the index touched up against the 200-DMA in afternoon trading. To get above the 200-day at this point, the index needs to rally about 1.25% from yesterday’s close.

Our Morning Lineup keeps readers on top of earnings data, economic news, global headlines, and market internals. We’re biased (of course!), but we think it’s the best and most helpful pre-market report in existence!
Start a two-week trial to Bespoke Premium to read today’s full Morning Lineup.
The Closer – Minutes Unremarkable, Retail Sales, Tepid Twenties- 8/17/22
Log-in here if you’re a member with access to the Closer.
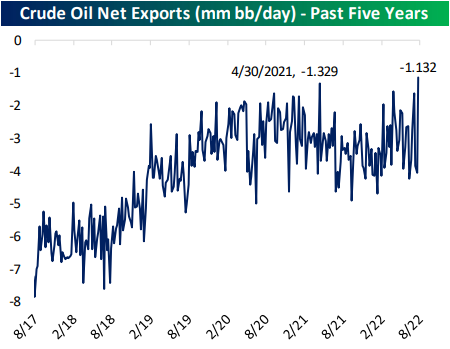
Looking for deeper insight into markets? In tonight’s Closer sent to Bespoke Institutional clients, after a review of the FOMC Meeting Minutes and earnings (page 1), we dive into how the moves in equities were consistent with credit markets (page 2). We then switch over the macro data to show the narrowest crude oil trade deficit on record (page 3) and retail sales (page 4 and 5). We close out with a recap of the 20 year bond auction (page 6).
See today’s full post-market Closer and everything else Bespoke publishes by starting a 14-day trial to Bespoke Institutional today!
Bespoke Baskets Update — August 2022
Daily Sector Snapshot — 8/17/22
Chart(s) of the Day: Breakouts
Fixed Income Weekly: 8/17/22
Searching for ways to better understand the fixed income space or looking for actionable ideas in this asset class? Bespoke’s Fixed Income Weekly provides an update on rates and credit every Wednesday. We start off with a fresh piece of analysis driven by what’s in the headlines or driving the market in a given week. We then provide charts of how US Treasury futures and rates are trading, before moving on to a summary of recent fixed income ETF performance, short-term interest rates including money market funds, and a trade idea. We summarize changes and recent developments for a variety of yield curves (UST, bund, Eurodollar, US breakeven inflation and Bespoke’s Global Yield Curve) before finishing with a review of recent UST yield curve changes, spread changes for major credit products and international bonds, and 1 year return profiles for a cross section of the fixed income world.
In this week’s report we review the fixed income ETF space.

Our Fixed Income Weekly helps investors stay on top of fixed income markets and gain new perspective on the developments in interest rates. You can sign up for a Bespoke research trial below to see this week’s report and everything else Bespoke publishes free for the next two weeks!
Click here and start a 14-day free trial to Bespoke Institutional to see our newest Fixed Income Weekly now!
10-Day A/D Line Overbought for 15 Days
In an earlier tweet, we pointed out the elevated readings across 10-day advance decline lines in our Sector Snapshot. Not only is the 10-Day A/D line for the S&P 500 approaching one-year highs (as of yesterday’s close), but it has been “overbought” for the last 15 trading days.

Going back to the start of our data in 1990, there have only been eight other times in which the S&P 500’s 10-day A/D line has been overbought for 15 days in a row or more. The last time such a steak was observed was at the start of 2019 which ended at 22 days. That tied for the March 2016 streak for the longest on record back to 1990. We would also note that other than one streak in the first couple of months of 1991, nearly all of these long streaks with an overbought 10-day A/D line occurred since 2010. In other words, consistently impressive breadth by this measure has largely been a recent phenomenon.
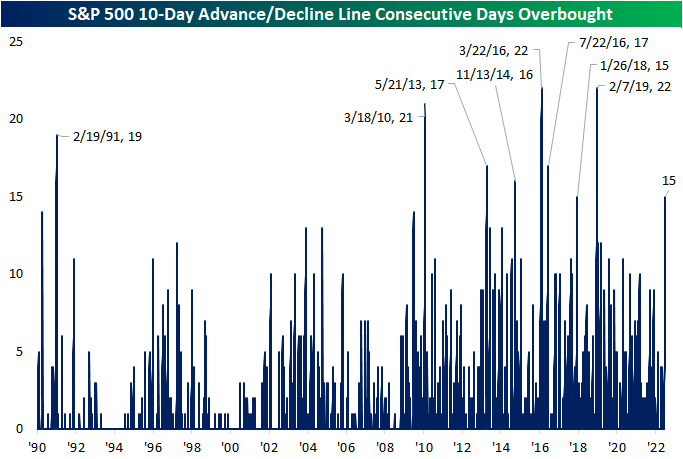
This is not the only impressive breadth signal we have covered of late. For example, in yesterday’s Chart of the Day we highlighted that more than 90% of S&P 500 stocks were above their 50-DMAs. Prior times when we’ve seen that reading spike above 90% have been followed by strong returns in the months and year ahead. Looking at the past times in which the 10-day advance decline line has been overbought for 15 days in a row, forward performance of the S&P 500 has not been considerably stronger than the norm. From that 15th day, the S&P has risen half the time one week out. One and three month returns are more consistently positive but weaker than the norm on a median basis. In the year after the long overbought A/D streaks listed below, though, the S&P was higher 7 of 8 times for an average gain of 11.1%.

Below is a chart of the S&P 500 since its 2009 Financial Crisis low. As shown, most of these overbought A/D line streaks have occurred as the index was recovering from some sort of sell off. Only one of them (in early 2018) came about at the time of a notable peak in the index. Click here to learn more about Bespoke’s premium stock market research service.

Moving Averages Putting Up a Fight
Just as the S&P 500 ran into some resistance yesterday at its 200-day moving average (DMA), we’ve seen the same pattern play out in a number of commodities. Two of the more high-profile ones have been copper and crude oil.
Copper fell out of bed in the late spring and early summer, losing a third of its value. Along with the equity market, copper has seen a late-summer rally, but things came to a screeching halt right at the 50-DMA last Thursday. Copper has been down on two of the last three trading days and hasn’t been able to trade back above that elusive 50-DMA since. Click here to start a two-week trial to Bespoke Premium and receive our paid content in real-time.

Crude oil has been just as weak as copper lately, trading in a well-defined downtrend and breaking below its 200-DMA in early August. There was a little bit of a bounce last week, but resistance came into play at the 200-DMA, and after making another lower high, it has since made another lower low.
When stock, commodity, bond, or any other asset class is in a well-defined downtrend, the first thing they have to do to break out of their funks is clear resistance at key moving averages like the 50 and/or 200-DMA. In the case of copper and crude, they have both recently come up short. The S&P 500, again, is facing some resistance at its 200-DMA, but at least it has managed to clear its 50-DMA which it did in the second half of July.

Bespoke’s Morning Lineup – 8/17/22 – Not Much of a Second Effort
See what’s driving market performance around the world in today’s Morning Lineup. Bespoke’s Morning Lineup is the best way to start your trading day. Read it now by starting a two-week trial to Bespoke Premium. CLICK HERE to learn more and start your trial.
“What started as a temporary measure driven by the pandemic is now our new standard.” – Brian Cornell
Below is a snippet of content from today’s Morning Lineup for Bespoke Premium members. Start a two-week trial to Bespoke Premium now to access the full report.
After Walmart (WMT) capped off the strongest earnings season for US stocks in years, a bit of a hangover appears to have set in for investors this morning. Futures were only modestly negative in the middle of the night, but there has been a steady drift lower throughout the early morning hours to the point where S&P 500 futures have traded down over 75 basis points as we type this. Looking for a culprit, earnings don’t fit as a narrative. The most high-profile report this morning has been Target (TGT) which reported weaker-than-expected results, but the stock is only trading down 2%. Hardly enough to warrant a decline of this magnitude. Trading in Europe may be to blame as major benchmarks in the region are down following a higher-than-expected inflation report in the UK that pushed the y/y rate above 10%. With the FOMC Minutes on tap, maybe investors are fearing some hawkish text in the minutes.
Whatever the cause, after yesterday’s rally screeched to a halt just shy of the 200-day moving average (DMA), the bulls’ second effort looks pretty weak at this point. We’ll see if Retail Sales either add to the misery or put a pep in the market’s step.
Today’s Morning Lineup discusses earnings and market news from Europe and the Americas, overnight economic data, and much more.
Walmart’s (WMT) earnings report after the close yesterday marked what we generally consider to be the unofficial end to earnings season. If you’re a bull, you’re probably sad to see this one come to an end. Through yesterday’s close, the S&P 500 was up over 10% since earnings season began July 8th, and that represents the best earnings season performance for the index since the Q2 reporting period in 2009! Since the start of 2009, the just-completed earnings season also marks the 13th time that the S&P 500 has rallied 5% or more during an earnings season (six weeks from the Friday before the first big banks report numbers).
With strong performance during the reporting period, the natural question for investors is whether the gains we have seen have been borrowed from the future. Looking back at prior strong earnings seasons, that doesn’t appear to be the case. In the 12 prior reporting periods, the S&P 500’s median change from the end of earnings season through quarter-end was a gain of 2.38% with positive returns 75% of the time. That’s actually modestly better than the median gain of 1.75% and positive returns 73% of the time for the remainder of all other quarters.
Instead of borrowing from future gains this earnings season, maybe the S&P 500 was just collecting on its ‘loan’ during the June swoon?

Start a two-week trial to Bespoke Premium to read today’s full Morning Lineup.
The Closer – 200-DMA Test, Ignoring The Fed, Last Hour of Trade, Housing – 8/16/22
Log-in here if you’re a member with access to the Closer.
Looking for deeper insight into markets? In tonight’s Closer sent to Bespoke Institutional clients, we start out with a look at the S&P 500’s failed test of its 200-DMA and how much time the index has historically spent below its 200-day during past bear markets (page 1). We then compare the moves across risk assets to forward rates (page 2). Afterward, we dive into an interesting shakeup in intraday versus after hours price action (page 3). After reviewing today’s home construction numbers (page 4 and 5), we check in on CPI north of the border (page 6).
See today’s full post-market Closer and everything else Bespoke publishes by starting a 14-day trial to Bespoke Institutional today!