
Daily Sector Snapshot — 8/31/22
First Day of the Month Trends
Earlier today, we sent out our Chart of the Day highlighting seasonal trends for the month of September. Breaking this down further, below we break down some seasonal trends for the first trading day of September relative to all other months over the last 50 years (since 1972). During this span, the first trading day of September has been weaker than the first trading day of any other month with the S&P 500 averaging a decline of 0.11%. However, the positivity rate is above 50% and the median performance is a gain of 0.05%, and much of the negativity comes after the index posts a gain in August.
Over the last 50 years, September has averaged a loss of 0.32% (median: -0.07%) on the first trading day of September following gains in August, trading lower 54% of the time. On an average basis, September has been the worst first trading day of the month following gains in the prior month, but when it comes to both median and positivity rates, August is worse. On the other hand, when August resulted in losses for the S&P 500, September has averaged a gain of 0.16% on the first trading day of September, posting gains 59% of the time. Click here to learn more about Bespoke’s premium stock market research service.

The chart below is included to help you visualize the comparative performance of the first trading day in September relative to other months. Perhaps one of the more surprising aspects of this chart is that fact that despite being known as a positive month, positivity rates on the first trading day of December have been weak. Along with August, it is the only month where the first trading day of the month has been down more often than it has been up regardless of whether the prior month was up or down.

Fixed Income Weekly: 8/31/22
Searching for ways to better understand the fixed income space or looking for actionable ideas in this asset class? Bespoke’s Fixed Income Weekly provides an update on rates and credit every Wednesday. We start off with a fresh piece of analysis driven by what’s in the headlines or driving the market in a given week. We then provide charts of how US Treasury futures and rates are trading, before moving on to a summary of recent fixed income ETF performance, short-term interest rates including money market funds, and a trade idea. We summarize changes and recent developments for a variety of yield curves (UST, bund, Eurodollar, US breakeven inflation and Bespoke’s Global Yield Curve) before finishing with a review of recent UST yield curve changes, spread changes for major credit products and international bonds, and 1 year return profiles for a cross section of the fixed income world.
In this week’s report we take a look at how high real yields are getting compared to recent and longer-term precedents.

Our Fixed Income Weekly helps investors stay on top of fixed income markets and gain new perspective on the developments in interest rates. You can sign up for a Bespoke research trial below to see this week’s report and everything else Bespoke publishes free for the next two weeks!
Click here and start a 14-day free trial to Bespoke Institutional to see our newest Fixed Income Weekly now!
August Declines All Around the World
The end of August is here and US equities, as measured by the S&P 500 ETF (SPY), have been on a wild ride. At the mid-month high, SPY was sitting on a 4.3% month-to-date gain, but that has more than entirely been erased as it is on pace to finish the month down closer to 3.5%. The country ETF of each other major global economy that we track in our Global Macro Dashboard is a similar story. Across these countries, on average, they had reached a 3.13% gain at their month-to-date highs, but today they are down an average of 3.5% MTD. Overall, developed markets have faired much worse than emerging market countries with average declines of 4.82% versus 1.24%, respectively. In fact, there are only two ETFs—Brazil (EWZ) and India (INDA)—that are currently positive for the month. Meanwhile, China (MCHI) is unchanged. On the other end of the spectrum, Sweden (EWD) has been the worst performer nearing an 11% decline with a number of other European nations following up with the next worst performance.
With stock markets around the world giving up the ghost in August, most have moved back below their 50-DMAs or even into oversold territory. There are no country ETFs more than one standard deviation above their moving averages although EWZ and INDA have only moved out of overbought territory in the past week.

As we show in the table above, this year’s declines have resulted in the average country ETF falling 24% below its 52-week high. Those declines bring the vast majority of these countries back below pre-COVID highs as well. At the moment, there are only four countries that remain above pre-COVID 52-week highs: Taiwan (EWT), India (INDA), the United States (SPY), and Canada (EWC). This exclusive group would need to fall substantially further to revert back to those prior highs, and as shown in the chart below, each one would also still have support at lows from earlier this year before pre-COVID highs become a technical level worth eying. Click here to learn more about Bespoke’s premium stock market research service.
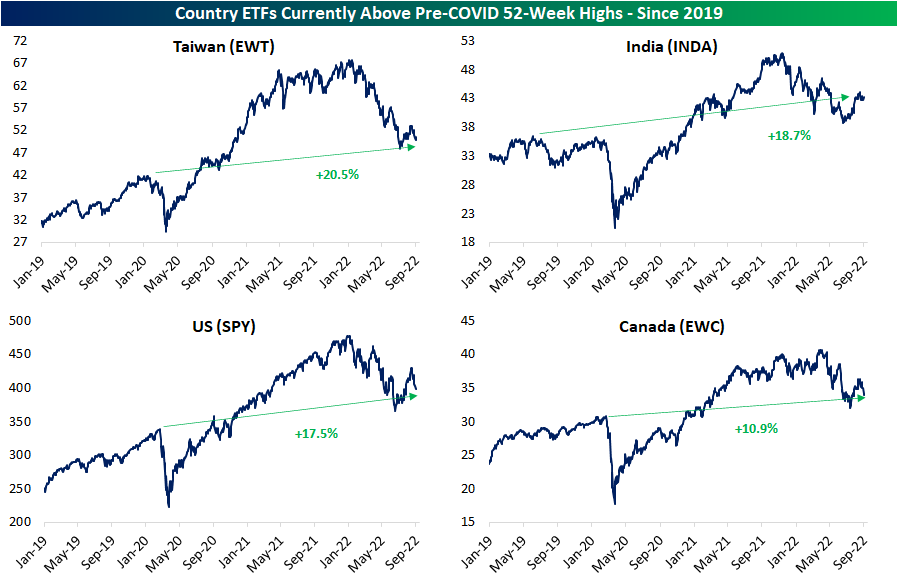
Chart of the Day: September Seasonality
Bespoke’s Matrix of Economic Indicators – 8/31/22
Our Matrix of Economic Indicators provides a concise summary analysis of the US economy’s momentum. We combine trends across the dozens and dozens of economic indicators in various categories like manufacturing, employment, housing, the consumer, and inflation to provide a directional overview of the economy.
To access our newest Matrix of Economic Indicators, start a two-week free trial to either Bespoke Premium or Bespoke Institutional now!
B.I.G. Tips – From Overbought to Oversold…Quickly
September Seasonality: Mega-Caps
As we get ready to enter September, the five US mega-caps have a lot to recover in order to erase their year-to-date losses, with the average stock being down 19.4% so far in 2022. Although investors hope for a recovery, historical seasonal trends for the month of September do not bode well for these five stocks. Over the last ten years, Apple (AAPL), Alphabet (GOOGL), Amazon (AMZN), Microsoft (MSFT), and Tesla (TSLA) have all struggled in September, with all of them averaging losses during the month. On a median basis, only GOOGL has posted positive returns in September, while AAPL has been the weakest performer.
September is the only month in which none of the five mega-cap stocks have averaged a gain. However, just as April showers tend to bring May flowers, September’s pain has been October’s gain. On an average basis, all five of the US mega-caps have averaged gains of at least 1.6% with Alphabet, Microsoft, and Tesla all averaging gains of more than 4%. Click here to start a two-week trial to Bespoke Premium and receive our paid content in real-time.

Bespoke’s Morning Lineup – 8/31/22 – Welcome Back ADP
See what’s driving market performance around the world in today’s Morning Lineup. Bespoke’s Morning Lineup is the best way to start your trading day. Read it now by starting a two-week trial to Bespoke Premium. CLICK HERE to learn more and start your trial.
“The market is not an invention of capitalism. It has existed for centuries. It is an invention of civilization.” – Mikhail Gorbachev

Below is a snippet of content from today’s Morning Lineup for Bespoke Premium members. Start a two-week trial to Bespoke Premium now to access the full report.
Futures have been trading on either side of unchanged throughout the overnight session as equity markets look to break the post-Jackson Hole losing streak. Treasury yields are higher, but crude oil is lower again as WTI has broken below $90 per barrel.
In economic news, after a summer sabbatical, ADP released its re-tooled Private Payrolls report which came in well below forecasts at a level of 132K versus consensus forecasts for a reading above 300K. The only other report on the calendar for the last trading day of August is the Chicago PMI at 9:45. That report is expected to improve slightly to 52.4 from last month’s weaker-than-expected reading of 52.1.
In yesterday’s Chart of the Day, we discussed the weakening breadth picture in the S&P 500 since the rejection of the 200-DMA back on 8/16. This is illustrated in the 10-day advance/decline (A/D) line for the S&P 500 which dropped yesterday to its most oversold levels since mid-June.

One sector where breadth has been notably weak has been Technology. As shown in the chart below, not only has the 10-day A/D line for the S&P 500’s largest sector dropped to its lowest levels since June, but the Technology sector’s 10-day A/D line hasn’t been more oversold in the last year.

Our Morning Lineup keeps readers on top of earnings data, economic news, global headlines, and market internals. We’re biased (of course!), but we think it’s the best and most helpful pre-market report in existence!
Start a two-week trial to Bespoke Premium to read today’s full Morning Lineup.
The Closer – Valuation Weakness, JOLTS, Rent & Housing, Deciles – 8/30/22
Log-in here if you’re a member with access to the Closer.
Looking for deeper insight into markets? In tonight’s Closer sent to Bespoke Institutional clients, we start out tonight with a breakdown of the forward multiples of Russell 1,000 stocks and how much the index would need to decline to reach certain multiples (page 1). We then provide a decile breakdown of performance since the August 16th high (page 2). Turning to macro data, we dive into today’s JOLTS data (page 3) and rent and home prices (page 4).

See today’s full post-market Closer and everything else Bespoke publishes by starting a 14-day trial to Bespoke Institutional today!