Empire Fed Rising
The first regional Fed manufacturing report covering the month of November hit the tape this morning in the form of the New York Fed’s Empire Manufacturing Survey. The headline index rose 8 points month over month to 18.7, moving the index to the top quartile of historical readings. Outside of last November’s reading of 20.2, this was also the highest reading in the index since April 2022.
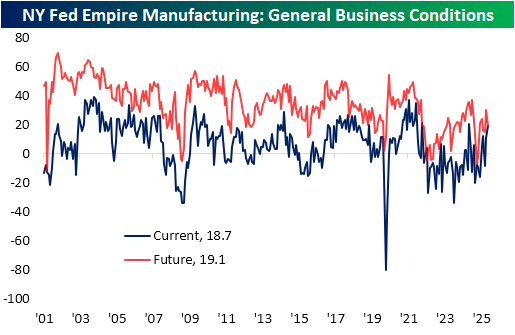
Breadth in this month’s report was solid, with six of ten categories rising month over month while four declined. Of the decliners, both price indices moderated. New orders picked up materially, as did both employment indices. Current condition indices are mostly solid now, with only two in contraction (unfilled orders and supply availability), and those same two indices are also the only ones below their median historical readings.
Six-month expectations, on the other hand, leave room for improvement. Across the board, only five expectation indices are above their historical median, with the two price indices the most elevated, just shy of top decile readings. The headline index experienced a double-digit drop in November. In other words, the report showed optimism about current conditions but uneasiness for the months ahead.
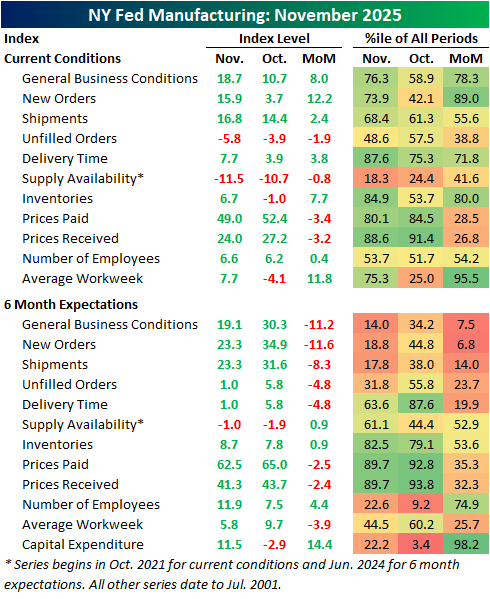
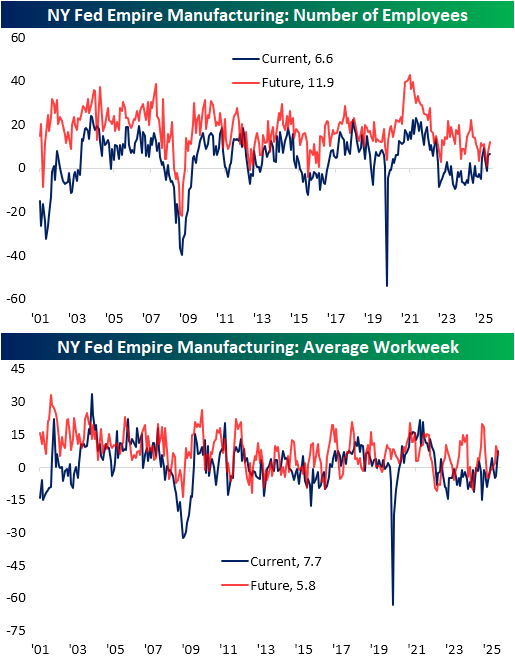
One of the stronger categories for current conditions was employment. Number of employees wasn’t much to write home about, as the current conditions index rose a modest 0.4 points to 6.6. Expectations were also higher, reaching the most elevated reading since January. Average workweek was much stronger as the index surged from contractionary territory, up 11.8 points to 7.7. Put differently, in just one month, that index went from the bottom to the top quartile of historical readings. In fact, the index for current conditions is now the highest since May 2022.
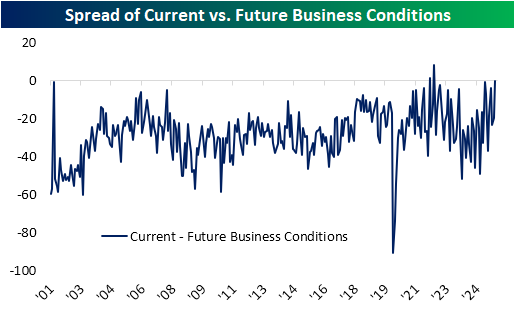
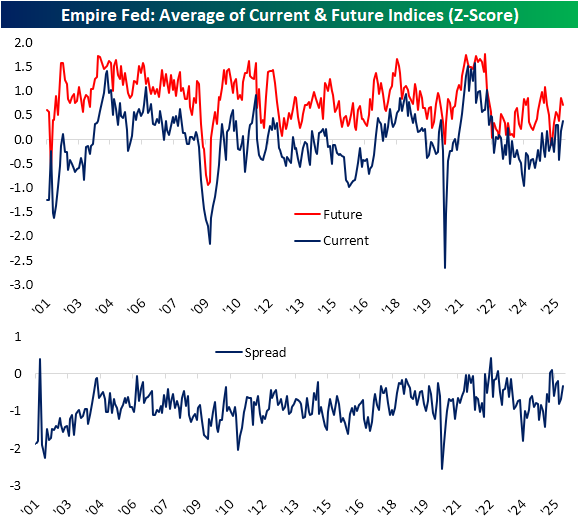
Circling back on the spread between current conditions and expectations, it was a weird month as current conditions improved and expectations deteriorated. Below, we show the spread in those readings for the headline index. As shown, optimism has been the historical norm, as positive spreads (current conditions stronger than expectations) have been extremely rare. In fact, it’s only happened twice, the first in April 2022 and the second a few months later in July 2022. While the November reading wasn’t positive, it came close with the third-highest reading on record at -0.4.
Standardizing and averaging across all categories, the spread between the two is less extreme. Again, current condition indices are solid at the strongest levels since the summer of 2022 while expectation indices were down slightly this month. Taken as a spread, there were higher readings as recently as three months ago, including a rare positive reading in April and May. Regardless, the move upward in November still ranks in the 90th percentile since the start of the survey in 2001.

Bespoke’s Morning Lineup – 11/17/25 – 11?
See what’s driving market performance around the world in today’s Morning Lineup. Bespoke’s Morning Lineup is the best way to start your trading day. Read it now by starting a two-week trial to Bespoke Premium. CLICK HERE to learn more and start your trial.
“There’s no such thing as simple. Simple is hard.” – Martin Scorsese

Below is a snippet of commentary from today’s Morning Lineup. Start a two-week trial to Bespoke Premium to view the full report.
It’s looking (for now) like another positive start to the week as S&P 500 and Nasdaq futures are indicated higher. We say for now, because the tone was much more positive before the sun came up on the East Coast. In fact, futures on the Dow have actually moved into negative territory while the Nasdaq’s gain has been whittled down to 0.25%. The primary driver of the Nasdaq’s gain is a 4% rally in Alphabet (GOOGL) following news that Berkshire Hathaway acquired 18 million shares during Q3.
After moving up as high as 4.15% on Friday, the 10-year yield is down over 3 bps to 4.11%, crude oil is flat and barely hanging on to $60 per barrel, gold is modestly lower, and Bitcoin is higher, reversing overnight weakness that took its YTD performance negative for the year.
The week started on a mixed note in Asia. South Korean stocks rallied close to 2% as Samsung and SK Hynix rallied, but Japan and China both traded lower on geopolitical concerns after China advised citizens not to travel to Japan following comments made by the new Japanese PM Takaichi, regarding Taiwan. JGB yields in Japan also moved higher as the 20-year yield hit its highest levels since 1999.
European stocks started off the week higher but have reversed lower since the open and are now down across the board as the STOXX 600 falls 0.5%, led lower by a 1% drop in Spanish stocks.
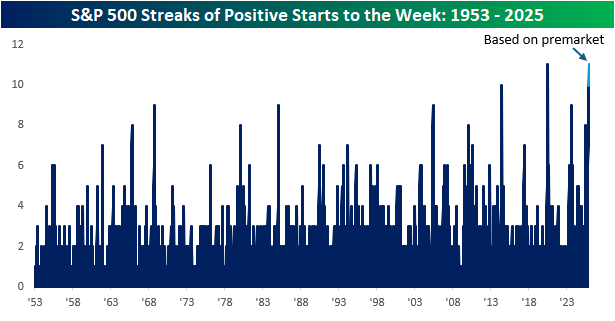
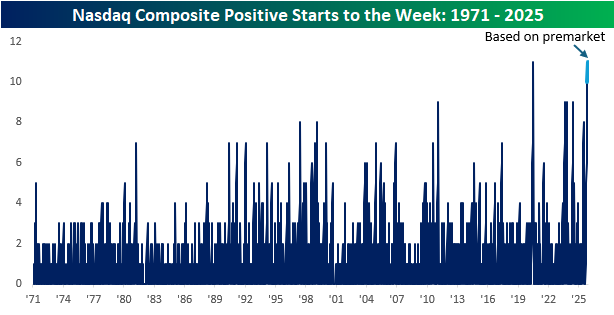
Futures don’t look as positive as they did earlier, but as of this writing, they’re still higher, and if that pace remains the case, it will be historic for both the S&P 500 and Nasdaq. Heading into this week, both indices have had positive returns on the first trading day of the week for ten straight weeks, which was one short of each index’s respective record streak from July 2020 coming out of the Covid crash lows.
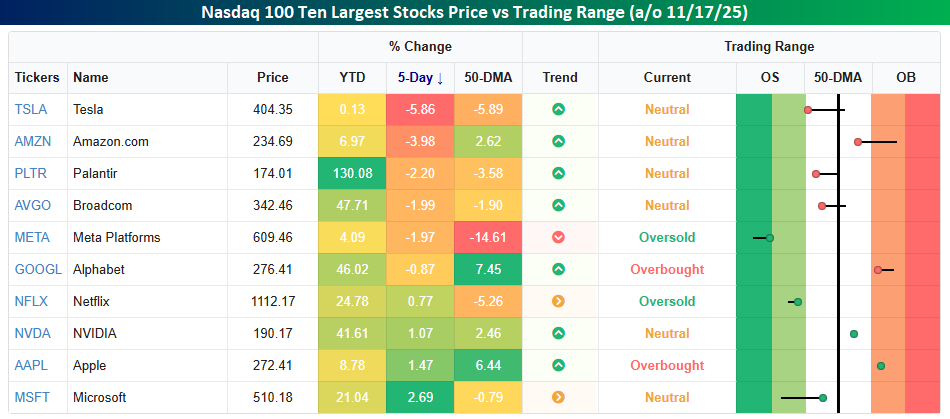
Within the Nasdaq, there’s been some bifurcation in returns lately. On a YTD basis, the ten largest stocks in the index are all still up, but the range of returns varies widely. Palantir (PLTR) easily leads the group with a gain of over 130%, but three others in the top ten are still up at least 40% YTD. Last week, though, returns were much more scattered. Led lower by Tesla’s (TSLA) decline of nearly 6%, five of the ten largest stocks in the index were basically down at least 2%. At the other end of the spectrum, Microsoft (MSFT), Apple (AAPL), and Nvidia (NVDA) were all up over 1%.
Relative to their respective 50-DMAs, the ten largest stocks are also all over the place. Meta (META) is an extreme as it closed out the week nearly 15% below its 50-DMA, but TSLA and Netflix (NFLX) are also more than 5% below their 50-DMAs as well. Meanwhile, two stocks in the S&P 500 – Alphabet (GGOGL) and AAAPL) – are more than 5% above their 50-DMAs.
Brunch Reads – 11/16/25
Welcome to Bespoke Brunch Reads — a linkfest of some of our favorite articles over the past week. The links are mostly market-related, but there are some other interesting subjects covered as well. We hope you enjoy the food for thought as a supplement to the research we provide you during the week.
Fed’s First Steps: The Federal Reserve officially opened on November 16, 1914, marking the start of a new central banking system designed to stabilize the US economy. Its creation came after decades of financial panics, especially the Panic of 1907, which showed how vulnerable the country was without a central authority to manage money and support banks during stress.
At the time of its opening, the Fed’s main job was to provide an “elastic currency,” act as a lender of last resort to banks, and make the financial system less prone to sudden collapses. The twelve regional Reserve Banks began issuing Federal Reserve Notes and offering short-term lending to member banks, giving the country its first coordinated monetary framework.
Over the years, the Fed’s responsibilities expanded well beyond its original mandate. The Great Depression pushed it into more active monetary policy, post-war reforms gave it a dual mandate of stable prices and maximum employment, and modern crises, from the 1970s inflation period to 2008 and the pandemic, led to new tools like open-market operations, emergency lending programs, and large-scale asset purchases.
Today, the Federal Reserve plays a central role in the global financial system. It sets interest rates, regulates major banks, oversees payment systems, and steps in during periods of economic or market stress. Even with its expanded powers, the core purpose remains the same as it was on day one: to keep the US financial system stable and functioning during good times and bad.
Education
Harvard Says It’s Handing Out Too Many A’s. Students Are Fighting Back. (WSJ)
Harvard is facing a blowup over grade inflation, with a new report saying too many students are getting A’s and not enough real evaluation is happening. Students say they’re already stretched thin and feel blindsided by the idea that their hard-won grades are suddenly a problem, while faculty worry that tougher standards will scare students away from their classes. The fight has turned into a bigger question about what academic rigor should look like at an elite school. [Link]
Continue reading our weekly Brunch Reads linkfest by logging in if you’re already a member or signing up for a trial to one of our two membership levels shown below! You can cancel at any time.

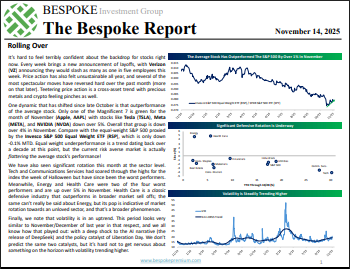
The Bespoke Report – Rolling Over – 11/14/25
To read our weekly Bespoke Report newsletter and access everything else Bespoke’s research platform offers, start a two-week trial to Bespoke Premium. While stocks eked out gains this week, it was a turbulent ride and under the hood some of the biggest winners this year are under major pressure. That’s not just true of the riskiest and most aggressively priced stocks, as crypto has taken hits along with precious metals. Even the juggernaut AI narrative is being tested, with surging credit spreads that represent market skepticism about the epic capex binge under way. US economic data remains scarce but we got lots of updates from China this week showing a surprising slowdown in that economy. Meanwhile the Federal Reserve has sounded the hawkish siren all week and markets are moving to reflect less support than previously expected.

Daily Sector Snapshot — 11/14/25
B.I.G. Tips: S&P 500 Streaks Above 50-DMA
Bespoke’s Morning Lineup – 11/14/25 – Slip Sliding Away
See what’s driving market performance around the world in today’s Morning Lineup. Bespoke’s Morning Lineup is the best way to start your trading day. Read it now by starting a two-week trial to Bespoke Premium. CLICK HERE to learn more and start your trial.
“Beware of geeks bearing formulas.” – Warren Buffett
Below is a snippet of commentary from today’s Morning Lineup. Start a two-week trial to Bespoke Premium to view the full report.
Can we shut down the government again, already? After President Trump signed legislation into law on Wednesday night to reopen the government, stocks have done nothing but trade lower. On Thursday, the S&P 500 traded more than 1.5% lower, and this morning, futures are indicated to open down another 1% with the Nasdaq down even more (-1.6%). Oil prices are higher this morning following reports of a Ukrainian attack on a Russian port, but gold is lower, falling 2% to just over $4,100 per ounce. The most pain, however, is being felt in the crypto space, where Bitcoin is down another 3% to $95,000 and Ethereum is down 1.6% to $3,120. There’s no economic data on the calendar this morning, but we’ll hear from several Fed speakers who will likely shed further light on the direction of policy at the December meeting.
It was a bloodbath in Asian equity markets to close out the week as most major averages were down well over 1%, including South Korea, where, despite finalizing its trade deal with the US, the KOSPI fell 3.8% but still finished 1.5% higher on the week. Besides following through from yesterday’s weakness in the US, weak investment and industrial production data in China helped to drive the region’s decline.
European stocks are also closing out the week on a down note, but are still on pace to finish the week higher. The STOXX 600 is down over 1.5%, and every major country’s benchmark is down at least 1.5%. Eurozone GDP came in slightly higher than expected, while employment was in line with expectations.
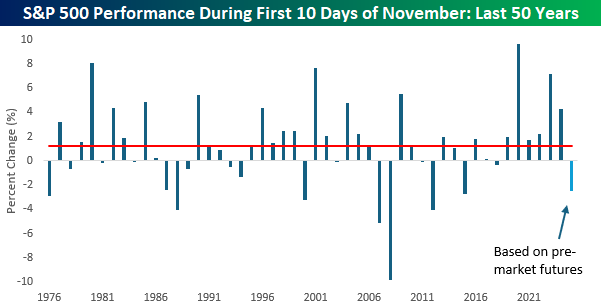
With S&P 500 futures trading down 1% in the pre-market, the S&P 500’s month-to-date decline will be right around 2.5% at the open today, and if that decline holds, it will be the weakest first 10 trading day start to November since 2017 (-2.7%), and after that, the worst was 4% in 2012. If there’s any consolation to the weakness, a weak start to November doesn’t necessarily mean bad things for the rest of the year. In the eight prior years over the last 50 that the S&P 500 traded down 2%+ in the first ten trading days of November, the median rest of year change was a gain of 2.2% with positive returns 75% of the time. For all other years, the median gain was 1.9% with positive returns 78% of the time.
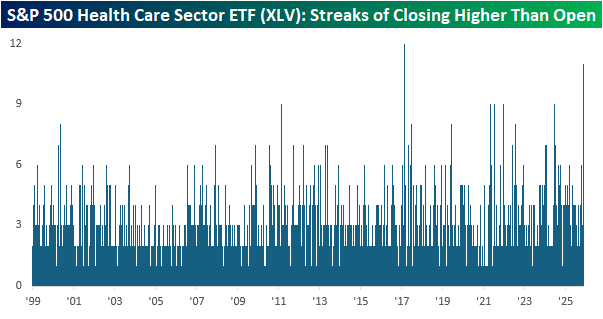
While the S&P 500 is down this week, one sector bucking the trend is Health Care. Through Thursday’s close, the sector was up 4.5%, which was more than twice the gain of the next closest sector (Materials). It’s been an impressive run lately for Health Care. After underperforming for most of the year, XLV has broken out to 52-week highs this week in what has been a buying frenzy. As shown on the right side of the chart, the sector has closed higher than it opened for 11 straight trading days!
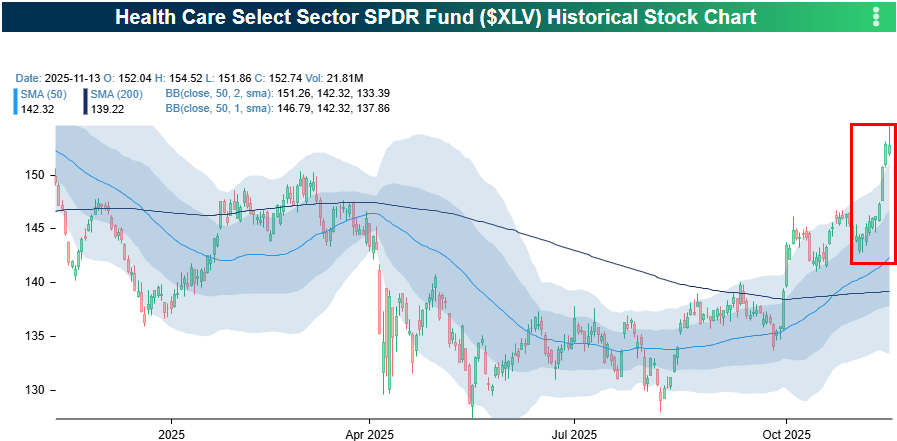
Over the past 11 days, the current streak of closes higher than the opening price in XLV ranks as the second longest in the ETF’s history. While there have been five other streaks of 9 days, the only streak longer than the current 11-day streak was a 12-day streak that ended in February 2017.
The Closer – Beta Pain, Hot Health Care – 11/13/25
Log-in here if you’re a member with access to the Closer.
Looking for deeper insight into markets? In tonight’s Closer sent to Bespoke Institutional clients, we lead off with a look at the pain in high beta names (page 1) in addition to a decile analysis and some other charts breaking down where the worst of the selling has been (pages 2 and 3). After a look into some transportation industry data (page 4), we close out with a look into the hot run in Health Care stocks (pages 5 and 6).
See today’s full post-market Closer and everything else Bespoke publishes by starting a 14-day trial to Bespoke Institutional today!