Fixed Income Weekly: 10/19/22
Searching for ways to better understand the fixed income space or looking for actionable ideas in this asset class? Bespoke’s Fixed Income Weekly provides an update on rates and credit every Wednesday. We start off with a fresh piece of analysis driven by what’s in the headlines or driving the market in a given week. We then provide charts of how US Treasury futures and rates are trading, before moving on to a summary of recent fixed income ETF performance, short-term interest rates including money market funds, and a trade idea. We summarize changes and recent developments for a variety of yield curves (UST, bund, Eurodollar, US breakeven inflation and Bespoke’s Global Yield Curve) before finishing with a review of recent UST yield curve changes, spread changes for major credit products and international bonds, and 1 year return profiles for a cross section of the fixed income world.
In this week’s report we discuss the collapse in mortgage market activity amidst soaring spreads.

Our Fixed Income Weekly helps investors stay on top of fixed income markets and gain new perspective on the developments in interest rates. You can sign up for a Bespoke research trial below to see this week’s report and everything else Bespoke publishes free for the next two weeks!
Click here and start a 14-day free trial to Bespoke Institutional to see our newest Fixed Income Weekly now!
Chart of the Day: S&P 500 Drawdowns vs. Forward Performance
Housing Continues to Roll…Over
The latest update on Housing Starts and Building Permits from the Census Bureau was released this morning, and the results continue to reflect a significant slowdown in the sector. On a y/y basis, both starts and permits saw declines of 7.7% and 3.2%. respectively. The real weakness, however, has been in single-family units where starts are down 18.5% and permits fell 17.3% even as multi-family units were both up by double-digit percentages y/y. On a regional basis, the west was the only region to register a m/m uptick (4.5%) while the northeast was the only region registering an increase relative to last year. For permits, every region except the northeast was up m/m while it was the only region to register an increase on a y/y basis.

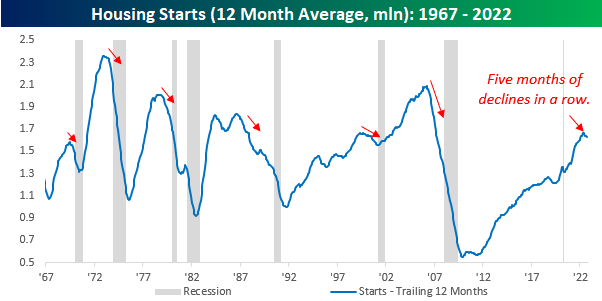
Housing Starts have historically done a good job predicting turns in the business cycle, so the fact that we have now seen five straight months of declines in this reading is just another indication of the risk of a recession on the horizon. We would note, however, that while recessions usually follow peaks in the 12-month average, they weren’t always imminent.
Looking more closely at the last few years, in addition to the decline in Housing Starts, the 12-month average of Building Permits has also started to roll over.
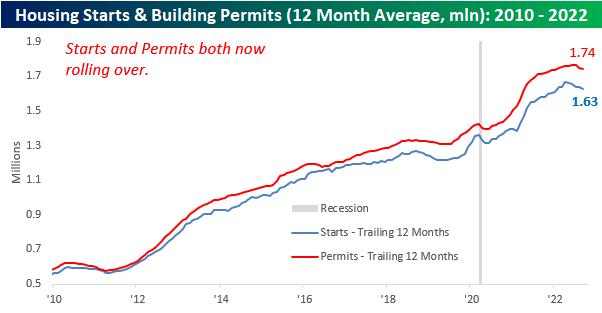
Single-family starts and permits have been even weaker. and both have now declined for five straight months. Also, the magnitude of the recent decline has been steeper than anything seen since the period from 2010 through 2012. Click here to learn more about Bespoke’s premium stock market research service.

Bespoke’s Morning Lineup – 10/19/22 – Worse Than 1987
See what’s driving market performance around the world in today’s Morning Lineup. Bespoke’s Morning Lineup is the best way to start your trading day. Read it now by starting a two-week trial to Bespoke Premium. CLICK HERE to learn more and start your trial.
“It’s the nearest thing to a meltdown that I ever want to see.” – John Phelan, NYSE Chairman (1987)

Below is a snippet of content from today’s Morning Lineup for Bespoke Premium members. Start a two-week trial to Bespoke Premium now to access the full report.
35 years ago today, US stocks experienced their largest single-day decline in history as the Dow dropped 22.6%. Back then, before most Americans had 401Ks, the stock market wasn’t nearly as enmeshed in the lives of Americans as it is today, but the plunge still was THE story of the day prompting questions over whether it was a repeat of 1929 and the depression that followed. With the benefit of time and hindsight, the market and economy quickly moved on from the 1987 crash, and it barely even registers as a blip on long-term stock charts. Since the close on 10/19/87, the S&P 500 has had an annualized total return of 10.71%. Even more notable, though, is that had you invested in the S&P 500 on the Friday before the crash, you’re annualized total return over that span would have still been just short of 10% (9.99%). Not bad for the worst-timed trade of all time.
Moving to the present day, 2022 has actually been worse than 1987. After the crash in 1987, the S&P 500 was down less than 8% YTD. Today, even after a gain of nearly 4% over the last week, the S&P 500 is down more than 20% YTD or twice the decline of the S&P 500 at this point in 1987.
This morning, futures are in the red after trading higher overnight as yields surge with the 10-year nearing 4.10%. Building Permits and Housing Starts were just released and came in mixed relative to expectations with starts missing forecasts while starts came in a bit higher than forecast. Mortgage applications continue to decline, though, suggesting that the sector will continue to face pressure.
It’s now been a week since the S&P 500’s closing low on 10/12 (the intraday low was on 10/13), so we wanted to take a bird’s eye look at where things stand at the index and sector level. Of the Russell 2000 (IWM), Nasdaq 100 (QQQ), and S&P 500 (SPY), IWM probably looks best from a technical perspective. Of the three indices shown, it is the only one that didn’t violate the June lows on a closing basis and is also the only one that made a higher high even if it was just on an intraday basis. For both QQQ and SPY, the charts look very similar as last week’s lows represented lower lows, and the rally over the last few days has yet to make a higher high.

At the sector level, Financials have been leading the charge, rallying more than 6% over the last week. Of the remaining ten sectors, the only one not up more than 2.5% is Utilities. Despite the gains from the last week, though, the only sector that has managed to retake its 50-day moving average is Energy, and four sectors (Technology, Real Estate, Consumer Discretionary, and Utilities) still remain at oversold levels.

Our Morning Lineup keeps readers on top of earnings data, economic news, global headlines, and market internals. We’re biased (of course!), but we think it’s the best and most helpful pre-market report in existence!
Start a two-week trial to Bespoke Premium to read today’s full Morning Lineup.
The Closer – Terminal Rates, Production, Correlations – 10/18/22
Log-in here if you’re a member with access to the Closer.
Looking for deeper insight into markets? In tonight’s Closer sent to Bespoke Institutional clients, we begin tonight with commentary regarding tonight’s earnings reports (page 1) followed by a look terminal rates (page 2). We then dive into today’s industrial production figures (page 3) followed by a look at asset correlations (pages 4 and 5).

See today’s full post-market Closer and everything else Bespoke publishes by starting a 14-day trial to Bespoke Institutional today!
Daily Sector Snapshot — 10/18/22
Bespoke Stock Scores — 10/18/22
Not All New Lows for Homebuilders
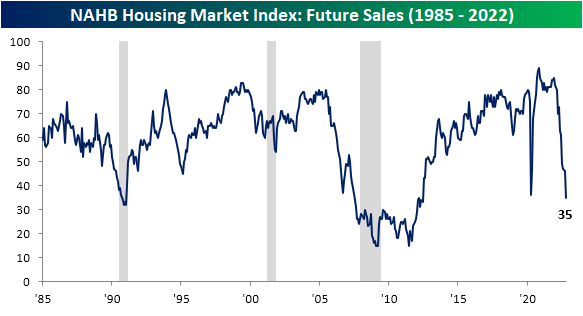
With mortgage rates running higher unabated and mortgage demand decimated, homebuilder sentiment has continued to tank. The latest reading on homebuilder sentiment from the NAHB hit a new post-pandemic low in October dropping from 46 down to 38. Outside of the weaker readings in May and April of 2020, August 2012 was the last time the index was as low as it is now.
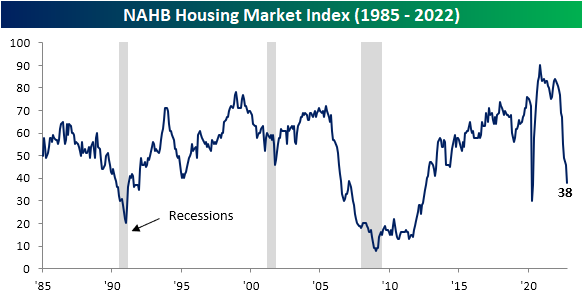
Not only is the index at a new cycle low, but the 8-point month-over-month drop also ranks in the bottom 1% of all monthly moves. The declines in the present and future sales indices rank by similar magnitudes.

Although the headline index as well as sub-indices like present sales and traffic have not yet taken out 2020 lows, the index for future sales dropped to its lowest level since June 2012. As shown above, it has the lowest reading within its respective range historically of each of the sub-indices.
The only other index in the report that is below 2020 levels is the sentiment in the West region. While the Midwest and South have also fallen precipitously, the Northeast actually experienced a modest rebound in sentiment. Relative to other indices in the report, homebuilder sentiment in the Northeast is remarkably stronger with the index in the 62nd percentile relative to historical readings.

As for the technical picture of homebuilder stocks, recent declines have been a bit healthier than the broader market. Whereas major indices set new 52-week lows as recently as last week, the lows for the S&P 1500 Homebuilders Group at the end of September and the end of last week were between 7% and 8% above the June lows. While the line is somewhat choppy, relative strength versus the broader market has also been generally trending upward since the spring. In last Monday’s Closer, we further highlighted the disconnect between housing stocks and macro data.

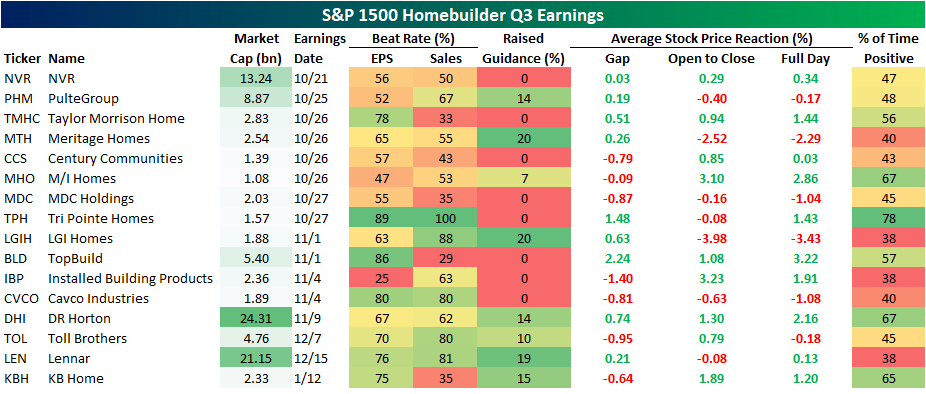
While homebuilder stocks have been holding up surprisingly well, earnings season is on the horizon which has the potential to change that picture; especially if said earnings start to mirror macro housing data. Using data from our Earnings Explorer database, below we show each of the S&P 1500 Homebuilder stocks as well as when they are expected to report earnings and what their historical Q3 earnings beat rates and stock price reactions have been.
Overall, Tri Pointe Homes (TPH) has been one of the strongest performers for Q3 with a positive reaction by the stock 78% of the time as it possesses the strongest beat rates as well. In fact, for TPH Q3 ranks as the best quarter of the year for stock price reactions. That is also the case for TopBuild (BLD) and KB Homes (KBH). Conversely, Q3 marks the weakest response to earnings for LGI Homes (LGIH), Cavco Industries (CVCO), Toll Brothers (TOL), and Lennar (LEN). Click here to learn more about Bespoke’s premium stock market research service.