
Bespoke’s Morning Lineup – 2/1/23 – Starting the Month on a Down Note
See what’s driving market performance around the world in today’s Morning Lineup. Bespoke’s Morning Lineup is the best way to start your trading day. Read it now by starting a two-week trial to Bespoke Premium. CLICK HERE to learn more and start your trial.
“Money is the MC-mansion in Sarasota that starts falling apart after 10 years. Power is the old stone building that stands for centuries.” – Frank Underwood, House of Cards

Below is a snippet of content from today’s Morning Lineup for Bespoke Premium members. Start a two-week trial to Bespoke Premium now to access the full report.
What a January that was! After closing out an already bad year on a down note, the Nasdaq stormed into 2023 rallying 10.7% in January. Never mind the fact that it’s still only 1% higher than where it was when it closed November, the strong start to the year has a lot of bulls newly emboldened, although there’s more than a small minority of investors saying they won’t get fooled again.
So how common is it to see the Nasdaq rally 10% or more in a month? Since 2000, there have been 33 prior months where the Nasdaq rallied at least 10%, and if you narrow that down to 10% monthly rallies that followed a twelve-month period where the index was down, the list gets cut in half to just 16 prior occurrences. In the table below, we list each of those prior months since 2000 along with the Nasdaq’s forward performance over the next one, three, and twelve months. Since 2002, these 10%+ rallies after a decline in the prior twelve months have been followed by positive returns in the next year. During the year 2001, though, there were four separate occurrences, and each one was followed by declines over the next year. For a longer-term and more detailed look at the Nasdaq’s performance after 10+ monthly gains, check out today’s Morning Lineup.

Our Morning Lineup keeps readers on top of earnings data, economic news, global headlines, and market internals. We’re biased (of course!), but we think it’s the best and most helpful pre-market report in existence!
Start a two-week trial to Bespoke Premium to read today’s full Morning Lineup.
January 2023 Asset Class and Stock/Sector Performance
It was a January to remember for investors (who went through one of the worst years in recent history in 2022). Below is a look at the recent performance of various asset classes using our ETF matrix. Performance in January (YTD 2023), over the last six months, and over the last year is shown for each ETF (or exchange traded product).
Looking specifically at January, the Nasdaq 100 (QQQ) was the best performing US index ETF with a gain of 10.6%. The small-cap Russell 2,000 (IWM) wasn’t far behind with a gain of 9.8%. The Dow 30 (DIA) — the index that held up the best in 2022 — was up the least in January with a gain of 2.95%.
At the sector level, Communication Services (XLC) was up the most with a gain of 15.1% followed closely by Consumer Discretionary (XLY) at 14.8%. While these two sectors were up double-digit percentage points, three sectors actually fell in January: Consumer Staples (XLP), Health Care (XLV), and Utilities (XLU).
Outside of the US, the bulls were running with a number of country ETFs up 10%+, including Australia (EWA), China (ASHR), France (EWQ), Germany (EWG), Italy (EWI), Mexico (EWW), and Spain (EWP). India (PIN) was the only country in our matrix that was down with a decline of just 5 basis points.
Commodity ETFs/ETNs were mostly flat with one exception — natural gas. As shown, UNG was down 33.9% in January, and it’s now down 67.4% over the last six months.
Finally, Treasury ETFs continued to bounce back after a horrific 2022, with the longer the duration, the better the performance. The 20+ year Treasury ETF (TLT) was up the most with a huge monthly gain of more than 7%.

Below is a look at the average performance of stocks in the large-cap Russell 1,000 by sector during this past January. We also show the average distance from 52-week high and the average total return in 2022. As you can see, the areas that got hit the hardest in 2022 are the ones that bounced back the most in January. The average stock in the Communication Services sector gained 16% in January, but these stocks are still 32% below their 52-week highs after falling 32.6% in 2022. Energy and Utilities stocks averaged minimal gains in January, but they’re also the only two sectors that averaged gains in 2022.

Finally, below is a list of the 35 best-performing individual stocks in the Russell 1,000 in January. Topping the list is Carvana (CVNA) — which is still in the Russell 1,000 for now — with a gain of 114.6% during the month. Even after more than doubling in January, CVNA remains 94% below its 52-week high.
Aside from National Instruments (NATI), this list of big winners in January is a who’s who of stocks that got crushed in 2022. Not one stock was up last year, and they were down an average of 61.6% in 2022! After averaging a gain of 49.6% this month, they’re still close to 50% below their 52-week highs. The two biggest stocks on the list are Tesla (TSLA) and NVIDIA (NVDA). Tesla ended up gaining 40.6% in January after falling 65% in 2022, while NVIDIA gained 33.7% after getting cut in half in 2022. Some other recognizable names include Lucid (LCID), Peloton (PTON), Warner Bros Discovery (WBD), Lyft (LYFT), Spotify (SPOT), Roku (ROKU), Zillow (ZG), Paramount (PARA), and Carnival (CCL).

On the flip side, below are the 35 worst-performing stocks in the Russell 1,000 in January. Whereas the best-performing stocks this month were the ones that got hit hardest last year, the worst-performing stocks this month were mostly names that actually posted gains in 2022. On average, these 35 stocks fell 8.5% this month, but they were up 11.4% last year and are only 24% from 52-week highs. The three worst-performing stocks in January were Northrop Grumman (NOC), Enphase Energy (ENPH), and Texas Pacific (TPL). All three were up huge last year, with NOC up 43%, ENPH up 44.8%, and TPL up 91.2%. Click here to learn more about Bespoke’s premium stock market research service.

As always, past performance is no guarantee of future results.
The Closer – Wages Cool, Stocks Surge – 1/31/23
Log-in here if you’re a member with access to the Closer.
Looking for deeper insight into markets? In tonight’s Closer sent to Bespoke Institutional clients, we start out with a look at the major deceleration in wage and salary growth (page 1) followed by a look at the reversal in rental and home prices (page 2). We also update the latest homeownership and vacancy rate data (page 3). Following a rundown of tonight’s major earnings reports (page 4) before pivoting to show the outperformance of cyclical sectors relative to defensives (page 5).

See today’s full post-market Closer and everything else Bespoke publishes by starting a 14-day trial to Bespoke Institutional today!
Daily Sector Snapshot — 1/31/23
Chart of the Day – February Intra-Month Seasonality
B.I.G. Tips – Fed Day on the Way
Bespoke Stock Scores — 1/31/23
Bespoke’s Morning Lineup – 1/31/23 – Ending the Month on a Down Note
See what’s driving market performance around the world in today’s Morning Lineup. Bespoke’s Morning Lineup is the best way to start your trading day. Read it now by starting a two-week trial to Bespoke Premium. CLICK HERE to learn more and start your trial.
“I would rather hire a man with enthusiasm, than a man who knows everything.” – John D. Rockefeller
Below is a snippet of content from today’s Morning Lineup for Bespoke Premium members. Start a two-week trial to Bespoke Premium now to access the full report.
Futures are lower heading into the last trading day of the month, but they’re well off their lows of the morning. Treasury yields and crude oil are also lower but like equities, are off their lows of the morning. The Q4 Employment Cost Index was just released and came in at a level of 1.0% versus forecasts for a reading of 1.1%. That’s the third straight quarterly decline from a multi-decade peak in Q1 of 2022, and while it won’t change what the Fed does at its meeting that starts today, it could potentially make Powell slightly less hawkish when he speaks tomorrow.
Yesterday’s 1.3% decline was the third 1%+ decline for the S&P 500 this month and the 8th 1% move (up or down). While futures are only modestly lower now, if there is another 1% move today, it would be the most 1% daily moves in the month of January since 2016 when there were 13 (tied for the third most since 1953 when the current five-trading day week began). If there’s not a 1% move, this January will simply be tied with last year for the most since 2016. Thankfully, the result in terms of performance won’t be the same.

Yesterday’s decline may have been disappointing for bulls but in terms of drivers of the losses, it looks like nothing more than profit-taking following some big YTD gains. The scatter chart below compares the performance of Industry Groups YTD heading into this week (x-axis) versus Monday’s performance (y-axis). The two biggest losers on Monday were Autos & Parts (-5.5%) and Semiconductors (-3.0%), and heading into the week they were the two best performers on a YTD basis with gains of 36.1% and 17.2% respectively. At the other end of the spectrum, two of the only three groups that finished the day higher on Monday (Household & Personal Products and Food Beverage & Tobacco) were also the two worst-performing groups on a YTD basis heading into yesterday.

On the topic of semis, the group is currently tightly wedged between two key levels. About 3% below Monday’s close is the downtrend line that was broken to the upside earlier this month while about 5% above, resistance corresponding to the lows in March and the subsequent highs from June and August.

Our Morning Lineup keeps readers on top of earnings data, economic news, global headlines, and market internals. We’re biased (of course!), but we think it’s the best and most helpful pre-market report in existence!
Start a two-week trial to Bespoke Premium to read today’s full Morning Lineup.
Sector Divergence
On this last trading day of January, below is a snapshot of how the major US sector ETFs have performed so far this year. Over these last few weeks as the broad market has rallied, we’ve definitely seen some sector divergence. Defensive sectors like Consumer Staples (XLP) and Utilities (XLU) have come under selling pressure, while cyclical sectors more tied to the business cycle have surged. Communication Services (XLC) and Consumer Discretionary (XLY) are both up more than 12% YTD already, while Technology (XLK), Materials (XLB), Real Estate (XLRE), and Financials (XLF) are up more than 5%. The only sectors down on the year are Consumer Staples, Utilities, and Health Care (XLV). At the moment, four sectors are overbought (more than one standard deviation above their 50-DMAs) versus three that are oversold (more than one standard deviation below their 50-DMAs). Click here to learn more about Bespoke’s premium stock market research service.

Below is a snapshot of price charts for six sector ETFs pulled from our Chart Scanner tool. These are the three sectors up the most YTD (XLC, XLRE, XLY) and down the most YTD (XLP, XLU, XLV).

As we get set to enter a new month, last week we published a report for subscribers looking at historical market seasonality in February and for the remainder of the year based on how the market performs in January. Does a positive January typically mean positive returns going forward or does it not matter? To find out the answer to this question and see everything else Bespoke is publishing for subscribers, sign up for a one-month trial to Bespoke All Access today.

The Closer – Housing Stocks, Five Fed Recap, Historic Treasury Demand – 1/30/23
Log-in here if you’re a member with access to the Closer.
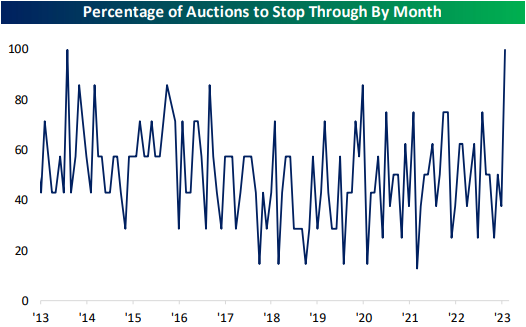
Looking for deeper insight into markets? In tonight’s Closer sent to Bespoke Institutional clients, we start with a recap of Whirlpool (WHR) earnings before pivoting to a look at housing related stocks more broadly (page 1). We then dive into the outperformance of commodities relative to the dollar (page 2). Next, we provide our fifth and final update of our Five Fed Manufacturing Composite (page 3 – 5). Afterward, we show just how strong January was for Treasury auctions (page 6) before closing with a rundown of the latest positioning data (pages 7 -9).
See today’s full post-market Closer and everything else Bespoke publishes by starting a 14-day trial to Bespoke Institutional today!