Chart of the Day: Homebuilders Soar
Bespoke’s Morning Lineup – 2/2/23 – Lots of Likes to Go Around
See what’s driving market performance around the world in today’s Morning Lineup. Bespoke’s Morning Lineup is the best way to start your trading day. Read it now by starting a two-week trial to Bespoke Premium. CLICK HERE to learn more and start your trial.
“If you just set out to be liked, you would be prepared to compromise on anything at any time, and you would achieve nothing.” – Margaret Thatcher

Below is a snippet of content from today’s Morning Lineup for Bespoke Premium members. Start a two-week trial to Bespoke Premium now to access the full report.
Ultimately, it all comes down to the fact that everyone just wants to be liked. After months of hawkish rhetoric even as inflation pressures started to ease, Powell has become as popular as the plague in financial circles, but yesterday he decided to tone it down a bit. It wasn’t a lot, but a comment like “We have no desire to overtighten”, was all the market needed. They took that centimeter and went miles with it. The Dow may have been flat on the day, but the S&P 500 finished up 1% and the Nasdaq tacked on a rally of 2%. We hear Powell even got a smile at the newsstand when he picked up the Post this morning (we’re not sure if it was the Washington or New York version). This morning futures are higher again as Meta’s stock surges close to 20%, but lower-than-expected Unit Labor Costs added another leg to the advance.
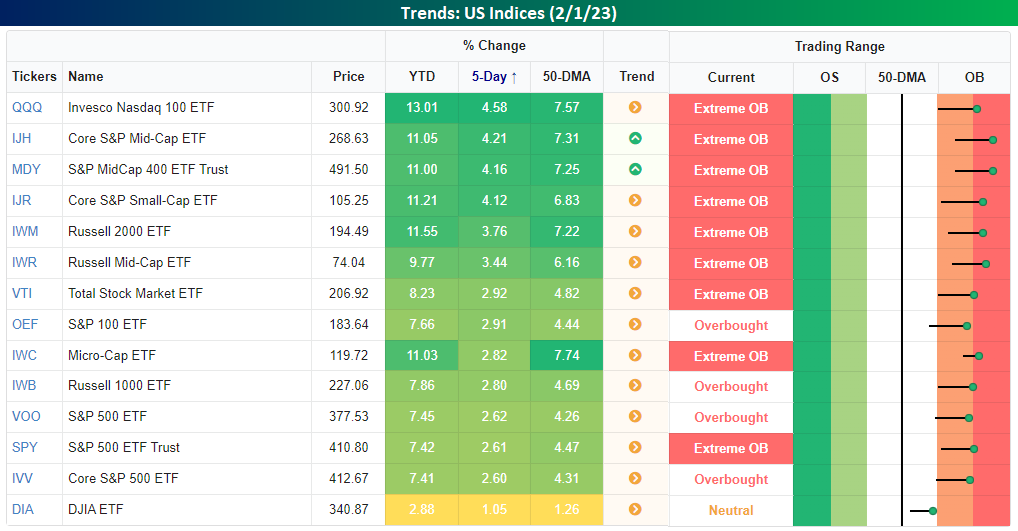
Except for the Dow, all of the major index ETFs in our Trend Analyzer finished the day at ‘overbought’ or ‘extreme overbought’ levels, and YTD they’re all (again excluding the Dow) up at least 7% YTD with many already up by double-digit percentages.
For the S&P 500, it finished the day 1.95 standard deviations above its 50-DMA. Since Powell became the Fed boss in February 2018, the only other time the S&P 500 was further above its 50-DMA on a Fed meeting day (scheduled or unscheduled) was on 11/3/21. That was the last meeting before Powell ditched the term ‘transitory’.

The S&P 500 has ‘passed’ a number of tests in recent weeks. First, it was the 200-DMA, and then it broke above its downtrend line from the highs in January 2022. Yesterday, the latest resistance to go by the wayside was the December peak which resulted in a higher high. Now, with the S&P 500 trading just under two standard deviations above its 50-DMA, it is at overbought levels where four prior rallies in the last 12 months have stalled out. Each milestone that the market crosses reinforces the sustainability of this rally, but on the way up, there are always ‘roadblocks’ ahead. They don’t call it a wall of worry for nothing!

Our Morning Lineup keeps readers on top of earnings data, economic news, global headlines, and market internals. We’re biased (of course!), but we think it’s the best and most helpful pre-market report in existence!
Start a two-week trial to Bespoke Premium to read today’s full Morning Lineup.
The Closer – The Hawks Aren’t Wearing Any Clothes – 2/1/23
Log-in here if you’re a member with access to the Closer.
Looking for deeper insight into markets? In tonight’s Closer sent to Bespoke Institutional clients, we begin with some commentary on today’s FOMC decision and Fed Chair Powell’s presser (pages 1 and 2). We then dive into the major earnings reports of the evening (page 3) before switching to the latest macro data in the form of the JOLTS report (page 4), ISM Manufacturing (page 5), and EIA inventories (page 6).

See today’s full post-market Closer and everything else Bespoke publishes by starting a 14-day trial to Bespoke Institutional today!
Daily Sector Snapshot — 2/1/23
Bespoke’s Consumer Pulse Report — February 2023
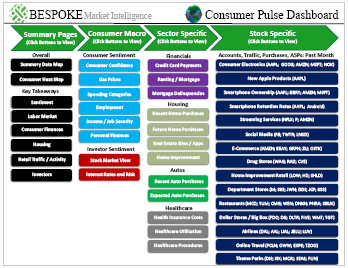
Bespoke’s Consumer Pulse Report is an analysis of a huge consumer survey that we run each month. Our goal with this survey is to track trends across the economic and financial landscape in the US. Using the results from our proprietary monthly survey, we dissect and analyze all of the data and publish the Consumer Pulse Report, which we sell access to on a subscription basis. Sign up for a 30-day free trial to our Bespoke Consumer Pulse subscription service. With a trial, you’ll get coverage of consumer electronics, social media, streaming media, retail, autos, and much more. The report also has numerous proprietary US economic data points that are extremely timely and useful for investors.
We’ve just released our most recent monthly report to Pulse subscribers, and it’s definitely worth the read if you’re curious about the health of the consumer in the current market environment. Start a 30-day free trial for a full breakdown of all of our proprietary Pulse economic indicators.
Bespoke’s Matrix of Economic Indicators – 2/1/23
Our Matrix of Economic Indicators provides a concise summary analysis of the US economy’s momentum. We combine trends across the dozens and dozens of economic indicators in various categories like manufacturing, employment, housing, the consumer, and inflation to provide a directional overview of the economy.
To access our newest Matrix of Economic Indicators, start a two-week free trial to either Bespoke Premium or Bespoke Institutional now!

Bespoke Market Calendar — February 2023
Please click the image below to view our February 2023 market calendar. This calendar includes the S&P 500’s historical average percentage change and average intraday chart pattern for each trading day during the upcoming month. It also includes market holidays and options expiration dates plus the dates of key economic indicator releases. Click here to view Bespoke’s premium membership options.

Fixed Income Weekly: 2/1/23
Searching for ways to better understand the fixed income space or looking for actionable ideas in this asset class? Bespoke’s Fixed Income Weekly provides an update on rates and credit every Wednesday. We start off with a fresh piece of analysis driven by what’s in the headlines or driving the market in a given week. We then provide charts of how US Treasury futures and rates are trading, before moving on to a summary of recent fixed income ETF performance, short-term interest rates including money market funds, and a trade idea. We summarize changes and recent developments for a variety of yield curves (UST, bund, Eurodollar, US breakeven inflation and Bespoke’s Global Yield Curve) before finishing with a review of recent UST yield curve changes, spread changes for major credit products and international bonds, and 1 year return profiles for a cross section of the fixed income world.
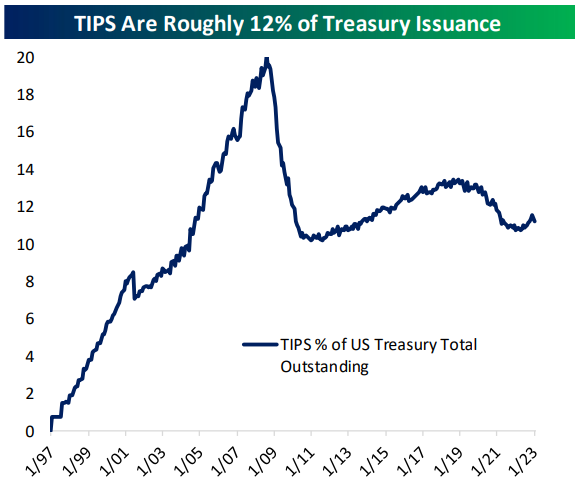
In this week’s report, we discuss the TIPS market.
Our Fixed Income Weekly helps investors stay on top of fixed-income markets and gain new perspectives on the developments in interest rates. You can sign up for a Bespoke research trial below to see this week’s report and everything else Bespoke publishes free for the next two weeks!
Click here and start a 14-day free trial to Bespoke Institutional to see our newest Fixed Income Weekly now!
10 Names For Half the Move
Taking tabs on the strong first month of the year, at multiple points in the past day we highlighted (see here, here, and here) which areas were the best performing parts of the market. In January, sectors like Tech, Communication Services, and Consumer Discretionary saw massive outperformance following the opposite playing out throughout 2022. Another significant point to these sectors is that they are home to some of the largest stocks in the S&P 500 by market cap; meaning those largest stocks have outsized impacts on the moves in the market cap-weighted S&P 500. As such, a massive portion of the S&P 500’s gains in January came from only a handful of names.
In the table below, we show the ten stocks which had the largest impacts on the S&P 500 index level moves. With double-digit percentage rallies during the month, the largest stocks in the index with market caps of more than $1 trillion like Apple (AAPL) and Amazon (AMZN) top the list. Those two alone accounted for over a fifth of the S&P’s gains in January. Impressively, adding in the rest of the top ten largest contributors (which account for roughly a third of the S&P 500’s total market cap) shows that those ten names combined had nearly the same impact as the hundreds of other stocks that make up the index.


Although mega caps, and thus a handful of sectors, have provided an outsized boost to the S&P 500 to start out the year, the market’s rally has still been broad-based as breadth has been quite positive. As shown below, the S&P 500’s cumulative advance-decline (A/D) line has been grinding higher and making new highs even as price has not been as strong. In other words, a large number of stocks are moving higher even if a small number of stocks are pulling more than their fair share of the load. Click here to learn more about Bespoke’s premium stock market research service.

Home Prices Coming Down from the Summit
November home price data from S&P CoreLogic Case Shiller was released earlier this week, and below is an updated look at recent changes in prices across the country.
The composite and national indices all fell month-over-month (m/m) for the fifth month in a row, but the year-over-year (y/y) change in prices is still running at +6% or more. Unless prices plummet at an even faster pace over the next couple of months, we likely won’t see a negative y/y number until the March or April 2023 data is released (which won’t be until May/June since the data is released on a two-month lag).

Looking at different parts of the country, cities in the West fell the most m/m with declines of more than 1% in San Francisco, Seattle, San Diego, Phoenix, and Las Vegas. Dallas and Tampa also fell 1%+ m/m, although Miami only fell 20 bps. New York saw prices fall the least of any city at just -0.06% m/m.
Notably, while the national indices are still up 6%+ y/y, San Francisco is the first city to fall into the red on a y/y basis with a decline of 1.57% in prices from November 2021 to November 2022. Tampa and Miami home prices are still up the most y/y with gains of 16.85% and 18.41%, respectively.
We also show how much prices are up since February 2020 just before COVID began as well as how much prices have now fallen from their post-COVID peaks. The national indices are all still up more than 30% from pre-COVID levels, and so far they’ve fallen around 5% from their highs. San Francisco and Seattle have seen the biggest drops in prices with declines of more than 13%, while New York, Chicago, Miami, and Atlanta have seen prices fall the least.


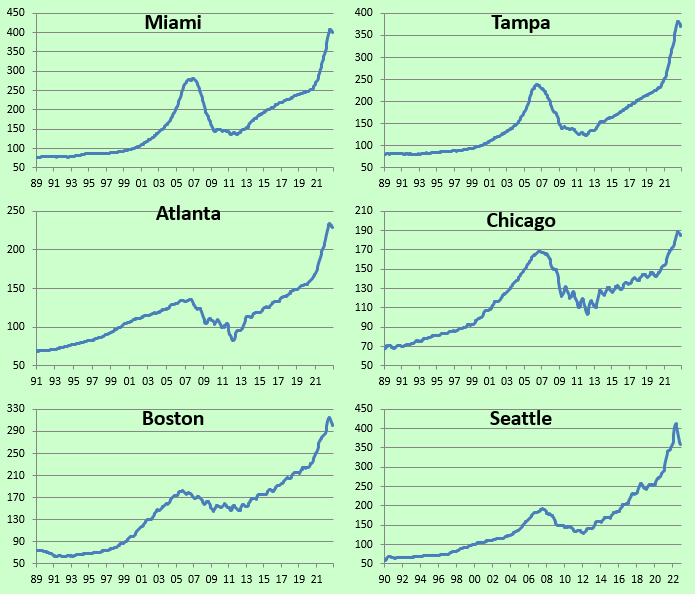
Below are historical price charts of the Case Shiller home price indices for all of the cities covered. While prices look to have peaked, you can see that they’re still extremely elevated relative to any point over the last 30+ years, including the prior housing bubble highs seen in the mid-2000s before the housing crash that occurred alongside the Financial Crisis of 2008/2009. If the peak was the summit of Mt. Everest, we’re still a long way from base camp. Click here to learn more about Bespoke’s premium stock market research service.