Chart of the Day – Watch Taiwan (Semi)
The Year In Headlines: 2025
Bespoke’s Morning Lineup – 1/13/26 – Staples Lead
See what’s driving market performance around the world in today’s Morning Lineup. Bespoke’s Morning Lineup is the best way to start your trading day. Read it now by starting a two-week trial to Bespoke Premium. CLICK HERE to learn more and start your trial.
“There’s nothing more dangerous than someone who wants to make the world a better place.” – Banksy

Below is a snippet of commentary from today’s Morning Lineup. Start a two-week trial to Bespoke Premium to view the full report.
It’s a banksy type of morning in the US as some of the largest financial institutions in the world start to release Q4 results. JP Morgan (JPM) missed on the top and bottom line, but there werecharges included in the results, and the stock is trading marginally higher. BNY Mellon (BK) reported better-than-expected EPS and sales, and its stock is fractionally lower. The only other major report of the morning was Delta (DAL), which also reported better-than-expected top and bottom-line results, but its stock is down over 3% in the pre-market. So, it’s not necessarily how you report versus expectations that matters.
Drama surrounding Fed Chair Powell and the subpoenas issued has subsided this morning as Jeanine Pirro softened her stance towards the issue, and the White House says they were not made aware of the actions beforehand. For now, it appears as though the story will be one more in a litany of ‘shocking’ headlines that don’t amount to anything.
The big news of the morning was the December CPI, and after questions surrounded the lower-than-expected November print, many were expecting a hot print for December as the integrity of the data that makes up the report improved. They were wrong. Headline CPI was right in line with forecasts while the core reading came in a tenth weaker than expected on both a m/m and y/y basis. In response to the report, futures experienced a modest bounce and are now firmly in positive territory, while Treasury yields are lower. Crude oil is up another 1% this morning as WTI trades back above $60, while gold is basically flat, as other precious metals trade modestly higher. Finally, bitcoin is higher again this morning and trading back above $92K. The gains also follow reports that a Strategy director purchased 5,000 shares of the company’s stock for just under $800K.
In Asia, it was a mixed session. While Japan returned from Monday’s holiday with a monster 3.1% rally, other indices in the region didn’t fare as well. It’s not often that South Korea is a laggard on an up day, but with a gain of ‘only’ 1.5%, it was up less than half as much as Japan. Hong Kong was up just under 1% while China’s Shanghai Composite fell 0.6%. Japanese PM Takaichi plans to hold snap elections next month to solidify her party’s position in parliament, but outside of that, it was a relatively quiet session for news.
In Europe, stocks are modestly lower across the board, with the STOXX 600 down 0.2%. France is leading the way lower but is still down less than 0.5%, while Germany hangs on to the flatline.
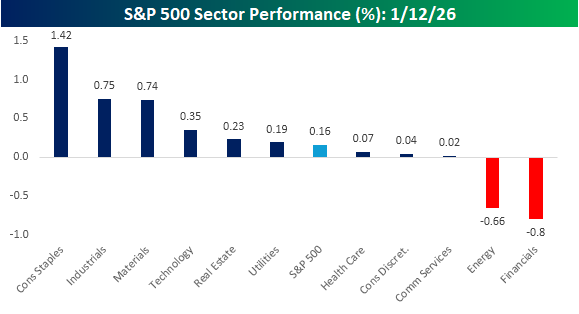
While the banks are the focus of the market’s attention this morning, the standout sector for the last few days has been Consumer Staples, even as the S&P 500 has rallied to new highs. As shown in the chart below, Consumer Staples rallied 1.42% yesterday, which was nearly twice the gain of the next two closest sectors – Industrials and Materials.
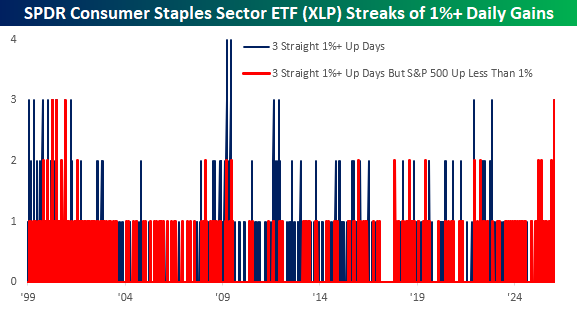
Yesterday’s rally for the sector was the third straight day that it has rallied more than 1% in a single session. The chart below shows prior streaks of 1%+ for the SPDR Consumer Staples sector ETF (XLP), and while there have been plenty of other periods where the ETF rallied at least 1% for three straight sessions, the only streaks that were longer occurred in March and June 2009, coming out of the Financial Crisis lows.
What makes the current streak unique, though, is that all three days of gains have occurred on days when the S&P 500 didn’t rally 1%+. It’s one thing to rally 1% when the broader market is also up at least 1%, but to rally that much when the market isn’t up that much is much more significant. As the red bars in the chart illustrate, the only other times that XLP rallied 1%+ for three days in a row when the S&P 500 wasn’t up 1%+ on any of those three days was back in early 2000, right around and after the dot-com peak. Gulp.
The Closer – Steepener, GSEs, Silver Superlatives – 1/12/26
Log-in here if you’re a member with access to the Closer.
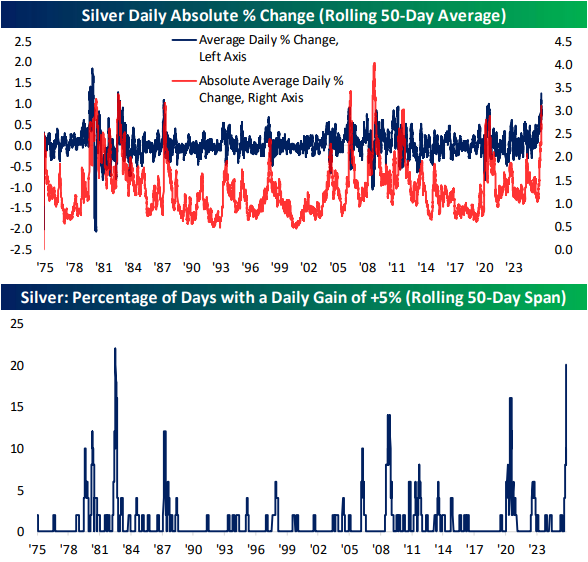
Looking for deeper insight into markets? In tonight’s Closer sent to Bespoke Institutional clients, we begin with some further commentary surrounding Powell vs. the administration and a trade idea from this situation’s impacts on the yield curve (page 1). We then jump into the recent moves in housing related areas of the market (page 2) before finishing out with a dive into some superlatives that the moves in silver have earned (page 3).
See today’s full post-market Closer and everything else Bespoke publishes by starting a 14-day trial to Bespoke Institutional today!
Daily Sector Snapshot — 1/12/26
Chart of the Day: Small-Cap Breakout with New Leadership
Bespoke’s Morning Lineup – 1/12/26 – Never a Dull Moment
See what’s driving market performance around the world in today’s Morning Lineup. Bespoke’s Morning Lineup is the best way to start your trading day. Read it now by starting a two-week trial to Bespoke Premium. CLICK HERE to learn more and start your trial.
“Maintain a firm grasp of the obvious at all times.” – Jeff Bezos
Below is a snippet of commentary from today’s Morning Lineup. Start a two-week trial to Bespoke Premium to view the full report.
As of early Sunday afternoon, it looked as though the news surrounding the anti-regime protests in Iran or the President’s call for a one-year cap on credit card interest rates at 10% would be the major news catalysts for trading to kick off the week. Then, last night, news broke that the Department of Justice had opened a criminal investigation into Federal Reserve Chair Jerome Powell related to the $2.5 billion renovation of the Federal Reserve’s headquarters. Powell responded that the investigation was “a consequence of the Federal Reserve setting interest rates based on our best assessment of what will serve the public, rather than following the preferences of the President.” He went on to add that this investigation will determine “whether the Fed will be able to continue to set interest rates based on evidence and economic conditions — or whether instead monetary policy will be directed by political pressure or intimidation.”
The President (as you would expect) denied any involvement in the investigation, and while it obviously looks political, the reality is that, provided he did nothing wrong, which we have no reason to believe he did, Powell should have nothing to worry about. The bigger question, in our mind, is who in their right mind would ever want Powell’s job? If I’m one of the Kevins, or any of the other people that prediction markets have as succeeding Powell, I’d be cheering every time my odds went down!
S&P 500 futures are down 0.5% leading up to the opening bell, while the Nasdaq is down 0.75%. Treasury yields are slightly higher, with the 10-year yield up 2 bps to 4.19%, while the dollar is lower. Crude oil is fractionally lower while gold is surging more than 2.5%. All these moves suggest a possible return of the ‘sell America’ trade; at this point, the moves are much too modest to suggest that it is a real concern.
Despite the weakness in US futures, Asian stocks kicked off the week on a positive note. While Japan was closed for a holiday, both onshore and offshore Chinese stocks were up over 1% while South Korea rallied 0.8%. India and Australia were also higher by about 0.5%. South Korea export data showed that while overall exports in the first ten days of January were down 2.3% y/y, chip exports increased over 45%!
In Europe, equities have started the week in a more muted fashion than Asia. The STOXX 600 is slightly lower, while German stocks buck the trend with a gain of 0.5%. There hasn’t been a lot of news specific to the continent this morning, but Sentix Investor Confidence for January did come in less weak than expected.
Before the Powell headlines broke yesterday, news earlier in the weekend about the President calling for a one-year cap of 10% on credit card interest rates looked like it would be the biggest news story heading into the new week. While the President can’t directly force the credit card issuers to cap interest rates, he can make life difficult for them through the bully pulpit of his Truth Social account and the various regulatory agencies that the issuers fall under the purview of.
In response to the President’s comments over the weekend, American Express (AXP) and Capital One (COF), two of the biggest pure-play credit card issuers, are trading sharply lower. AXP is down over 4% while COF is down twice that, with a loss of over 8%. The Financial sector and banks, in general, are also weak today, but nowhere nearly as much as AXP or COF. The weakness in both stocks comes after they finished last week right near 52-week highs. Looking at the price charts of both stocks, though, you can see that they closed near their lows of the day last Friday (top two charts) while the S&P 500 finished the week right near its highs of the day.
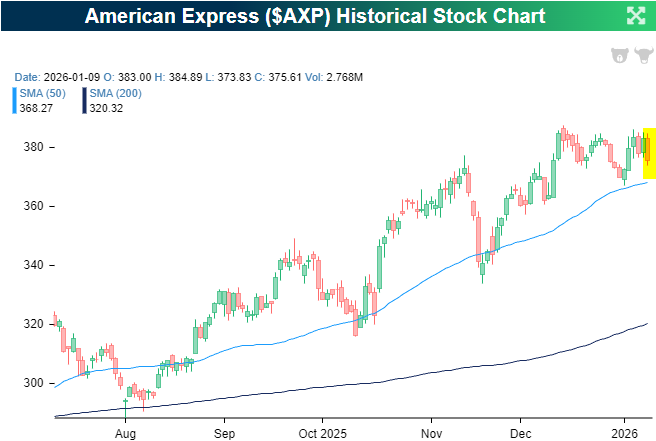
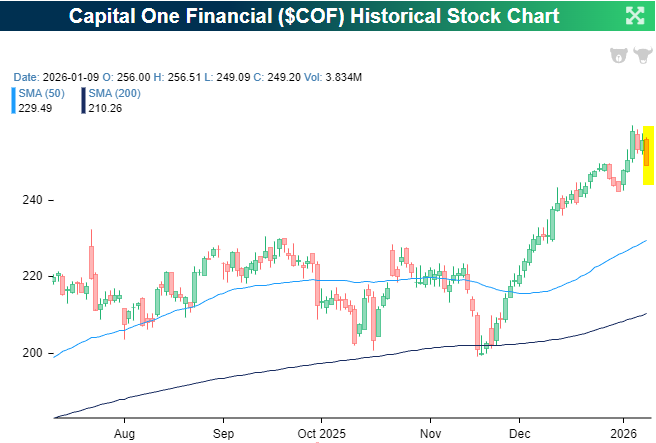
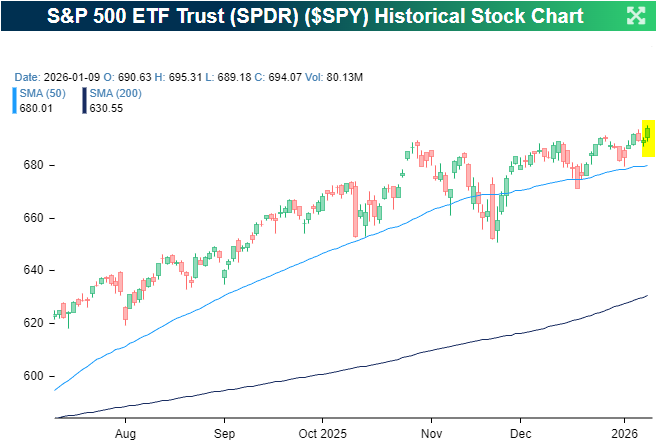
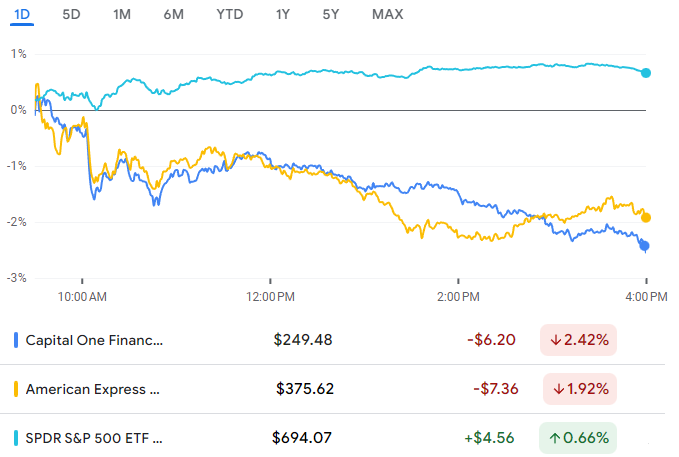
The intraday performance of all three shows the divergence even more clearly. As the S&P 500 rallied intraday, both AXP and COF drifted lower all day. It’s hard to look at this chart and not think that someone knew something.
Brunch Reads – 1/11/26
Welcome to Bespoke Brunch Reads — a linkfest of some of our favorite articles over the past week. The links are mostly market-related, but there are some other interesting subjects covered as well. We hope you enjoy the food for thought as a supplement to the research we provide you during the week.
Teddy’s Territory: On January 11, 1908, Theodore Roosevelt used the Presidency to declare the Grand Canyon National Monument by executive proclamation. Roosevelt already knew the canyon well. He had visited it years earlier and famously warned Americans not to “improve” it. That meant no buildings, no fences, no gimmicks. In his mind, the canyon wasn’t scenery to be developed but rather a geological marvel carved over millions of years that no generation had the right to tamper with. When mining and commercial interests continued pressing in northern Arizona, Roosevelt decided waiting on Congress wasn’t an option.
So, he acted unilaterally, invoking the Antiquities Act of 1906, a young and largely untested law that allowed presidents to protect federal land deemed historically or scientifically important. With a single signature, Roosevelt placed more than 800,000 acres under federal protection, which was an enormous and controversial move at the time. Critics accused him of executive overreach.
The Grand Canyon’s monument status laid the groundwork for its eventual designation as a National Park in 1919, but it also proved that the Presidency could be used to defend land from permanent loss. By the time Roosevelt left office, he had protected over 230 million acres of public land, more than any President before or since.
Markets & Investing
A Mystery Trader Made $400,000 Betting on Maduro’s Downfall (WSJ)
An anonymous trader made a small fortune on Polymarket by piling into low-odds bets that Nicolás Maduro would lose power, just hours before a US military operation triggered explosions in Caracas. The timing and concentration of the wagers have fueled suspicions that nonpublic information may have been used, highlighting how prediction markets lack the guardrails that exist in traditional financial markets. [Link]
Continue reading our weekly Brunch Reads linkfest by logging in if you’re already a member or signing up for a trial to one of our two membership levels shown below! You can cancel at any time.

The Bespoke Report – 1/9/26 – Still Crazy After All These Years
To read our weekly Bespoke Report newsletter and access everything else Bespoke’s research platform offers, start a two-week trial to Bespoke Premium.
Ever since the Covid outbreak shutdown the US and global economy in early 2020, it’s been hard to look at a lot of trends and policies (especially in retrospect) and not think the world lost its mind. Even now, five years later, you can still walk into some stores and see the stickers on floors for where patrons are supposed to stand so that they keep proper distance from others. In some parts of the world, curfews were put in place after dark to help limit the spread of Covid, even though it was obviously not a nocturnal virus. Who can forget the policies early on where golf courses were closed, but liquor stores were deemed essential and could remain open (not that we thought liquor stores should be closed)? Then there were the vaccine cards which became “get out of jail” cards. If you had one, you could return to a normal life, but without one, there were significant limits in the activities you were allowed to do and where you could work.
In the financial markets and economy, Covid also caused widespread policies and trends which would have made most people dumbfounded if they occurred prior to 2020. From a fiscal standpoint, remember the multiple rounds of ‘stimmy checks’? How about the super-sized unemployment benefits which, for many people, made it more rational to stay at home and collect $600/week than it was for them to go to work? How much fraud do you think there ultimately was with the PPP loan program? From a monetary perspective, zero interest rate policies around the world and massive QE pushed interest rates on many global debt instruments below zero!
Equity markets provided no escape. Remember SPACs? How about meme stocks? GameStop (GME), the OG meme stock, can see its market cap swing by billions of dollars a day based on X-posts from “Roaring Kitty”. There’s even ETFs where the sole investment strategy is to find and invest in meme stocks.
As crazy as some of these policies were, or at least seem in hindsight, at the time some were justified, especially early on when there was so much uncertainty, and no one knew what to expect. Our point here is not to judge their necessity but just to highlight them. Five years later, we’re thankful to be back in a much more normal environment. As much as things have improved, though, we’re still quite a way from the way things were before Covid. A recent example of the markets remaining more than a little bit crazy is the insane volatility in metals and memory stocks to start 2026. Time always marches forward, so we’ll never get back to the way things were – for better or worse. The reality is that markets are made up of people, so they’ve always been and always will be a little crazy. That’s one thing that won’t change (or maybe when robots control everything, even that will change too).
For an escape, there’s always sports, or at least that’s what we thought. Then last night as we watched the Miami Hurricanes, a team that many experts argued shouldn’t have even been in the college football playoff, knock Ole Miss out and earn a spot in the championship, commentator Chris Fowler commented that Miami QB “Carson Beck is in his seventh year of eligibility”. Comments like that remind us that even in sports, Covid has left its mark, so there’s no escape. Fowler was incorrect in his comment. Carson Beck is actually “only” in his sixth year of college, but since when was a college career six years! If Miami doesn’t win the championship on January 19th will that mean, in the words of Bluto Blutarsky in Animal House, that it was “Seven Six years of college down the drain”? Maybe the market is one of the more rational escapes after all!
What’s also crazy is how strong of a start the market has gotten off to this year for the S&P 500, and more specifically, both the equal-weight index as well as the Russell 2000.
This week’s Bespoke Report is packed with interesting market trends, so give the full report a read by starting a trial here.