An April to Remember for Stocks
Below is a snapshot of key ETF performance across asset classes for the month of April and so far year to date.
The S&P 500 (SPY) jumped more than 10% in April for its best month since November 2020. The Tech-heavy Nasdaq 100 (QQQ) did even better with a gain of 15.7%, while the Dow 30 (DIA) was up a more modest 7.7%.
Growth outperformed value, and dividend stocks lagged badly.
The Tech sector ETF (XLK) gained more than 20%, while the semis (SMH) gained 32%! On the downside, both Health Care (XLV) and Energy (XLE) actually finished the month in the red.
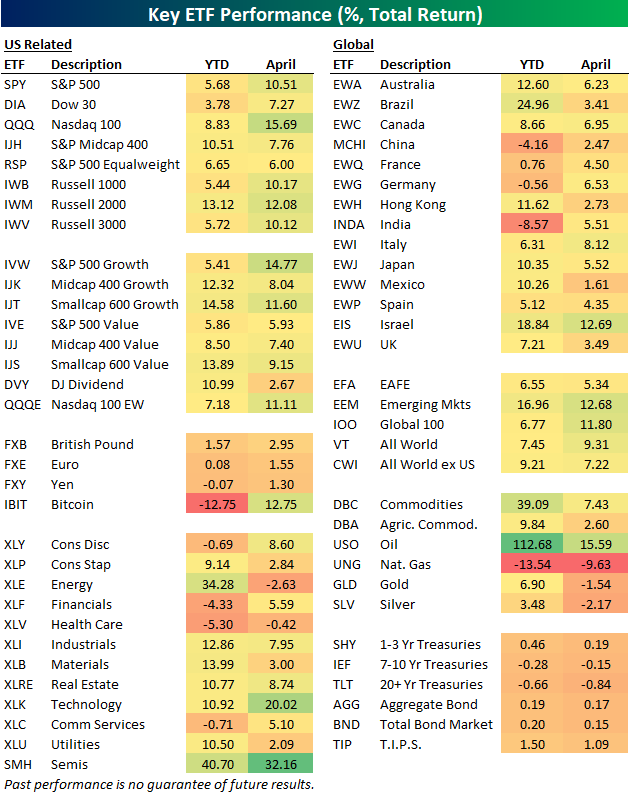
Country ETFs gained in April, but they didn’t gain nearly as much as the US. Oil (USO) rallied 15.6%, but natural gas (UNG), gold (GLD), and silver (SLV) were all down. Longer duration Treasury ETFs were slightly lower in April, but the bond market as a whole (AGG, BND) was up 15 bps.
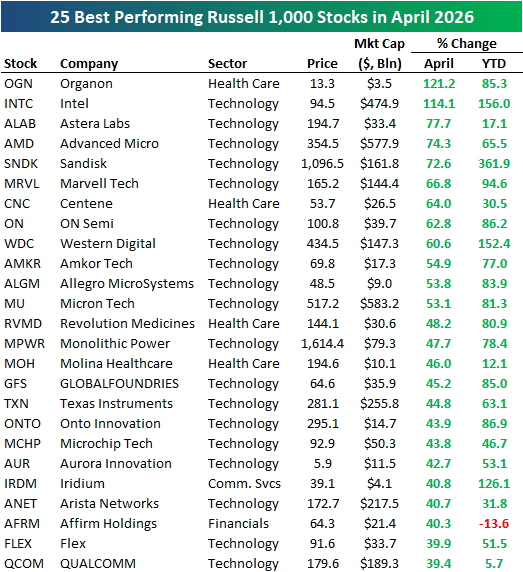
There were some historic moves for individual stocks in April, including two Russell 1,000 stocks that more than doubled: Organon (OGN) and Intel (INTC).
Intel began April with a market cap of roughly $222 billion. It ended the month with a market cap of $474.9 billion.
As shown in the table below, Tech stocks dominated the list of April winners, making up 19 of the top 25 performers. Other notable winners include Astera Labs (ALAB), Advanced Micro (AMD), and Sandisk (SNDK) — all up 70%+.
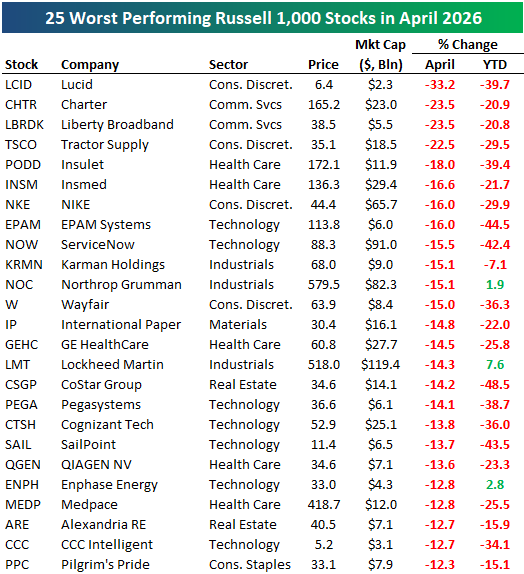
Of course, not all stocks went up in April. Below are the 25 worst performers in the Russell 1,000 during the month, led by Lucid (LCID) with a 33% drop. Charter (CHTR), Liberty (LBRDK), and Tractor Supply (TSCO) all fell more than 20%, while other notables on the list of April losers include NIKE (NKE), Wayfair (W), ServiceNow (NOW), and Northrop Grumman (NOC).
Like this analysis? Join our Think BIG mailing list or Bespoke Premium by starting a trial today! Click below for details on how to sign up for Premium:

New York Alone at the Top
S&P Cotality released its monthly Case Shiller home price data earlier this week, and below is a table highlighting some of the recent trends (through February) across the 20 major metros they track.
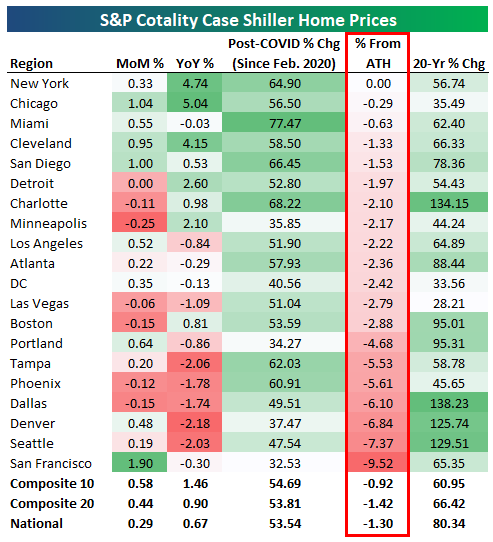
Thirteen of twenty cities were up month-over-month, with San Francisco seeing the biggest jump at 1.9%. A few cities had minor m/m declines like Minneapolis, Boston, Dallas, and Phoenix.
On a year-over-year basis, just eight of twenty cities are higher, led by Chicago, New York, and Cleveland.
Tampa, Denver, and Seattle are down the most y/y with declines of just over 2%.
Lastly, we wanted to point out where cities stand relative to all-time highs. After a brief dip in prices from late 2022 to early 2023, most cities bounced back and made a series of higher highs throughout 2024 and early 2025.
But prices peaked for most cities in the middle of last year, and they’ve seen a slow trickle lower since.
As shown in the table, the only city that’s still at all-time highs for home prices is the Big Apple, where current NYC Mayor Mamdani has just recently proposed a new pied-à-terre tax on second homes worth more than $5 million.
Like this analysis? Join our Think BIG mailing list or Bespoke Premium by starting a trial today! Click below for details on how to sign up for Premium:
Bespoke’s Morning Lineup – 5/1/26 – Now What?
See what’s driving market performance around the world in today’s Morning Lineup. Bespoke’s Morning Lineup is the best way to start your trading day. Read it now by starting a two-week trial to Bespoke Premium. CLICK HERE to learn more and start your trial.
“If The Headline Is Big Enough, It Makes The News Big Enough.” – Citizen Kane

Below is a snippet of commentary from today’s Morning Lineup. Start a two-week trial to Bespoke Premium to view the full report.
Equity futures are slightly higher this morning as investors look to breathe a sigh of relief after a wild couple of weeks. Besides the massive gains in April, the massive deluge of earnings reports this week in terms of both quantity and market cap had the potential to create waves. But we got through it just about as well as you could ask for, as none of the major mega-caps blew up and Wednesday’s Fed meeting was a non-event despite all the pearl-clutching over the number of dissents regarding, not the policy decision, but the phrasing of forward guidance. The media needs something to talk about, though!
The bigger question is, with the most consequential earnings reports and Powell’s last meeting as Fed Chair behind us, what will be the next catalyst? Iran again? That may be the case, though, as just now reports are crossing the tape that Iran has sent a new proposal to Pakistan.
Treasury yields are slightly lower in the US this morning, with the 10-year yield at 4.38%, crude oil is slightly lower, gold is down nearly 1%, and Bitcoin is up 1.5%. International markets are mostly closed this morning in observance of the May Day holiday, but Japan and the UK were both open, and the former saw a modest gain while the UK is down about 0.6%
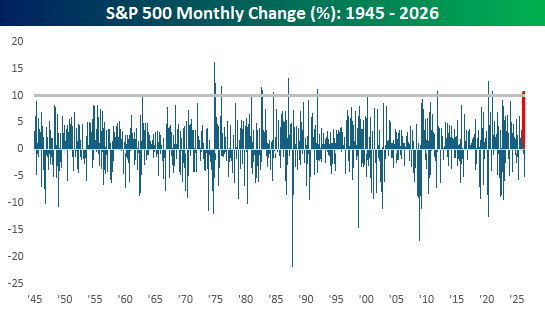
The S&P 500 rallied 10.43% in April, marking the largest monthly gain for the index since November 2020 and the 14th month since WWII that the S&P 500 had a monthly gain of more than 10%. While moves of this magnitude were rare in the immediate years after WWII, they have been somewhat more frequent, but still uncommon, in recent decades.
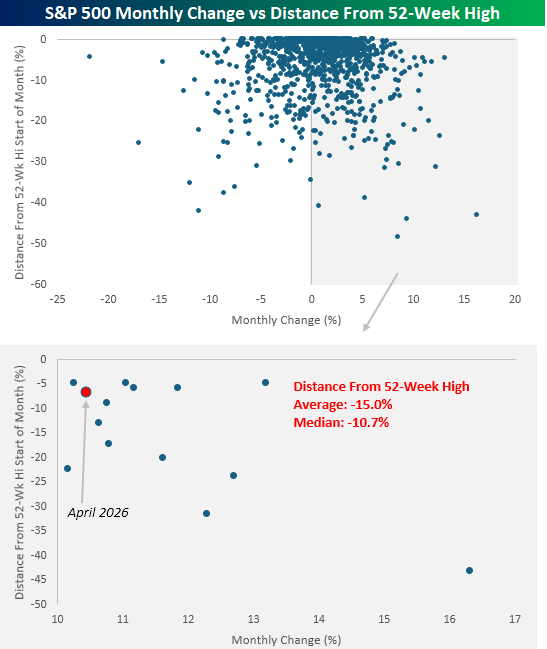
The scatter chart below compares the S&P 500’s monthly change since 1945 to where it was trading relative to a 52-week high at the start of each month. Below that, we have zoomed in on the months that had double-digit percentage gains. At the start of this April, the S&P 500 was just over 6% below its 52-week high, and while that wasn’t the closest the index was trading to a high at the start of a double-digit percentage month, it was close. For all months with double-digit gains, the S&P 500 was trading an average of 15.0% (median: -10.7%) from a 52-week high at the start of the month.
Start a two-week trial to Bespoke Premium to continue reading today’s full Morning Lineup.
The Closer – Hyperscalers, New Low in Claims, ECI – 4/30/26
Log-in here if you’re a member with access to the Closer.
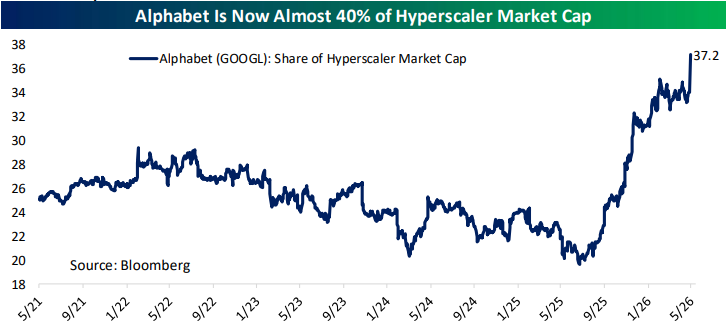
- The S&P 500 booked a 10% gain in April for its best month since November 2020, and a big part of that was Alphabet (GOOGL).
- The Tech sector has ended its longest streak of consecutive closes in extreme overbought territory since November 2019.
- Initial jobless claims cratered to 189K last week, taking out the lows from the white-hot labor market of the pandemic reopening for the lowest reading since 1969.
See today’s full post-market Closer and everything else Bespoke publishes by starting a 14-day trial to Bespoke Institutional today!
The Bespoke 50 Growth Stocks – 4/30/26
The “Bespoke 50” is a basket of noteworthy growth stocks in the Russell 3,000. To make the list, a stock must have strong earnings growth prospects along with an attractive price chart based on Bespoke’s analysis. There were seven changes to the list this month.
The Bespoke 50 is available with a Bespoke Premium subscription or a Bespoke Institutional subscription. With Bespoke Premium, you’ll receive a number of daily market updates from us along with our weekly newsletter and a portion of our investor tools. With Bespoke Institutional, you’ll receive everything that’s included with Premium plus additional daily macro analysis and more stock-specific research.
To see all 50 stocks that currently make up the Bespoke 50, simply start a two-week trial to Bespoke Premium or Bespoke Institutional.
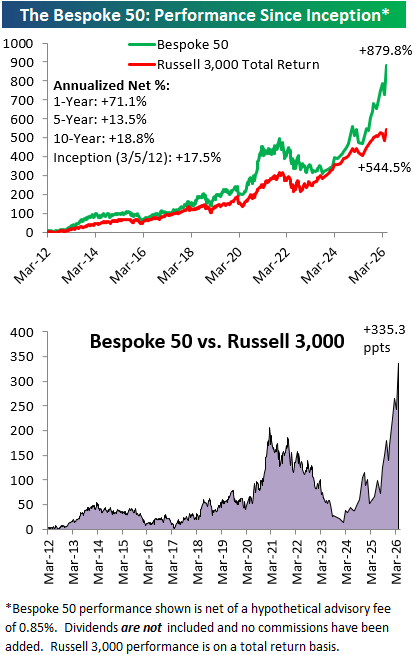
The Bespoke 50 performance chart shown does not represent actual investment results. The Bespoke 50 is updated monthly on Thursdays unless otherwise noted. Performance is based on equally weighting each of the 50 stocks (2% each) and is calculated using each stock’s opening price as of Friday morning after publication. Entry prices and exit prices used for stocks that are added or removed from the Bespoke 50 are based on Friday’s opening price. Any potential commissions, brokerage fees, or dividends are not included in the Bespoke 50 performance calculation, but the performance shown is net of a hypothetical annual advisory fee of 0.85%. Performance tracking for the Bespoke 50 and the Russell 3,000 total return index begins on March 5th, 2012 when the Bespoke 50 was first published. Past performance is not a guarantee of future results. The Bespoke 50 is meant to be an idea generator for investors and not a recommendation to buy or sell any specific securities. It is not personalized advice because it in no way takes into account an investor’s individual needs. As always, investors should conduct their own research when buying or selling individual securities. Click here to read our full disclosure on hypothetical performance tracking. Bespoke representatives or wealth management clients may have positions in securities discussed or mentioned in its published content.
Bespoke’s Weekly Sector Snapshot — 4/30/26
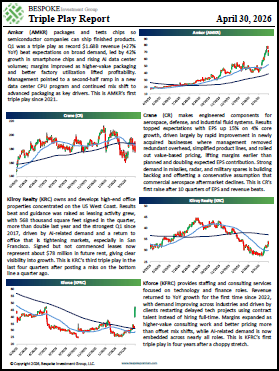
The Triple Play Report: 4/30/26
An earnings triple play is a stock that reports earnings and manages to 1) beat analyst EPS estimates, 2) beat analyst sales estimates, and 3) raise forward guidance. You can read more about “triple plays” at Investopedia.com where they’ve given Bespoke credit for popularizing the term. We like triple plays as an indication that a company’s business is firing on all cylinders, with better-than-expected results and an improving outlook. A triple play is indicative of positive “fundamental momentum” instead of pure fundamentals, and there are always plenty of names with both high and low valuations on our quarterly list.
Bespoke’s Triple Play Report covers what each company does, what this quarter’s results say about their growth outlooks, and their histories of delivering triple plays. Bespoke’s Triple Play Report is available at the Bespoke Institutional level only. You can sign up for Bespoke Institutional now and receive a 14-day trial to read today’s Triple Play Report. To sign up, choose either the monthly or annual checkout link below:
Bespoke Institutional – Monthly Payment Plan
Bespoke Institutional – Annual Payment Plan
Bespoke Investment Group, LLC believes all information contained in these reports to be accurate, but we do not guarantee its accuracy. None of the information in these reports or any opinions expressed constitutes a solicitation of the purchase or sale of any securities or commodities. This is not personalized advice. Investors should do their own research and/or work with an investment professional when making portfolio decisions. As always, past performance of any investment is not a guarantee of future results. Bespoke representatives or clients may have positions in securities discussed or mentioned in its published content.
Chart of the Day: Earnings Deliver
Bespoke’s Morning Lineup – 4/30/26 – We Made It!
See what’s driving market performance around the world in today’s Morning Lineup. Bespoke’s Morning Lineup is the best way to start your trading day. Read it now by starting a two-week trial to Bespoke Premium. CLICK HERE to learn more and start your trial.
“We are seeing unprecedented internal and external demand for AI compute resources.” – Anat Ashkenazi, CFO, Alphabet
Below is a snippet of commentary from today’s Morning Lineup. Start a two-week trial to Bespoke Premium to view the full report.
It was called a make-or-break night for earnings, and the bulls made it through. While the four major hyperscalers aren’t moving in unison this morning, futures are higher with the Nasdaq leading the way, trading up 0.5% while the S&P 500 is up slightly less (+0.40%). Next on the list? Apple (AAPL) after the close. Treasury yields are moving lower after yesterday’s spike, while crude oil is finally seeing a pullback for a change, although WTI is still trading at $105 per barrel. Gold and Bitcoin are both trading up by about 1%.
International markets had a mixed session. Asian stocks declined pretty much across the board, with Japan down just over 1%, but the yen surged as the BoJ gave a final warning regarding yen intervention. In Europe, stocks are generally higher with the STOXX 600 trading up 0.7%, led higher by the FTSE 100, which is up over 1%.
It’s a busy day for economic data in the US on top of tons of earnings, and outside of Chicago PMI at 9:45, all of the reports hit the tape at 8:30. We don’t have time to go through all of them here, but the results were generally OK. GDP was weaker than expected, inflation data was generally inline, Personal Income was stronger than expected, and jobless claims were much better than expected as initial claims fell below 200k!
This morning on CNBC, in a conversation between Gary Gohn and Andrew Sorkin, the former highlighted several positive aspects of the US economy right now. In response, Sorkin asked if it was “right that the market is just ignoring what’s going on in the Middle East right now?” It may feel as though, with the market hitting new highs, that it is ignoring what’s going on in the Middle East, but the reality is that up until this point, it hasn’t had much of an impact on the US economy.
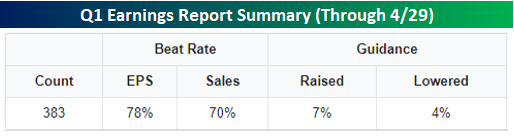
Over the last several weeks, we’ve cited numerous examples of economic data coming in better than expected, and last week’s Beige Book reinforced that trend. The Fed is even less concerned about economic weakness now than it was several weeks ago. This morning, jobless claims dropped below 200K! The latest round of earnings reports also reinforces this trend. Through yesterday, 78% of companies reporting exceeded EPS forecasts while 70% topped revenue estimates.
Those numbers are impressive but also backward-looking. What really stands out is the guidance. 7% of companies reporting have raised guidance this earnings season compared to just 4% that have lowered estimates. These companies see the same dire headlines regarding the Middle East each morning as you and I, but they also see what’s going on in their businesses. Things are strong enough that they feel confident in raising forecasts when they could easily use the uncertainty over the war and energy markets as an excuse to play it conservative.
Yesterday’s earnings headline was the hyperscalers and how companies representing around 18% of the S&P 500’s market cap reported in one after-hours session. It wasn’t just the S&P 500. Since the close yesterday, companies representing more than 20% of the Dow reported earnings, but the main drivers weren’t Microsoft (MSFT) or Amazon.com (AMZN). These two companies represent a combined 8.7% of the index, but the big kahuna reporting in the Dow is Caterpillar (CAT). Because the Dow is price-weighted and CAT has a share price above $800 (second largest behind Goldman Sachs), it alone has a weighting of more than 10% in the index.
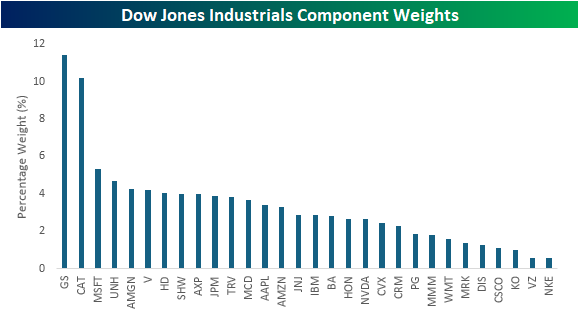
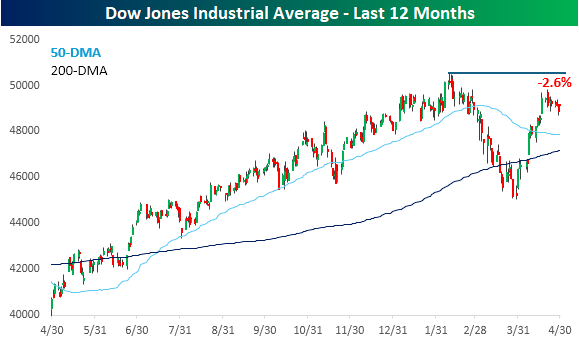
With shares of CAT trading up $48 in response to earnings, its gain will push the Dow higher by 300 points this morning. Combining that with the loss in MSFT and the gains in Amazon.com (AMZN) and Merck (MRK), these four companies will have a net positive impact of 320 points at the open. While that works out to a gain of over 0.6% for the index this morning, it still won’t be enough to push the Dow to new highs, as it would still be 2.6% below its record high from earlier in the year.
Start a two-week trial to Bespoke Premium to continue reading today’s full Morning Lineup.
The Closer – Hyperscaler Capex, FOMC, Crude Surplus – 4/29/26
Log-in here if you’re a member with access to the Closer.
- Hyperscaler capex continues to rise at an impressive rate of 80% YoY for the four mega-caps that reported earnings tonight.
- The FOMC rate decision had four dissents, an unusual level of discord not seen since 1992.
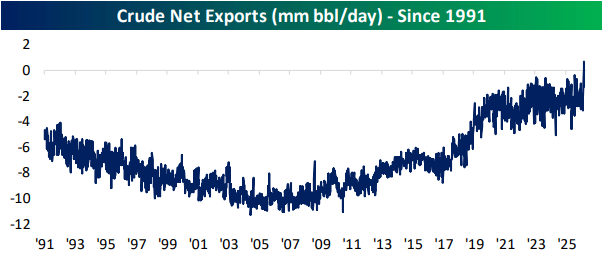
- There was a surplus in crude net exports for the first time on record last week.
See today’s full post-market Closer and everything else Bespoke publishes by starting a 14-day trial to Bespoke Institutional today!