The Closer – Inline CPI, Commodities and Recession, SPR – 3/11/26
Log-in here if you’re a member with access to the Closer.
- CPI came in right in line with expectations in February as deceleration in supercore services acts as a major factor.
- As the IEA announces release of emergency stockpiles, US strategic petroleum reserves are hardly recovered from massive drawdowns following the invasion of Ukraine.
- Retail investor sentiment experienced one of the largest monthly increases on record in February.

See today’s full post-market Closer and everything else Bespoke publishes by starting a 14-day trial to Bespoke Institutional today!
Q1 2026 Earnings Conference Call Recaps: Oracle (ORCL)
Bespoke’s Conference Call Recaps use AI to summarize lengthy earnings calls. The commentary below is AI-generated and then edited by Bespoke for quality control. As always, none of these summaries should be construed as recommendations to buy or sell any securities, and investors should do their own research and/or consult with a financial professional before making any investment decisions.
Our latest recap available to Bespoke subscribers covers Oracle’s (ORCL) Q3 2026 earnings call.
![]()
Oracle (ORCL) develops enterprise software, databases, and cloud infrastructure used by companies and governments to run core operations like finance, HR, supply chains, banking systems, and healthcare records. Its flagship technologies include the Oracle Database, Fusion ERP/HCM applications, and Oracle Cloud Infrastructure (OCI), which competes with hyperscalers in AI computing and cloud services. Oracle’s Q3 fiscal 2026 call centered on explosive growth tied to AI and cloud adoption. Multicloud database revenue surged 531% YoY, while AI infrastructure grew 243%, with management saying demand for GPU and CPU compute still exceeds supply. The company has secured 10+ gigawatts of future data-center power capacity and signed $29B in new infrastructure contracts, while its remaining performance obligations climbed to $553B. Oracle is embedding AI directly into enterprise software, with 1,000+ AI agents already inside its applications, and executives argued AI will strengthen, not replace, large enterprise SaaS platforms. A major push is also underway to run Oracle databases across Microsoft Azure, Google Cloud, and AWS, accelerating cloud migrations as companies move sensitive data to environments where it can be used with AI. ORCL shares rose as much as 12.5% on 3/11 after posting better-than-expected results…
Continue reading our Conference Call Recap for ORCL by becoming a Bespoke Institutional subscriber. You can sign up for Bespoke Institutional now and receive a 14-day trial to read our newest Conference Call Recap. To sign up, choose either the monthly or annual checkout link below:
Q4 2025 Earnings Conference Call Recaps: AeroVironment (AVAV)
Bespoke’s Conference Call Recaps use AI to summarize lengthy earnings calls. The commentary below is AI-generated and then edited by Bespoke for quality control. As always, none of these summaries should be construed as recommendations to buy or sell any securities, and investors should do their own research and/or consult with a financial professional before making any investment decisions.
Our latest recap available to Bespoke subscribers covers AeroVironment’s (AVAV) Q3 2026 earnings call.

AeroVironment (AVAV) is a US defense technology company that develops autonomous drones, loitering munitions, counter-drone systems, directed-energy weapons, and space communications technologies for the US military and allied nations. Its portfolio includes battlefield-proven systems like the Switchblade loitering munition, Puma and Jump reconnaissance drones, Titan RF counter-UAS (Uncrewed Aircraft System) jammers, and the LOCUST directed-energy anti-drone system. AVAV reported a mixed quarter, with results missing expectations due to government funding delays, supply-chain shipping issues, and the termination of the Space Force’s SCAR (Satellite Communication Augmentation Resource) program. Despite the short-term setback, management emphasized strong underlying demand, pointing to $1.1B in funded backlog and $4.6B in year-to-date awards, and guided for record Q4 revenue with FY26 sales expected between $1.85B–$1.95B. The company is ramping production aggressively, including a new 140,000-sq-ft Utah factory capable of producing $2B of systems annually, to meet surging demand for Switchblade drones, Titan counter-UAS systems, and reconnaissance platforms. Management repeatedly linked demand growth to current geopolitical tensions, noting that conflicts involving large-scale drone warfare, including Iran’s regional attacks, are accelerating global military demand for both offensive drones and defensive counter-drone systems. Shares fell as much as 10% on 3/11…
Continue reading our Conference Call Recap for AVAV by becoming a Bespoke Institutional subscriber. You can sign up for Bespoke Institutional now and receive a 14-day trial to read our newest Conference Call Recap. To sign up, choose either the monthly or annual checkout link below:
Daily Sector Snapshot — 3/11/26
Chart of the Day – Staples Swings
Bespoke’s Morning Lineup – 3/11/26 – Here Comes CPI
See what’s driving market performance around the world in today’s Morning Lineup. Bespoke’s Morning Lineup is the best way to start your trading day. Read it now by starting a two-week trial to Bespoke Premium. CLICK HERE to learn more and start your trial.
“I attack ideas. I don’t attack people. Some very good people have some very bad ideas.” – Antonin Scalia

Below is a snippet of commentary from today’s Morning Lineup. Start a two-week trial to Bespoke Premium to view the full report.
Paul Hickey will be on CNBC at 11 AM Eastern to discuss markets and today’s CPI.
Futures were in a holding pattern ahead of today’s CPI, with the S&P 500 and Nasdaq both indicated to open down about 0.1% despite Oracle (ORCL) trading up over 10% in reaction to earnings. Treasury yields moved higher ahead of the report, with the 10-year yielding 4.17%, and crude oil was up over 4% to $87 per barrel. Gold and Bitcoin prices are down about 1%.
For Asian equities, the last several days have been something of an all-or-nothing trade where the major averages in the region are either all sharply higher or lower. Last night, there was more dispersion. While Japan and South Korea were both up 1.4%, Hong Kong was fractionally lower, and India declined 1.7%. In South Korea, exports for the first 10 days of March were up 55.6% y/y, with chip exports surging more than 175%. In Japan, PPI fell 0.1% versus expectations for an increase of 0.1%.
In Europe, the move was more uniform, and unfortunately for bulls, it was mostly lower. The STOXX 600 is down nearly 0.5%, with Germany leading the losses with a decline of nearly 1% as German CPI for February rose 0.2%, which was right in line with forecasts.
In the US, the only economic report on the calendar today is February CPI, which given the events of the last two weeks, has become much less pertinent to the market. While it may not be a major focus of the market this morning, CPI was right in line with expectations as headline increased 0.3% m/m and core increased 0.2%
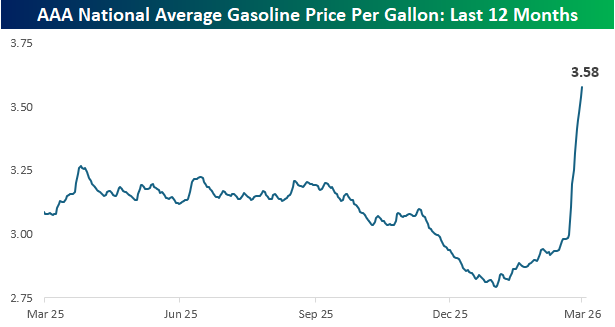
Through yesterday’s close, average prices at the pump have now surged to $3.58 per gallon, which represents a 20% increase this month alone. In the span of two months, prices have spiked from a 52-week and multi-year low to a 52-week high, easily surpassing the prior peak from last spring.
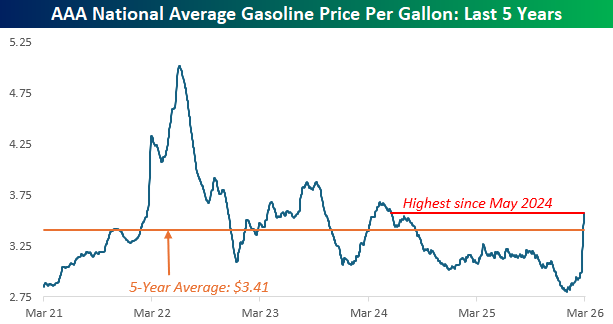
As shocking as the one-year chart looks, taking a longer-term look at crude oil prices shows a less dire picture. Current gasoline prices are now at the highest level since May 2024, but they’re still nearly 30% below the 5-year peak from June 2022, and less than 5% above the 5-year average. That doesn’t make it any easier to stomach, but at least it provides some decent perspective.
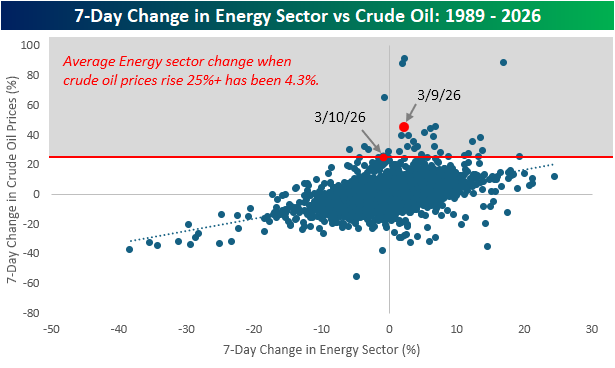
In the seven trading days since the war on Iran started, crude oil prices are up 25%, and as of yesterday, the seven -day change was over 45%. With such large increases, it seems like a disconnect that the S&P 500 Energy sector is up just 2%. The chart below compares the 7-day change in the S&P 500 Energy sector to the 7-day change in crude oil prices. While there has historically been a positive correlation between the two, in periods when crude oil prices have spiked 25% or more, the average change in the Energy sector has been a gain of 4.3%. The implication of those muted gains? The market views these price spikes as temporary.
The Closer – Big Bond Sale, BDC, Housing – 3/10/26
Log-in here if you’re a member with access to the Closer.
- Amazon (AMZN) is the latest IG borrower to tap the bond market for capital for data centers, and today’s tranche ranked as the fourth-largest IG bond sale ever..
- Business development companies have gotten crushed over the past year resulting in some high yields and extreme valuations.
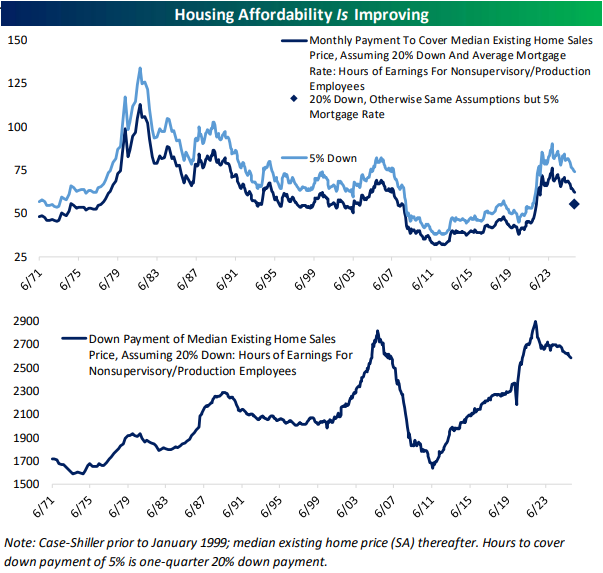
- Falling mortgage rates, little changing home prices, and and steady wage growth have benefitted housing affordability.
See today’s full post-market Closer and everything else Bespoke publishes by starting a 14-day trial to Bespoke Institutional today!
Daily Sector Snapshot — 3/10/26
Q4 2025 Earnings Conference Call Recaps: Kohl’s (KSS)
Bespoke’s Conference Call Recaps use AI to summarize lengthy earnings calls. The commentary below is AI-generated and then edited by Bespoke for quality control. As always, none of these summaries should be construed as recommendations to buy or sell any securities, and investors should do their own research and/or consult with a financial professional before making any investment decisions.
Our latest recap available to Bespoke subscribers covers Kohl’s (KSS) Q4 2025 earnings call.
![]()
Kohl’s (KSS) is a US department store chain with roughly 1,150 locations that sells apparel, footwear, home goods, beauty, and accessories, targeting primarily low- to middle-income households. The retailer blends national brands with a large portfolio of proprietary labels (Sonoma, LC Lauren Conrad, Tek Gear, Jumping Beans) and has leaned heavily on its Sephora at Kohl’s shop-in-shop partnership to attract younger shoppers and drive traffic. Kohl’s is a useful barometer for value-oriented discretionary spending in the US. The company reported a difficult but stabilizing quarter as comparable sales fell 2.8% and net sales declined 3.9%, though EPS of $1.07 benefited from tight inventory control and expense cuts. Management attributed weak traffic largely to financially strained value consumers and admitted missteps in fall seasonal inventory allocation and insufficient promotional intensity during key holiday periods like Black Friday and Cyber Monday. The turnaround strategy centers on restoring proprietary brands, sharpening price points (including more $10-and-under items), improving “trip assurance” by increasing inventory depth, and driving traffic through Sephora, impulse merchandising, and digital improvements. Digital sales rose low single digits, but conversion remains an issue. Guidance for 2026 calls for comps between down 2% and flat with EPS of $1.00–$1.60, reflecting cautious expectations as lower-income shoppers remain pressured by macro conditions. KSS reported a revenue miss on stronger EPS, as the stock rose as much as 11% on 3/10, but completely erased those gains intraday…
Continue reading our Conference Call Recap for KSS by becoming a Bespoke Institutional subscriber. You can sign up for Bespoke Institutional now and receive a 14-day trial to read our newest Conference Call Recap. To sign up, choose either the monthly or annual checkout link below:
Q4 2025 Earnings Conference Call Recaps: Vail Resorts (MTN)
Bespoke’s Conference Call Recaps use AI to summarize lengthy earnings calls. The commentary below is AI-generated and then edited by Bespoke for quality control. As always, none of these summaries should be construed as recommendations to buy or sell any securities, and investors should do their own research and/or consult with a financial professional before making any investment decisions.
Our latest recap available to Bespoke subscribers covers Vail Resorts’ (MTN) Q2 2026 earnings call.
![]()
Vail Resorts (MTN) operates some of the world’s largest ski destinations, including Vail, Breckenridge, Park City, and Whistler, while also running lodging, ski schools, rentals, and retail tied to mountain tourism. Its Epic Pass subscription model has changed the ski industry by locking in demand months before the winter season, with passholders now representing roughly 75% of visits. The company provides insight into premium leisure travel, weather sensitivity in outdoor recreation, and consumer willingness to prepay for experiences. Management described the season as the worst Rockies weather environment in company history, with snowfall down 43% YoY and February temperatures 9°F above average, limiting terrain openings to 70–80% of acreage at some resorts. As a result, visitation was down 13%, revenue was down 5%, and resort EBITDA was down 8%. Despite the disruption, the Epic Pass model helped stabilize results. Pass sales were up 3% entering the season, softening the revenue decline even as skier visits fell 12% season-to-date. Vail is responding with more targeted pricing and marketing, including a 20% pass discount for ages 13–30 and new lift-ticket products like Epic Friends and advance-purchase tickets. MTN shares fell 5.4% at the open on 3/10 after posting EPS and revenue misses, but the stock erased the loss intraday and was in positive territory an hour into the trading session…
Continue reading our Conference Call Recap for MTN by becoming a Bespoke Institutional subscriber. You can sign up for Bespoke Institutional now and receive a 14-day trial to read our newest Conference Call Recap. To sign up, choose either the monthly or annual checkout link below: