Chart of the Day: #$@&%* Taxes!
US Economic Indicators — Which Ones Beat or Miss the Most Often?
Our Economic Indicators database is one of the diamonds in the rough of our Bespoke Institutional offering. This interactive online database contains actual and estimated numbers for every single major US economic release going back more than 20 years. If you ever want to do economic analysis and need historical data, this is a very easy place to get it. You can find the database at our new Tools page shown in the image below. (Must be a Bespoke Institutional member to access. Start a two-week free trial now.)

In our Economic Indicators database, we show how often each indicator comes in either stronger or weaker than expected versus consensus economist estimates along with how the market and individual sectors reacted to each report. What’s also different about this database is that rather than show the revised readings for each economic report, we show the actual reading at the time of the release. This helps to see how the market reacted to the data presented rather than a reading that was revised a number of times.
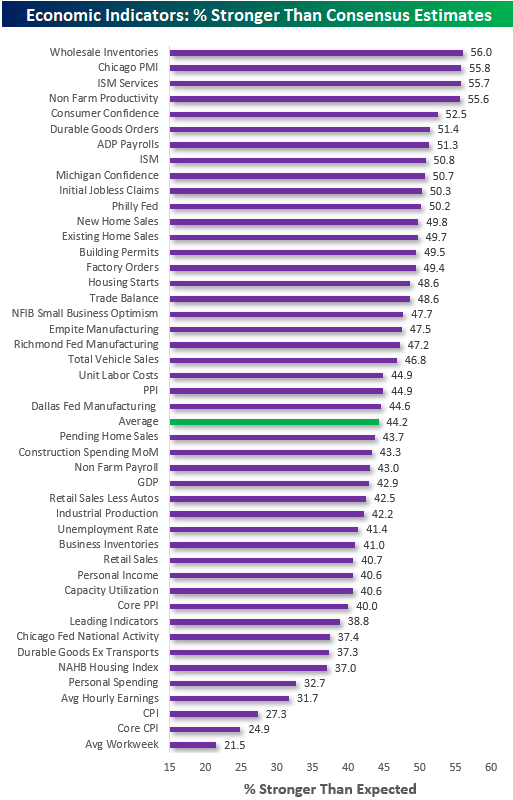
Below is a chart showing the percentage of the time that each of the US economic releases has come in stronger than expected over the last 20 years. Of the 45 indicators that we track, only 11 come in stronger than expected more than 50% of the time. The economic releases with the strongest beat rates are Wholesale Inventories, Chicago PMI, ISM Services, and Non Farm Productivity.
The average “beat rate” for all US economic releases is 44.2%. The indicators that come in stronger than expected the least often are the NAHB Housing survey, Personal Spending, Average Hourly Earnings, CPI, Core CPI, and the Average Workweek. In the case of the CPI inflation reading, not having a strong “beat rate” can actually be considered a good thing!
On the flip side, below is a chart showing how often each economic release comes in weaker than expected. At the top of the list is the Chicago Fed reading that has come in weaker than expected 61.6% of the time over the last 20 years. Notably, the monthly Non-Farm Payrolls report (the most widely followed jobs report each month) ranks second with a “miss rate” of 57%. Durable Goods ex Transports, Dallas Fed, and Pending Home Sales round out the top five.
The average “miss rate” for all economic releases is 45.3%. With an average miss rate of 45.3% and an average beat rate of 44.2%, the remaining 11.5% of reports have come in “inline” with expectations.

Start a two-week free trial to Bespoke Institutional to access our economic indicators database and everything else we have to offer.
This Week’s Economic Indicators – 4/15/19
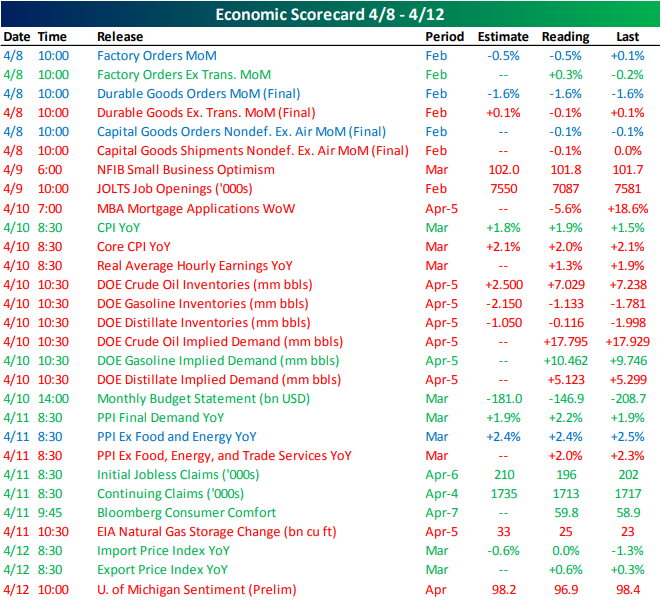
Last week was mixed in economic data with some bias towards weaker data points. Factory orders kicked off the week showing a decline inline with expectations. Durable goods and capital goods similarly came in with declines across the board. Tuesday saw misses in both NFIB Small Business Optimism and the JOLTS report while MBA mortgage applications also declined after a couple of strong weeks in a row. Wednesday’s headline CPI beat estimates, but the core measure which controls for volatility in prices like oil, missed forecasts by 0.1%. PPI inflation came in later in the week with a beat in the headline number, but a decline from the previous period in both core measures. Staying on the topic of oil, EIA data on Wednesday showed a second week of crude inventory builds over 7 mm bls, but also showed strong gasoline demand and inventory draws. Preliminary readings for April University of Michigan Sentiment capped off the week with a decline to 96.9 versus the forecasted drop of only 0.2.
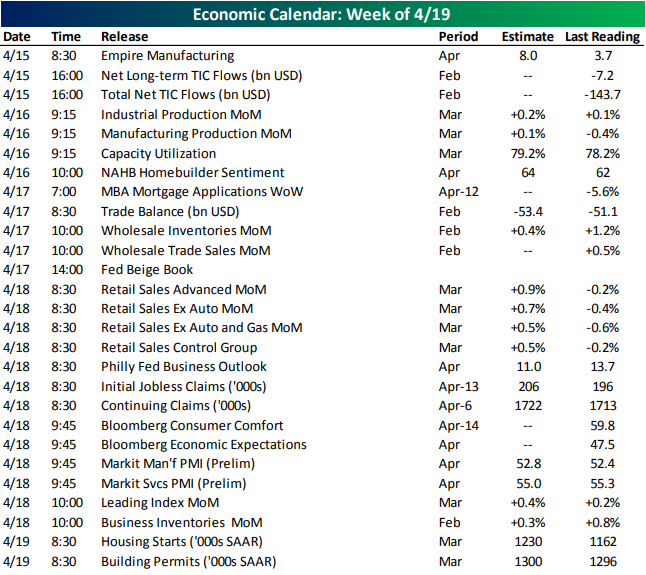
It’s going to be a pretty boring start to the week with Empire Manufacturing and Treasury flows the only releases to note today. Empire Manufacturing came in above estimates at 10.1 earlier this morning. That is also handily above the March print. More manufacturing data will be released tomorrow with Industrial and Manufacturing Production for March. Homebuilder sentiment for April will also be out Tuesday, expecting to rise to 64 from 62 in March. The Trade Balance for February will come out on Wednesday along with the Fed’s Beige Book later on in the afternoon. Thursday will be a particularly busy day with 13 releases scattered throughout the morning. We will hopefully get a better picture on retail sales which has been very volatile this year with March data coming out Tuesday. Month-over-month increases are expected across the board. In manufacturing data, Philly Fed Outlook will be out alongside the Market Flash PMIs for April. The service counterpart will also be released. While markets will be closed for Good Friday, the Federal Government will still be open and releasing data as we will get Housing Starts and Permits. Both are forecasted to show improvements from the February prints.
Use our Economic Monitorsto stay up to date on daily economic releases.
Start a two-week free trial to Bespoke Premium to access our interactive economic indicators monitor and much more.
Trend Analyzer – 4/15/19 – Mid Caps Extended
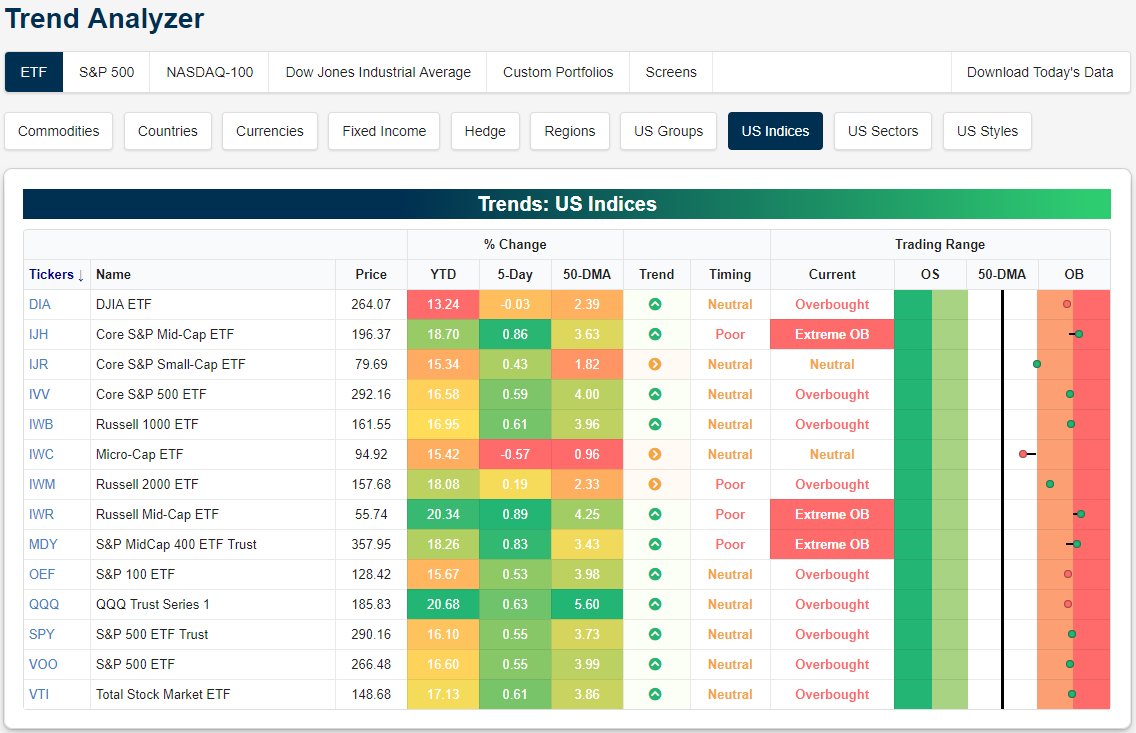
Last week was fairly positive for equities. As shown below, all but two of the major US index ETFs we track with our Trend Analyzer tool were up on the week. Given overbought/oversold levels, it makes sense that the indices did not rocket higher. Things have gotten pretty overbought across the board, especially for mid-caps. Twelve of the fourteen major index ETFs are now overbought with each of the Mid Cap ETFs (IJH, IWR, and MDY) all at extreme levels. These ETFs also outperformed their peers last week. Large and small-caps are on the verge of also becoming extremely overbought. Only the Core S&P Small Cap (IJR) and Micro-Cap (IWC) have been lagging behind and are still neutral, granted IJR is on the border of moving into overbought.
Start a two-week free trial to Bespoke Premium to access our interactive Trend Analyzer tool and much more.
Morning Lineup – All is Not Wells
We’ve just published today’s Morning Lineup featuring all the news and market indicators you need to know ahead of the trading day. To view the full Morning Lineup, start a two-week free trial to Bespoke Premium.

Here’s a snippet from today’s report:
Happy Tax Day! If you have been busy this morning writing out checks to Uncle Sam or grumbling that your refund isn’t as high as you thought it would be, don’t worry about missing a whole lot in the market as things have been pretty quiet so far. The only economic indicator of note today is Empire Manufacturing, and the pace of earnings doesn’t start to pick up until tomorrow.
Whether it was a kitchen sink quarter or not, last Friday’s earnings report from Wells Fargo (WFC) wasn’t received well by the street. After falling more than 2.5% on Friday, analysts had an entire weekend to think about and go over the results, and based on this morning’s research news, they didn’t like what they saw. As shown in the analyst upgrades and downgrades section of our Morning Lineup, Wells Fargo was downgraded this morning by no less than four different firms. Not exactly a ringing endorsement, but one could also make the argument that sentiment towards the stock has become skewed to the negative side.

Start a two-week free trial to Bespoke Premium to see today’s full Morning Lineup report. You’ll receive it in your inbox each morning an hour before the open to get your trading day started.
Bespoke Brunch Reads: 4/14/19
Welcome to Bespoke Brunch Reads — a linkfest of the favorite things we read over the past week. The links are mostly market related, but there are some other interesting subjects covered as well. We hope you enjoy the food for thought as a supplement to the research we provide you during the week.
While you’re here, join Bespoke Premium for 3 months for just $95 with our 2019 Annual Outlook special offer.
Economics
The Effects of Minimum Wages on Low-Wage Jobs by Doruk Cengiz, Arindrajit Dube, Atilla Lindner, and Ben Zipperer (Dropbox)
This paper does a comprehensive examination of state-level minimum wage changes between 1979 and 2016. The results show across the data set low-wage jobs remain unchanged in the five years following the increase, with wages going up in slightly higher earnings brackets. They argue that substitution to other labor does not explain the lack of job losses, and they find no evidence of less employment thanks to minimum wage increases (though tradable sectors may have some impact). This is a unique study for its breadth and scale and focuses on describing what actually happened instead of creating a model for it. [Link; 128 page PDF]
In Search of Labor Demand by Paul Beaudry, David A. Green, and Ben M. Sand (American Economic Review)
This recent paper seeks to specify a labor demand function and then extrapolate the effects of minimum wages that labor demand function would imply; it predicts sizeable minimum wage effects, in contrast to the observations of the prior paper. [Link; 44 page PDF]
Forests
Conflicting Data: How Fast Is the World Losing its Forests? by Fred Pearce (Yale Environment 360)
A discussion of the two different databases which track the loss of forests each year, and how scientists are trying to improve them in order to get a better grip on drivers of and possible responses to deforestation around the world. [Link]
These tree-planting drones are firing seed missiles to restore the world’s forests by Adele Peters (Fast Company)
New tools are being used to improve forest coverage, including drones which can cheaply cover remote areas with seed bundles. [Link]
Dogs
Dog Runs Grueling Desert Ultramarathon Just For Fun by Patrick Redford (Deadspin)
A Moroccan pooch liked the cut of some ultramarathoners’ jibs and decided to stick around, eventually running over 100 miles and receiving an official finisher’s medal. [Link]
Pit bull grabs baby by diaper, saves her from fire (ABC 13)
While pit bulls that haven’t been properly cared for have very negative reputations and can be dangerous without proper training, the breed’s original use as “nanny dogs” makes a lot more sense after you’ve read this story. [Link; auto-playing video]
Youths
Forget real estate — ‘art flipping’ is the latest way rich millennials are building wealth, and it’s an investment baby boomers largely ignored by Hillary Hoffower (Business Insider)
Millennials with high net worth are more apt to invest in art than prior generations and are twice as likely to view art as a financial asset than prior generations. [Link]
College Grads Sell Stakes in Themselves to Wall Street by Claire Boston (Bloomberg)
Instead of fixed-payment debt that amortizes over time, some college grads are selling a percentage of their future earnings to finance their educations. [Link; soft paywall]
Weird Health
Crude oil touted as health cure in Azerbaijan by Andrea Palasciano (AFP/Yahoo!)
People are travelling from all over Central Asia to bathe in crude oil, with spas claiming it has palliative effects for joint pain. [Link]
Astronauts Can Withstand Longer Space Trips, New Study of Twins Finds by Robert Lee Hotz (WSJ)
Astronaut Scott Kelly spent almost an entire year in space, and scientists are now studying differences in his physiology relative to his twin brother Mark in order to tease out the effects of long trips to space. [Link; paywall]
Back In The Day
Failing New York Subway? Not Always — Once There Were Chandeliers by Winnie Hu (NYT)
In 1904, the first New York City subway station featured chandeliers, skylights, high arches, and terra-cotta tiles; while some parts of the transit system are plenty opulent (looking at you, Oculus) it’s a far cry from the modern spartan transit system. [Link; soft paywall]
Edison as I know him by Henry Ford (University of Michigan Digital Collection)
A remarkable anecdote about the encouragement the Model T inventor received from Thomas Edison when he was first showed the internal combustion engine. [Link]
Rabbit Holes
Are we living in a simulation? This MIT scientist says it’s more likely than not by Dyllan Furness (Digital Trends)
Don’t look now, but our collective consciousness may be a figment of a computer program. This interview discusses the theory, or at least, its return to popular focus. [Link]
Federalism
Civil Rights, the War on Poverty, and Black-White Convergence in Infant Mortality in the Rural South and Mississippi by Douglas Almond, Kenneth Y. Chay, and Michael Greenstone (SSRN)
This study evaluates the impact of forced integration of hospitals in the South (thanks to requirements of the 1964 Civil Rights Act) on child mortality. Effects work out to saving more than 25,000 infants from 1965 to 2002 alone. [Link]
Restaurants
Red Robin’s Lesson: Cut Labor At Your Own Risk by Jonathan Maze (Restaurant Business)
When executives tried slashing staffing at Red Robin, they saved on labor costs…but same store sales started to plunge as consumers shied away from the lower-service offering. [Link]
Anthropology
New species of ancient human discovered in Philippines cave by Hannah Devlin (The Guardian)
This week the broader human family added Home luzonensis, a species dating to 50,000-67,000 years ago. A skeleton was discovered in the Callao cave on Luzon, in the Philippines. [Link]
Malfeasance
Congress Is About to Ban the Government From Offering Free Online Tax Filing. Thank TurboTax. by Justin Elliott (ProPublica)
Tax preparation software companies have helped write legislation that would ban the IRS from creating an alternative, free system that would make their business models obsolete. [Link]
‘She lies to everyone’: Feds say Mar-a-Lago intruder had hidden-camera detector in hotel by Jay Weaver, Sarah Blaskey, Caitlin Ostroff, and Nicholas Nehamas (Miami Herald)
This week a federal prosecutor argued a Chinese citizen arrested for trying to enter the President’s private club in Florida had extensive counter-surveillance equipment and a stash of USB drives with malware. [Link]
Gun Violence
“When Does It Get Back To Normal? It Doesn’t”: Columbine’s Former Principal Calls His Peers After School Shootings To Counsel Them by Amber Jamieson (BuzzFeed)
Since mass shootings at schools exploded into the national consciousness following the massacre at Columbine High School in 1999, the school’s principal has called the principal of every school impacted by a mass shooting in an effort to help school leaders work through the tragedies. [Link]
Read Bespoke’s most actionable market research by joining Bespoke Premium today! Get started here.
Have a great weekend!
The Bespoke Report — 4/12/19 — Dracarys!
Investors have a lot going on this weekend, whether it’s gearing up for “a tradition unlike any other” at The Masters, the final season premiere of Game of Thrones, or finishing up 2018 tax returns that are due Monday. We’ll be focused on all three!
Before taking a break for the weekend, though, there’s plenty of market-related content to get to, so sign up for a two-week free trial to one of our three membership levels and read our just-published Bespoke Report newsletter.
In this week’s report, we cover new highs for the S&P 500 total return index, the upcoming earnings reporting period, an uptick in Q1 GDP growth expectations, hot international equity markets, and more.

The Closer: End of Week Charts — 4/12/19
Looking for deeper insight on global markets and economics? In tonight’s Closer sent to Bespoke clients, we recap weekly price action in major asset classes, update economic surprise index data for major economies, chart the weekly Commitment of Traders report from the CFTC, and provide our normal nightly update on ETF performance, volume and price movers, and the Bespoke Market Timing Model. We also take a look at the trend in various developed market FX markets.

The Closer is one of our most popular reports, and you can sign up for a free trial below to see it!
See tonight’s Closer by starting a two-week free trial to Bespoke Institutional now!
Sector Charts – 4/12/19 – Communication Services
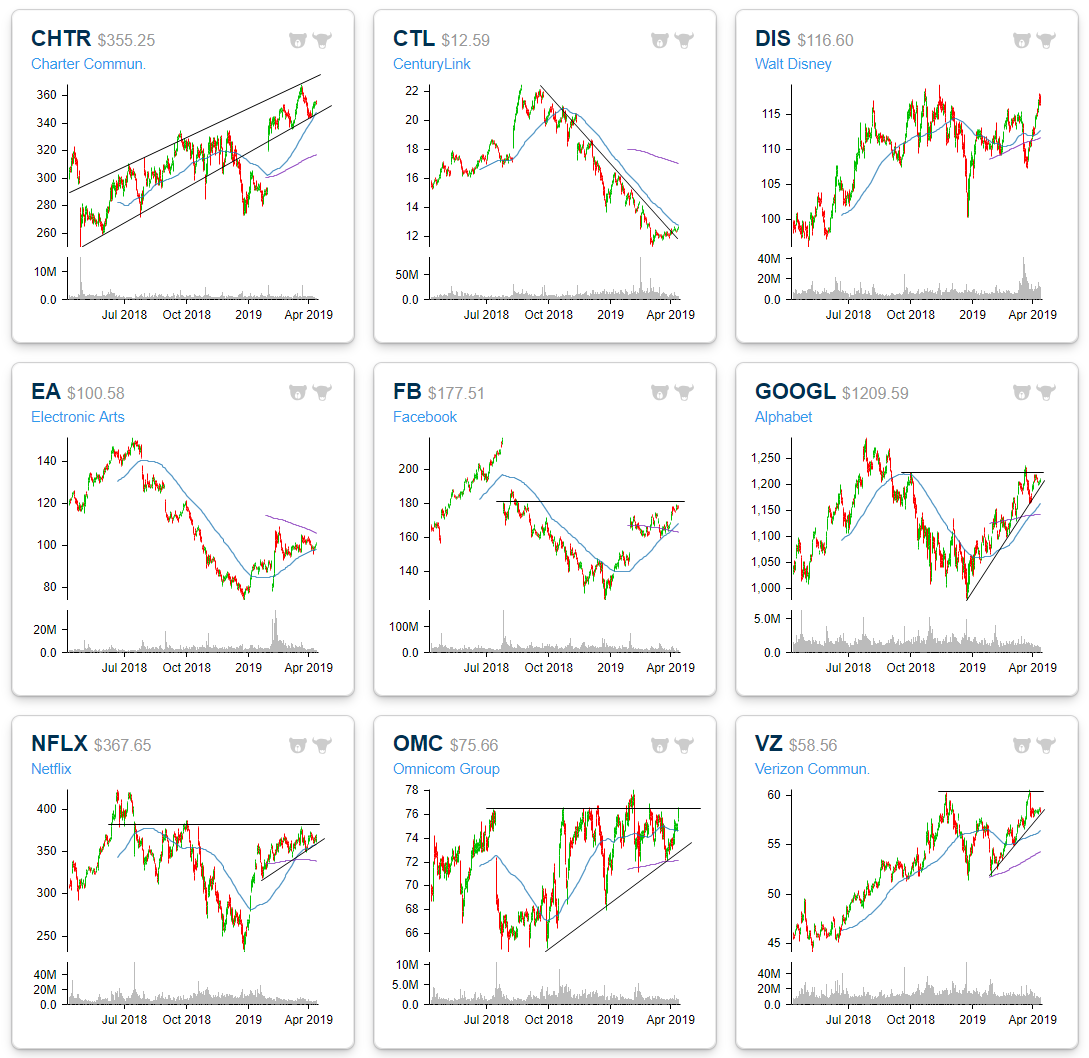
The Communication Services sector is currently one of the most overbought sectors, with the ETF (XLC) sitting over 2 standard deviations above its 50-DMA. Remember, this sector was introduced as a combination of the old Telecoms sector and some members of the Technology sector. Within the sector, several companies are setting up constructively near resistance despite the overbought levels of the index overall. Below we highlight some attractive names in the sector as well as some that are reaching pivotal points.
For starters, Charter Communications (CHTR) sold off hard in late 2018 after sitting in an uptrend for most of the year. After a strong earnings report in January, the stock gapped all the way back up into this uptrend channel and has continued to move within it ever since. More recently it has pulled back to find support at the bottom of this uptrend channel just above the 50-DMA and has begun to once again move higher. CHTR also has a good timing score in our Trend Analyzer tool. While CHTR’s been in a strong uptrend, CenturyLink (CTL) is looking to shake its downtrend from the past several months. After reaching highs in the late summer/early fall of last year, the stock sold off finding a bottom in early March of this year. This recent leg higher has brought it through this downtrend line, and in the past few days, right up to the 50-DMA. Granted, the stock is down big today (over 3% as of this writing) erasing the past week’s gains and failing this test of the 50-DMA. That technical development is not promising. Given that it is hard to eagerly jump on the bullish side for the stock as CTL also has had weak fundamentals for some time now. On the other hand, a rebound taking out the moving average could be sign as a bullish indicator. We would typically wait for at least a couple of “higher highs” and “lower lows” before declaring the start of a new uptrend.
Major video game publisher Electronic Arts (EA) is also seeing an interesting setup. The stock fell out of favor in 2018 but gained strength so far this year. A declining 200-DMA and rising 50-DMA have been converging with price consolidating between the two. Similarly, a move above the 200-day would be a good sign for the stock. Like CHTR, EA also has good timing in our Trend Analyzer.
Three-quarters of FANG also belong to this sector. Each one has been in a solid uptrend so far in 2019, but are now fairly overbought. Social media giant Facebook (FB) is the best example. It is one of only three stocks in the entire sector to do be more than two standard deviations above its 50-DMA. FB, NFLX, and GOOGL are also all running up to resistance from highs before the Q4 sell-off. While the overbought indicates an increased likely hood of some bias to the downside, taking out these resistance levels would certainly be a sign of health for this year’s uptrends to continue.
Omnicom (OMC) has recently bounced off of the 200-DMA and is now sitting at the upper end of the range it has traded within for the past year. At the same time, the stock has been making a series of higher lows which is a promising sign that it could finally break out of higher.
Finally, turning to Verizon (VZ), a couple of weeks ago the stock failed a test of 52-week highs. This comes after bouncing off of support just above $52. After pulling back, the stock has found support at its uptrend line and has traded along it all week. If this uptrend continues, another test of those highs could be a very promising sign.
Taken from our Chart Scanner tool, we show the charts of these stocks below.
Sign up now for a free trial and instantly unlock access to our new Interactive tools, including the Chart Scanner and Earnings Explorer!
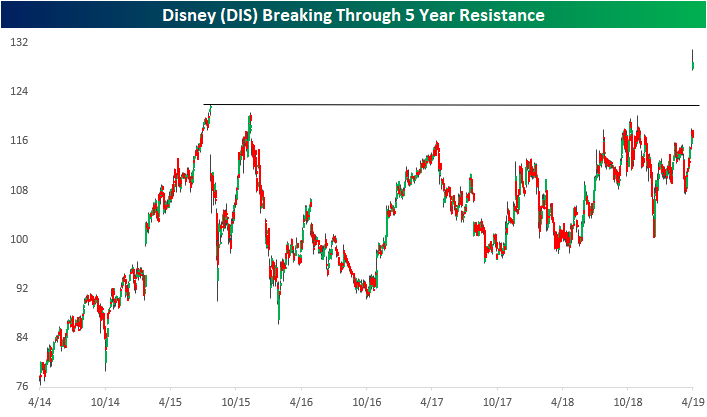
Delving into Disney (DIS), today’s surge in response to its announcement of the pricing of the company’s new streaming service has brought the stock up to an interesting level. For the past five years, DIS has been unable to retake highs near $120 set back in early August of 2015. While it has come within several dollars of these highs a couple of times in October of 2015 and 2018, the stock has more or less been stuck in a range if not a very slight uptrend in this time. Now at all time highs by a fairly wide margin, DIS will be an interesting stock to watch; and if today’s gap is to get filled at any point in the future, that prior resistance will be a critical place to watch.
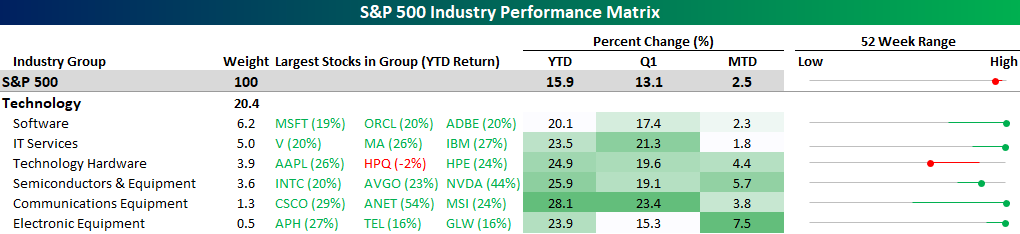
Tech Sizzles
The graphic below summarizes the performance of the six different industries that comprise the Technology sector and shows each one’s weighting in the S&P 500, how the largest stocks in each industry have performed YTD, how each one has performed over various time frames, and then where each industry is currently trading with respect to its 52-week range. In each line chart on the right, the circle shows where the industry is trading now relative to its 52-week range, while the tail shows where the industry was trading as of 9/20/18 when the S&P 500 peaked.
For the Technolgy sector, performance has been on fire this year. All six of the sector’s industries are outperforming the S&P 500 YTD with gains of over 20%. MTD performance is nearly as impressive with all but two industries outperforming. So far in April, both Electronic Equipment and Semis have already seen gains of more than twice the S&P 500. In the Electronic Equipment industry, Amphenol’s (APH) 27% YTD gain has been a key driver, while in the semis Nvidia (NVDA) is up 44% YTD! The most impressive performance of them all, though, has to be Apple (AAPL). 26% may not sound like much compared to NVDA’s 44% gain, but when you are the largest company in the world, 26% translates to an increase of $131 billion in market cap!
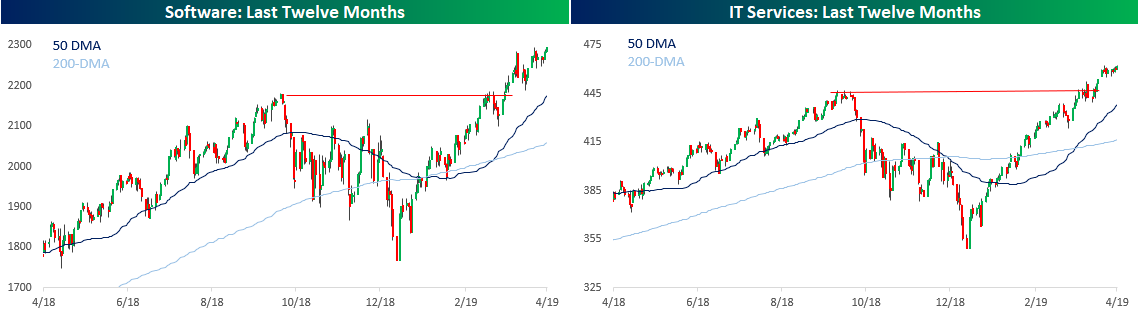
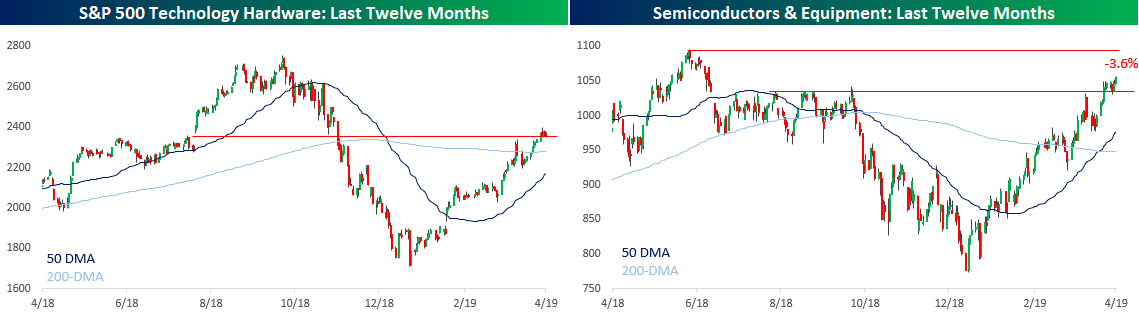
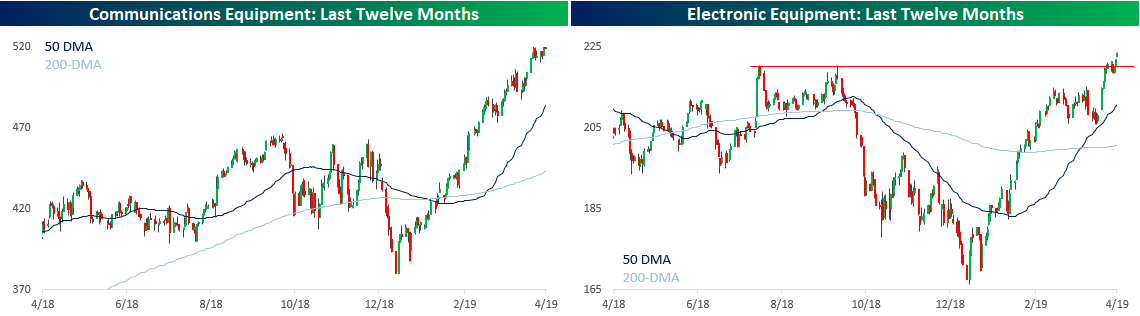
Finally, with such big gains for the industries in the sector YTD, most of them are not only above the level they traded at when the S&P 500 peaked in September, but they are also at new highs. The only one that has yet to trade above the level it was at in September is Technology Hardware, which has been weighed down by AAPL which despite its big gain this year is still down 10% from where it was trading on 9/20. The one drawback to Tech’s recent strength, though, is as the charts below illustrate, many of these industries have become extremely extended on a short term basis, which could make them more susceptible to at least a pause in their rallies. Like what you see? Start a two-week free trial to Bespoke Premium to access our insightful market research and much more.