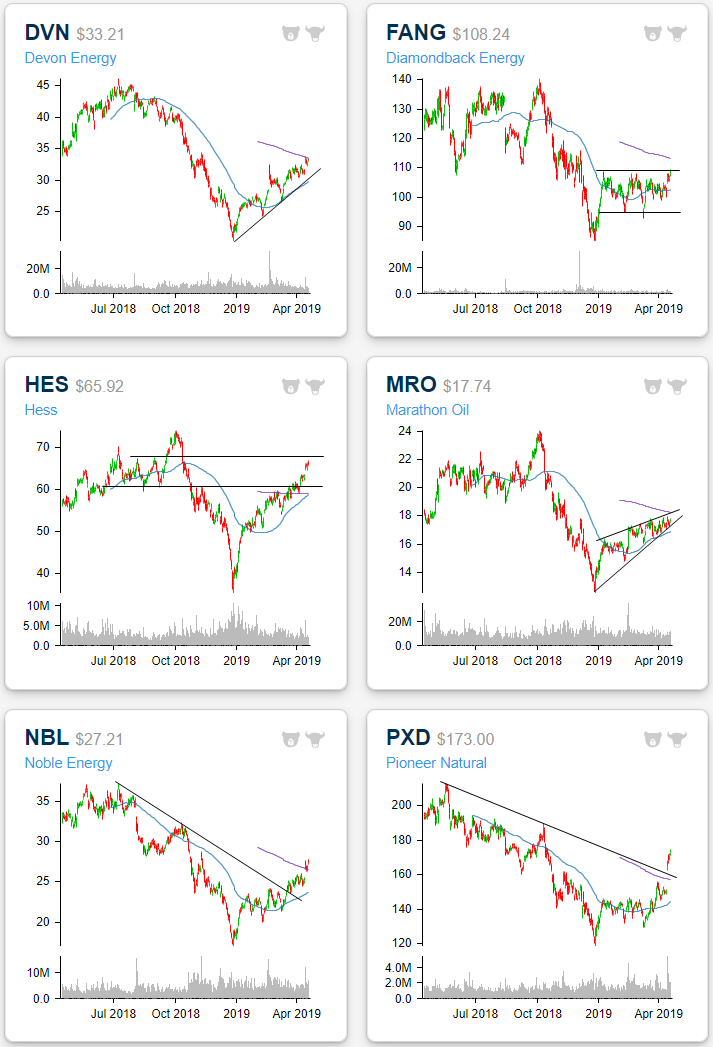
Sector Charts – 4/18/19 – Energy
Oil has surged all year as one of the best-performing asset classes, and the S&P 500 Energy sector has benefited from oil’s move with a year-to-date gain of nearly 18%. We highlight a few Energy sector stock charts below.
Similar to crude prices, Devon Energy (DVN) and Marathon Oil (MRO) have been in solid uptrends this year. DVN has now seen the third best YTD gains (47.73%) of the S&P 500 stocks in the sector, bringing it right up to the 200-DMA. In Thursday’s trading, it has made a move above the 200-day and is looking to close there. Marathon Oil (MRO) has also traded in a nice uptrend this year right between the 50-DMA and 200-DMA. The two moving averages are converging on each other, and price has been similarly trading in a tighter range though it has continued to make higher highs. As it continues in its uptrend, the 200-DMA will be a point to watch as it could break out as Hess (HES) and Helmerich & Payne (HP) did. Other stocks like Apache (APA), Chesapeake (CHK), EQT (EQT), and Phillips 66 (PSX) are showing similar patterns.
Hess (HES) has actually outperformed the entire sector and the commodities it deals in this year by a sizeable margin having now risen 63.45% YTD. After a rough end to 2018, this rebound has brought it right back towards the upper end of the range from last year. If it breaks through this resistance around $67, the next area to watch would be last year’s highs above $74.
Looking solely at Diamondback Energy (FANG), you would never be able to tell that oil has seen such a strong run this year. While it is up over 13% YTD, the stock has been trading sideways all year. But at its current levels, FANG is eying a break out above this consolidation and back to the levels it was at for much of 2018. Intraday over the past couple of sessions, the stock managed to push above YTD highs to the highest levels since early December. While FANG is overbought, a close above this range would be promising.
Noble Energy (NBL) has also outperformed oil so far this year with a 45.86% gain. The stock has been in a solid uptrend since the start of the year, breaking a long term downtrend line. More recently, the large gap up on last week’s news of Anadarko and Chevron’s merger has brought the stock above the 200-DMA for the first time since October. So far NBL has managed to hold above these levels. Similarly, Pioneer (PXD), which has been in a downtrend for the past year, got a solid boost to the technical picture following the news of the merger. For most of this year, the stock has been range bound, though, in late March it did begin to break above this range. The response to last week’s news led to a large gap up above the 200-DMA. More importantly, it is also now above that former downtrend line. Since then, the stock has yet to reject these new levels rallying over 6% in the past week.
Start a two-week free trial to Bespoke Premium to access our Chart Scanner, Trend Analyzer, and much more.
Individual Investors Remaining Neutral
Last week, bullish sentiment as indicated by the AAII’s weekly survey of individual investors came in at the second highest level of the year at 40.29%. Declines this week seemed to have weighed on bulls as the percentage of investors reporting as bullish fell to 37.56%. That is back below the historical average of 38.2%, though, it is also not far away from where bullish sentiment has stayed for much of the year. This week’s level deviates slightly from the Investors Intelligence survey which saw bearish sentiment unchanged while optimism rose to the highest levels since October.
Start a two-week free trial to Bespoke Institutional to access our Closer which includes our Market Timing Model which uses these sentiment indicators to forecast the market.

The bearish camp seems to have borrowed from the bulls as 21.83% of investors reported bearish sentiment versus 20.38% last week. This is a fairly small movement relative to what could be observed in the past couple of months. For example, last week and in the final week of March, bearish sentiment fell by over 7%. In other words, bearish sentiment seems stable around the lower end of the range from the past few years, now several percentage points below the historical average of 30.31%.

While bullish and bearish sentiment remains high and low, respectively, neutral sentiment is also very elevated. At 40.61%, the percentage of investors reporting neutral sentiment is now slightly over one standard deviation above the historical average. The last time this happened was in late July of last year.
B.I.G. Tips – Retail Sales: It’s About Time
Chart of the Day: Titan International (TWI)
Initial Jobless Claims Keeps Killing It
Just when you thought last week’s Initial Jobless Claims couldn’t get much better, this week’s release smashed estimates once again! Seasonally adjusted initial claims came in at the lowest reading since September of 1969 at 192K, well below estimates of 205K. That is the third week in a row where claims have come in below forecasts by at least 10K. That is something that has only happened two other times in the past decade; once in 2009 and again in 2014. Whereas this is the second straight week of sub-200K readings, it is also the 80th straight week of readings at or below 250K (the second best streak on record) and 215th below 300K (a record streak). Continuing Claims are mirroring strong initial claims coming in at their strongest level since October of last year.
Start a two-week free trial to Bespoke Premium to access our interactive economic indicators monitor and much more.
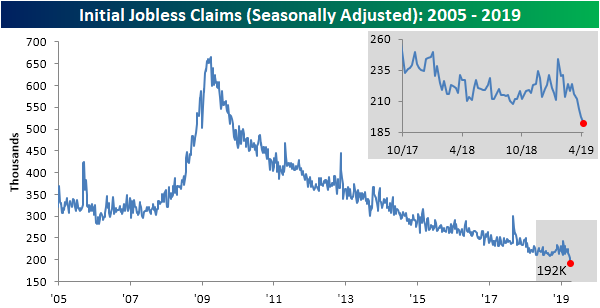
The four-week moving average has continued to fall coming in at 201.25K this week versus last week’s 207.25K. Both this week and last were new 52-week lows and lows for the cycle. That is something we have not seen since last September when we saw four weeks of 52-week lows in a row beginning on August 31st. This week’s number is also the lowest the moving average has been since 1969. Given these new lows, jobless claims data looks very strong and the prior highs seen earlier this year can more confidently be called a blip rather than a new trend.

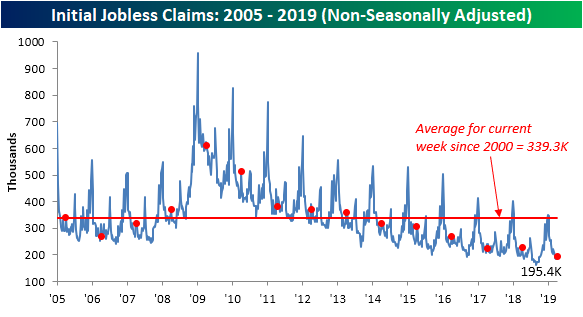
Turning to the non-seasonally adjusted data, claims fell by just over 1K down to 195.4K. This decline was to a much smaller degree than previous years for the current week of the year but is still the lowest for the current week of the year since 1969.
the Bespoke 50 — 4/18/19
Every Thursday, Bespoke publishes its “Bespoke 50” list of top growth stocks in the Russell 3,000. Our “Bespoke 50” portfolio is made up of the 50 stocks that fit a proprietary growth screen that we created a number of years ago. Since inception in early 2012, the “Bespoke 50” has beaten the S&P 500 by 102.9 percentage points. Through today, the “Bespoke 50” is up 213.1% since inception versus the S&P 500’s gain of 110.2%. Always remember, though, that past performance is no guarantee of future returns.
To view our “Bespoke 50” list of top growth stocks, please start a two-week free trial to either Bespoke Premium or Bespoke Institutional.

Trend Analyzer – 4/18/19 – Large Caps All Over
This morning there is one less overbought ETF bringing the total number of major index ETFs at neutral to three while the eleven others are overbought. Those that are overbought have fallen off of near extreme levels that we have seen over the past week as well. The ETF that has moved from overbought to neutral is the Russell 2000 (IWM) on a loss of 0.77% over the past week. Despite this loss, it now has a good timing score; the only one of the group that can boast this. IWM is not alone in sitting in the red on the week. The Russel Mid Cap (IWR), Core S&P Small Cap (IJR), and to a greater extent, the Micro-Cap (IWC) are all also down. IWC’s losses blow the others out of the water, shedding 1.93% over the past five days, bringing the year to date gain down to 13.61%, the second worst of the group behind the Dow (DIA). Large caps, in general, are a little all over the place. Ironically, while the large-cap Dow is up the least this year, over the past week it and the other large caps have outperformed.
Start a two-week free trial to Bespoke Premium to access our interactive Trend Analyzer tool and much more.

Turning to the individual sectors, like the large caps, things are a bit all over the place. Currently, there are four extremely overbought sector ETFs, four that are overbought, two neutral, and one that is extremely oversold. Financials (XLF) have surged over the past week rising 3.51% on the back of a string of strong earnings reports out of the big banks. While their gains have been more middling, Communication Services (XLC), Consumer Staples (XLP), and Consumer Discretionary (XLY) are the others that are sitting at extreme overbought levels. Over the past week, the Utilities sector (XLU) and Real Estate (XLRE) have seen losses, bringing both below their 50-DMAs. XLRE has been hit particularly hard and is now down 3.56% over the past five days. Believe it or not, this is still far from the worst performer. As we have repeatedly highlighted in the past week, Health Care (XLV) has been absolutely abysmal. Falling 6.53% since last Thursday, it is now negative on the year; the only ETF to be able to claim this by a wide margin. These declines have brought the sector to extremely oversold levels. So much so that it is basically off the chart of our Trend Analyzer.

Morning Lineup – A Flood of Data
Futures have turned a little higher this morning ahead of what is an absolute flood of economic data. Retail Sales, the Philly Fed, and Jobless Claims were just released, and the results were mostly better than expected with Retail Sales coming in better than expected, Jobless Claims dropping to an astonishingly low level of 192K, but the Philly Fed slightly missing consensus forecasts. There’s still a lot more data to contend with, though, as Markit Flash PMIs, Leading Indicators, and Business Inventories are still on the docket. Tomorrow is a holiday for the stock market in observance of Good Friday, but both Housing Starts and Building Permits will be released at 8:30. If you are off, enjoy the three day weekend.
We’ve just published today’s Morning Lineup featuring all the news and market indicators you need to know ahead of the trading day. To view the full Morning Lineup, start a two-week free trial to Bespoke Premium.

Here’s a snippet from today’s report:
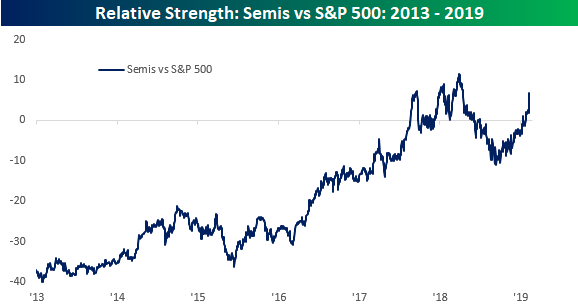
Following the recent settlement between Apple and Qualcomm (QCOM), we wanted to check up on the status of our comparison between the relative strength of semiconductors and the performance of the S&P 500. We have highlighted the leadership of semis numerous times in the last several weeks, and QCOM’s surge over the last two days has caused the group’s relative strength to soar to levels not far from last year’s high. As we have mentioned in the past, every major decline and rally of the last six years has been preceded by a move higher or lower in the relative strength of the semis. Emphasis is often placed on the importance of the transports in determining the direction of the market, but in recent years the semis have been a much better tell.
Start a two-week free trial to Bespoke Premium to see today’s full Morning Lineup report. You’ll receive it in your inbox each morning an hour before the open to get your trading day started.
The Closer — Health Care, Financial Conditions, HICP, Fund Flows, EIA — 4/17/19
Log-in here if you’re a member with access to the Closer.
Looking for deeper insight on markets? In tonight’s Closer sent to Bespoke Institutional clients, we begin by showing just how dramatic the health care sector’s underperformance has been. We also make note of the S&P 500’s 3rd straight gap up only to fall from open to close. We then show the loosening of financial conditions as indicated by the Chicago Fed’s data. Next, we see at how US inflation stacks up against European inflation by taking a look at US HICP data from Eurostat. Pivoting back to health care, we show the performance, estimated next twelve months EPS multiple, and EPS estimate revisions of the industries and sub industries. We finish with our weekly look at EIA and fund flow data.

See today’s post-market Closer and everything else Bespoke publishes by starting a 14-day free trial to Bespoke Institutional today!