The Fed is Not Alone
On Wednesday, while no change is anticipated, the FOMC’s rate decision and Fed Chair Powell’s subsequent presser are sure to be closely watched by markets. Investors will attempt to get a read on the Fed’s tone following some more positive shifts in economic data and equity markets since the beginning of the year. Over the next two weeks, the Fed is not alone though; like earnings and general economic data, it will also be busy on the central bank front.
On Thursday morning, the Bank of England and the Czech National Bank are also due out with rate decisions of their own. Similarly, neither of these two national banks are expected to make any adjustments in their policy rates. But with global risks like Brexit and a soft global backdrop at play, this expected no change is not a guarantee. For the Czech Republic, previous comments by the CNB seemed even slightly hawkish alluding to accelerating inflation making things a tad more difficult to leave rates where they have been. In APAC next Tuesday, we will also get decisions from the Reserve Bank of Australia and the Reserve Bank of New Zealand. Once again no change is expected for either country, but cuts are seen as more likely than hikes.
One week after the FOMC decision, the Central Bank of Brazil is expected to leave the Selic Rate unchanged as well in spite of dovish tones from the chief policymaker. Coming off of a hike to 1% in their last meeting, Norway’s Norgesbank will cap off next week in Central Bank meetings. Institutional members can always stay up to date with central bank tones and rate decisions with our Fedspeak Monitor and Central Bank Monitors. Start a two-week free trial to Bespoke Institutional to access our interactive Fedspeak and Global Central Bank monitor and much more.

Not Just a Busy Week of Earnings
It may be the busiest week of earnings season, but quarterly reports are not the only catalysts to watch. There is also a heavy slate on the US Economic Scorecard over the next week with 72 releases (including indicator releases, Treasury Auctions, and Federal Reserve member speeches) on the docket. You can always keep an eye on these releases using our Economic Monitors. For today, all of the data is now in with some disappointment. Personal Income and the PCE deflator both missed estimates earlier this morning while the Dallas Fed’s Manufacturing Activity index came in below expectations by the widest margin since September of 2011. Meanwhile, Personal Spending on both a real and nominal basis showed solid improvements while beating estimates. In fact, the nominal number was the strongest MoM print since 2009. Real Personal Spending was also strong with the highest MoM increase since early 2017.
Scheduled for tomorrow is the first quarter’s Employment Cost Index and Conference Board sentiment readings for April in addition to a couple of housing data points. Wednesday morning will see the release of both ISM and Markit manufacturing gauges for the month of April ahead of an FOMC meeting later in the day. While no change in rates is anticipated, this meeting will be followed by comments from Fed Chair Powell which will be closely watched for how the Fed has reacted to more positive tones from economic data in the first quarter. On top of the standard weekly Jobless Claims, preliminary numbers for Nonfarm Productivity and Labor Costs are scheduled for Thursday morning before the open. The Nonfarm Payrolls report is out on Friday after last month’s huge rebound of 196K jobs. There are also a number of speeches on Friday by Fed presidents from around the country. Start a two-week free trial to Bespoke Institutional to access our interactive economic indicators monitor and much more.
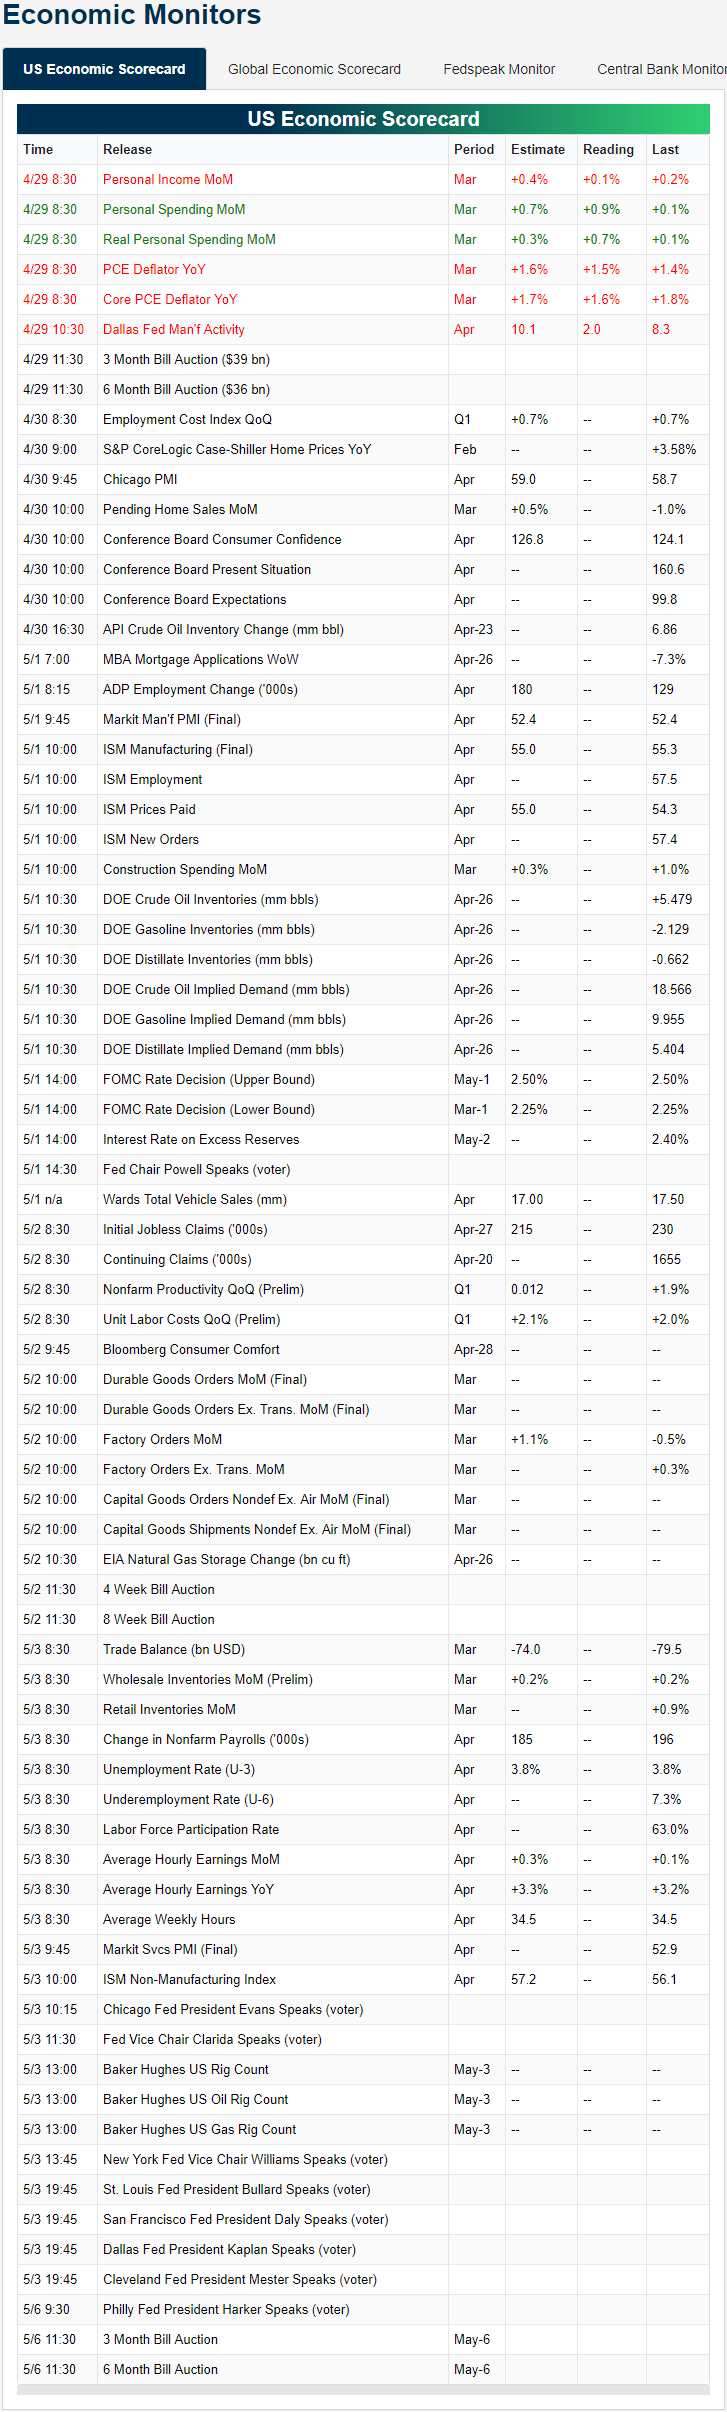
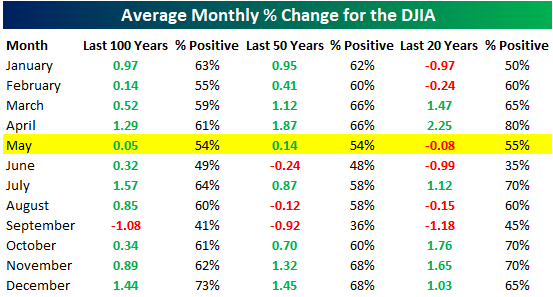
Chart of the Day: May Seasonality + Sell in May
One of the best months of the year from a seasonal perspective (April) is quickly coming to an end, and now investors are set to enter a period of the year that usually produces sub-par returns relative to other periods. There is also a significant difference in performance during the month of May based on whether the stock market is up or down year-to-date through April.
And what about the old saying “Sell in May and Go Away”? Is there any truth to it? Each year the “Sell in May” theory gets trotted out, but we have the data to prove whether investors really should hit the “Sell” button and then wait for six months until November rolls around.
Continue reading this Chart of the Day by starting a two-week free trial to any of our research membership levels.
Update on Earnings and Sales Beat Rates
In last week’s Bespoke Report newsletter sent to clients, we provided our first in-depth read on the first quarter earnings season. Our Earnings Explorer tool that’s available to clients also provides real-time updates so that users can stay on top of overall beat rates as well as results from individual companies. It’s an amazing feature that you should really check out if you have not yet done so! Start a two-week trial to Bespoke Institutional to access our Earnings Explorer and everything else we have to offer.
Below is a snapshot from one section of the Earnings Explorer on our website that shows the rolling 3-month EPS and sales beat rate for US companies reporting earnings. The charts show the beat rates over the last six months, but you can toggle between six months, one year, five years, and all years (20).
As shown, the bottom-line earnings per share beat rate had been trending lower since since late 2018, but in recent weeks it has begun to tick higher, indicating companies are having an easier time beating EPS estimates lately. At the same time, the top-line sales beat rate has been steadily trending lower over the last two months to its current level of 58.54%. Both the EPS and sales beat rates remain above their long-term averages, however.
When it comes to beat rates, we’d always prefer a stronger top-line beat rate than a stronger bottom-line beat rate, because it’s much easier for companies to maneuver an earnings beat than a sales beat. Unfortunately, that’s not the case right now.

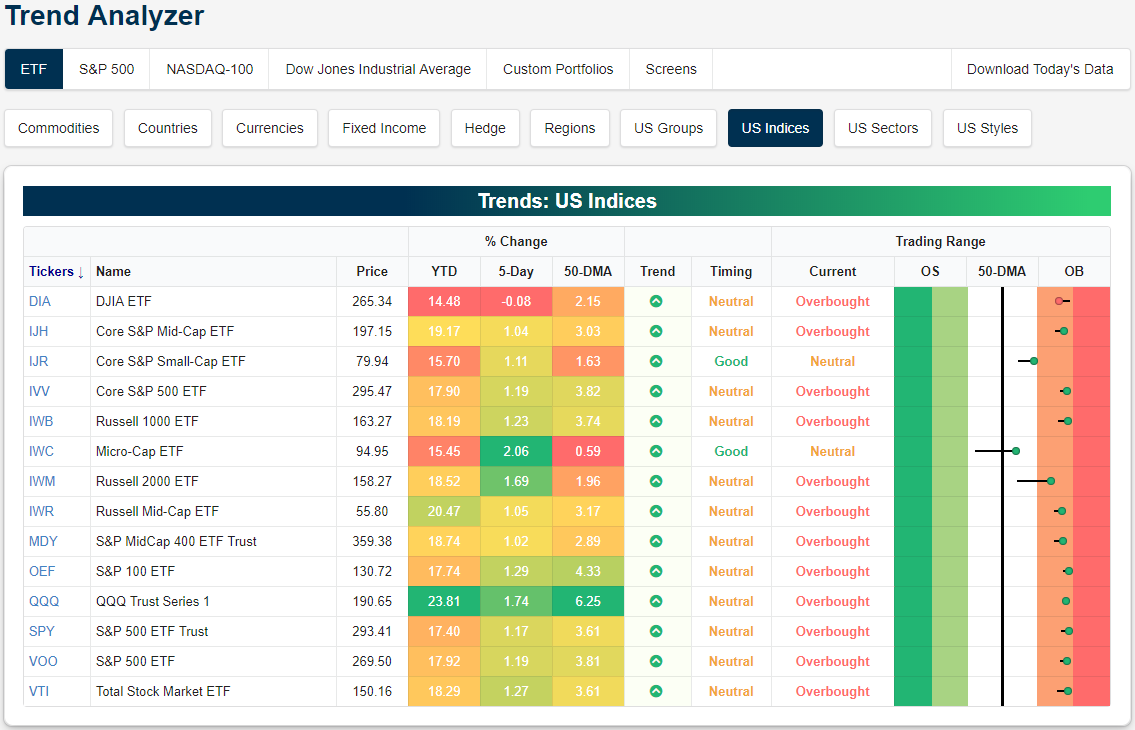
Trend Analyzer – 4/29/19 – Small Caps Looking Solid
As the S&P 500 finished last week at another all-time high, overbought and oversold conditions are largely unchanged from where they have been recently. Twelve of the fourteen major index ETFs are overbought while the remaining two are neutral. While off of extreme overbought levels that a few of the indices briefly touched last week, many of those that are overbought still remain just under extreme levels. With huge losses from certain weak earnings last week weighing heavy on the Dow (DIA), it was the only index to finish last week in the red and less overbought—though it is in fact still overbought. Start a two-week free trial to Bespoke Premium to access our interactive Trend Analyzer and much more.
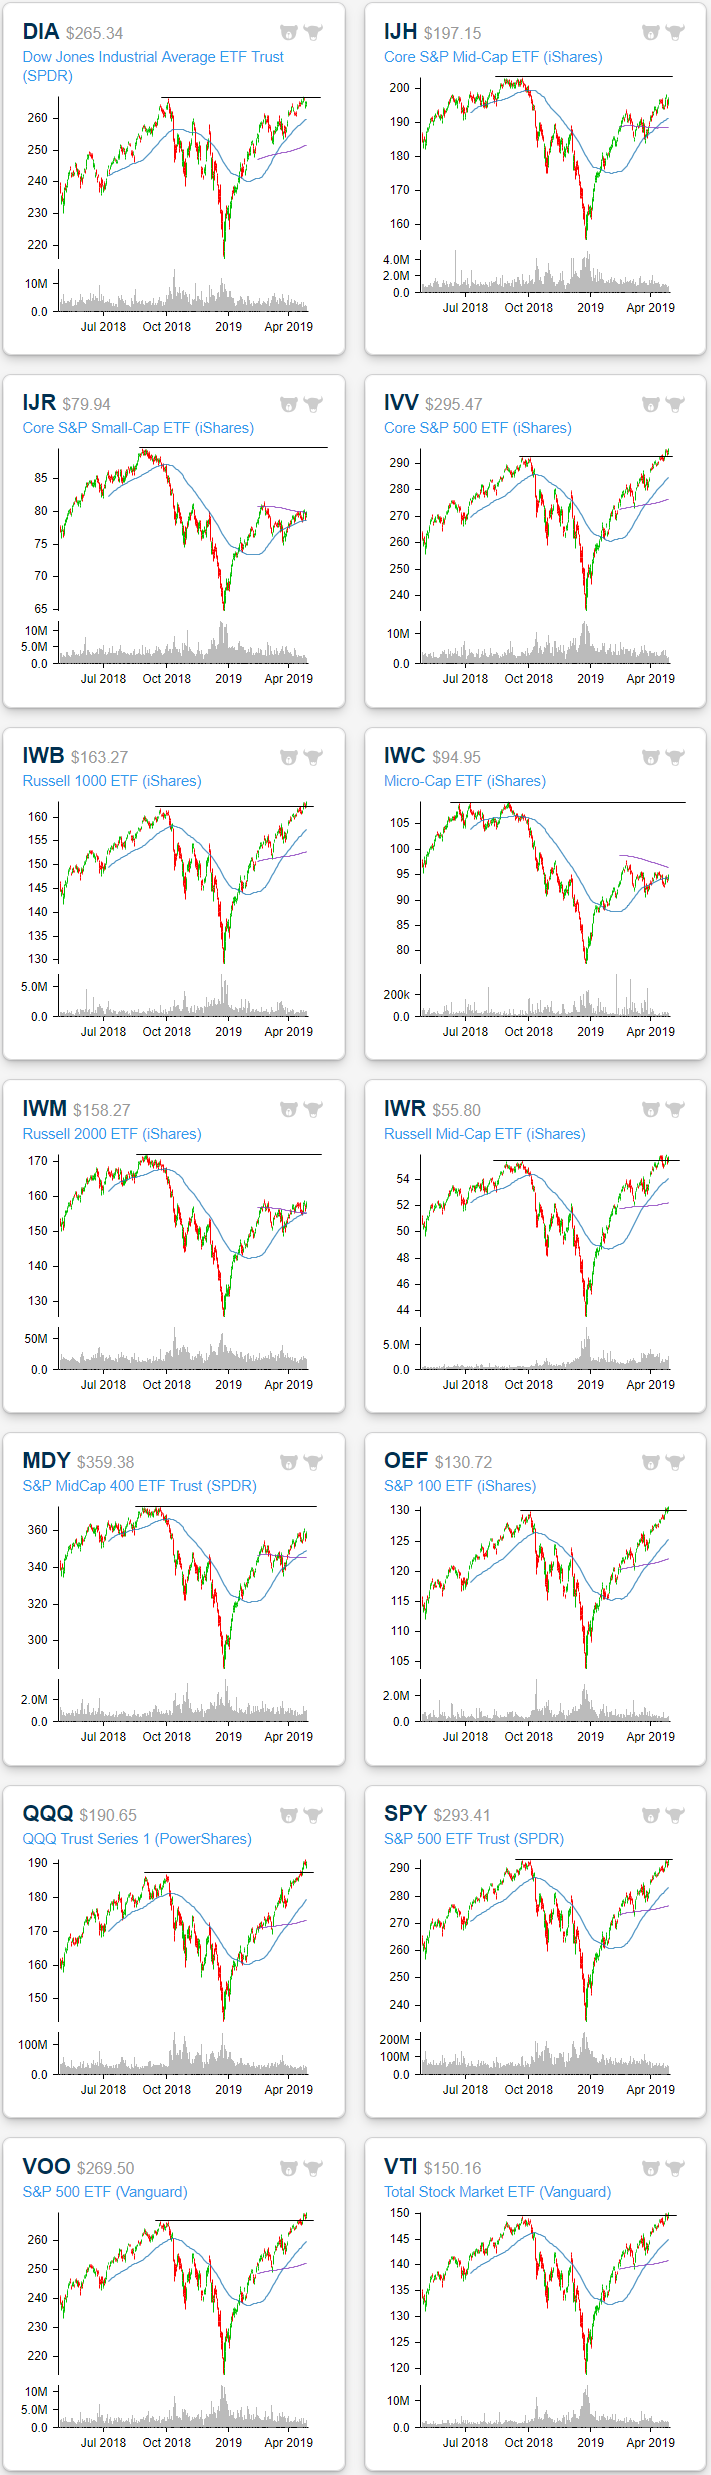
Pivoting over to the charts of these index ETFs, the large cap indices like the S&P 500 (VOO, SPY, IVV), S&P 100 (OEF), Russell 1000 (IWV), Nasdaq (QQQ), and Total Stock Market (VTI) have perhaps broken out the most distinctively. Each of these ETFs have now clearly taken out resistance at last year’s highs. Conversely, the Dow (DIA) has more distinctively failed to make a move higher. DIA stopped short right at prior highs late last week; brought lower by weakness in earnings of some of the member companies like 3M (MMM). While the Dow at least managed to make its way back up to its previous highs, the small and mid cap indices still have progress to make. Other than the Russell Mid Cap ETF (IWR), each of the small and mid caps still sit well below prior highs. Fortunately for the small caps, current overbought/oversold levels are giving them some room to run to make their way up to new highs as well.
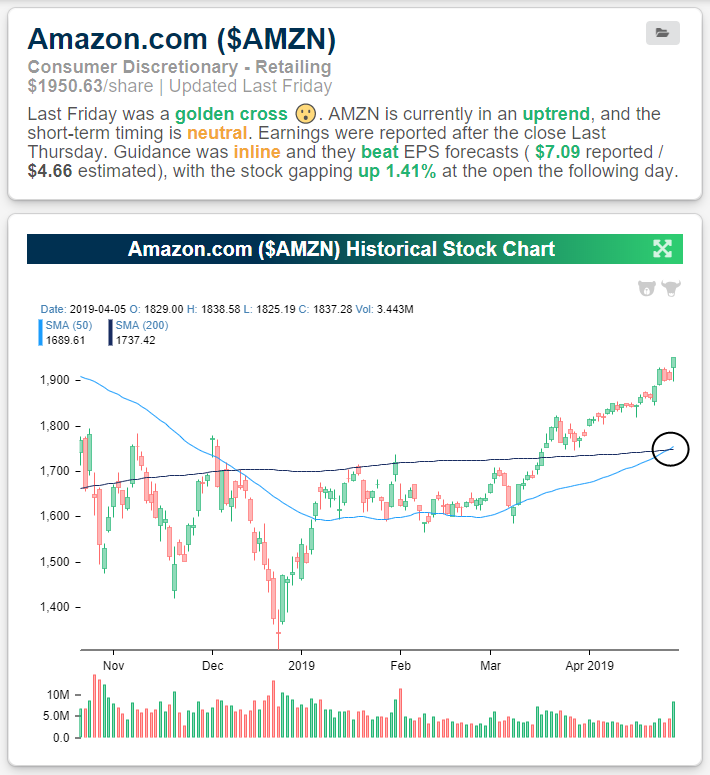
Amazon.com (AMZN) Golden Cross
Our new Security Analysis tool allows clients to search for individual stocks and ETFs in order to analyze them more closely. Below is a snapshot of one section of our Security Analysis tool for Amazon.com (AMZN). As noted, Amazon.com (AMZN) experienced a technical “Golden Cross” last Friday, which triggers when the stock’s 50-day moving average closes above the 200-day moving average as both moving averages are rising. Our text widget notes the golden cross along with a couple additional data points. One is that AMZN is currently in a long-term uptrend pattern with neutral timing. The other is that AMZN reported earnings last Thursday after the close and beat EPS estimates. The stock gapped up 1.41% the following morning after earnings, indicating that investors’ initial reaction to the news was positive.
The stock chart that’s also featured on our Security Analysis page shows AMZN’s golden cross more clearly. We’ve circled the point at which the golden cross occurred, which again happens when the 50-day crosses above the 200-day as both moving averages are rising. While AMZN certainly appears to be extended here, a golden cross is thought to be a positive technical formation. In the case of AMZN, the stock has seen eight prior golden crosses since its IPO in the late 1990s. In the three months that followed, AMZN saw a median gain of 9.8% with positive returns five out of eight times. More recently, the stock saw gains in the three months that followed each of its four golden crosses since the bull market began in March 2009. Start at two-week free trial to Bespoke Institutional to access our Security Analysis tool and everything else we have to offer.
Morning Lineup – Big Data and Earnings Week
While this will be the busiest week of the earnings season, the pace of reports to start the week has been relatively quiet with just 21 companies reporting so far this morning. Of those reports, just over 60% have exceeded EPS guidance while slightly more than half have exceeded revenue guidance. This afternoon, the pace will pick up considerably with close to 60 companies reporting headlined by Alphabet (GOOGL). In economic data this morning, Personal Income came in weaker than expected at a rate of 0.1% vs estimates for growth of 0.4%, while Personal Spending was higher at 0.9% vs expectations for growth of 0.7%. Spending more and earning less! The only other economic indicator of note today is the Dallas Fed Manufacturing report at 10:30 Eastern.
We’ve just published today’s Morning Lineup featuring all the news and market indicators you need to know ahead of the trading day. To view the full Morning Lineup, start a two-week free trial to Bespoke Premium.

One factor causing Americans to spend more may be the incessant increase of prices at the pump. Even with crude oil trading lower for a fourth straight day, it hasn’t been enough to counter the seasonal uptick that is normal for gas prices at this time of year. According to AAA, the national average price of a gallon of gas currently stands at $2.89. The most painful thing for consumers, though, has been that the increase has been constant. As shown in the chart below, it has now been a record 76 days since the national average price of gasoline last saw a one day decline in a streak that has now dwarfed every prior one since data begins in 2004.

Start a two-week free trial to Bespoke Premium to see today’s full Morning Lineup report. You’ll receive it in your inbox each morning an hour before the open to get your trading day started.
Bespoke Brunch Reads: 4/28/19
Welcome to Bespoke Brunch Reads — a linkfest of the favorite things we read over the past week. The links are mostly market related, but there are some other interesting subjects covered as well. We hope you enjoy the food for thought as a supplement to the research we provide you during the week.
While you’re here, join Bespoke Premium for 3 months for just $95 with our 2019 Annual Outlook special offer.
Real Estate
Want to Make Millions and Pay No Taxes? Try Real Estate by Patrick Clark and Benjamin Stupples (Bloomberg)
Financial records from the divorce of New York City real estate developer Harry Macklowe give us a view into the world of real estate taxation, where prolific deductions have allowed the billionaire to (legally) avoid paying income taxes since the 1980s! [Link; soft paywall]
Trump’s Housing Agency Cracks Down on Zero-Down Home Loans by Prashant Gopal (Bloomberg)
FHA-backed loans that give borrowers without a down payment access to the housing market have been targeted as a risk due to their high delinquency rates. [Link; soft paywall]
Renters Are Mad. Presidential Candidates Have Noticed. by Emily Badger (NYT)
With homeownership rates only barely above multi-decade lows, renters are an increasingly large bloc of the electorate, and one that Democrats see as a natural interest group to appeal to. [Link; soft paywall]
Fake News
How 11 People Are Trying to Stop Fake News in the World’s Largest Election by Saritha Rai (Bloomberg)
In many developing countries, WhatsApp is a more critical information source than traditional social networks or the formal news media. That creates fertile ground for the spread of misinformation, especially in India during the world’s largest elections. [Link; soft paywall]
Rise of the Machines
Google Spinoff’s Drone Delivery Business First to Get FAA Approval by Alan Levin (Bloomberg)
Wing Aviation, formerly a division of Google, has received the same certification as small airlines. It plans to deliver packages to rural communities in Virginia starting this year. [Link; soft paywall]
This YouTube Channel Streams AI-Generated Death Metal 24/7 by Rob Dozier (Motherboard)
A machine learning algorithm is streaming live death metal on YouTube. While we’re not huge fans of the genre, the results are actually pretty good. [Link]
Food
The United States of Mexican Food by Gustavo Arellano (Eater)
A summary of the massive catalogue of stories on Eater about the bounty of cuisine in the United States that ultimately originates south of the border. Mexican sushi, pea guacamole, debates over authenticity, tater tots, Punjabi-Mexican cuisine, the power of tortillas, panaderías, Yakima Valley tacos, masa, and more. [Link]
Leaked documents show that McDonald’s is adding international hits to its American menu, including the Spanish Grand McExtreme Bacon Burger and the Dutch Stroopwafel McFlurry by Kate Taylor (BI)
This year McDonalds will be rolling out a number of popular menu items from around the world: a mozzarella chicken sandwich, a burger with bacon sauce, gouda, and onions, and a waffle cookie ice cream treat are all due to become available to American fast food consumers. [Link]
Local Government
Lobbyist’s crusade to change Title IX in Missouri stems from his son’s expulsion by Edward McKinley (KC Star)
A Missouri lobbyist’s son was expelled from Washington University via a process involving Title IX, so the lobbyist has natural gone on a crusade to change the rules that ban sexual discrimination in education. [Link]
Chalking tires to enforce parking rules is unconstitutional, court finds by Alex Johnson (NBC)
A woman issued 15 parking tickets over a three year span in Michigan brought suit, arguing that chalking car tires to track how long they’ve been in a spot is a search and therefore a violation of the 4th Amendment. [Link]
Boston-area judge charged with helping undocumented immigrant escape courthouse to elude ICE by Tom Winter, Adiel Kaplan, and Rich Schapiro (NBC)
After a plainclothes ICE representative identified himself to a Massachusetts district court judge before detaining a defendant in the court, the judge permitted the defendant to leave via the back of the courthouse. The judge and a court officer are facing multiple charges as a result. [Link]
Workaholics
Women Did Everything Right. Then Work Got ‘Greedy.’ by Claire Cain Miller (NYT)
A professional culture that values work hours uber alles means that women who provide child care are unable to advance in their careers, presenting a tradeoff that men do not face. To quote: “the nature of work has changed in ways that push couples who have equal career potential to take on unequal roles”. [Link; soft paywall]
Trivia
The Man Who Solved ‘Jeopardy!’ by Oliver Roeder (538)
Through April 26th, James Holzhauer has won 16 straight Jeopardy games, with winnings in excess of $1mm. In addition to strong buzzer work, Holzhauer has pursued a unique strategy that focuses on locking down Daily Doubles and takes big risks with the money he has already racked up in that round. [Link]
Fund Flows
‘Boom, Another Billion’: Muni Funds Land a Year’s Worth of Cash in Four Months by Danielle Moran (Bloomberg)
Since January, mutual funds focused on municipal bonds have hauled in more than $30bn, a massive haul larger than good years experienced in the past. [Link; soft paywall]
Savings
The NFL Draft’s Most Frugal Player by Rachel Bachman (WSJ)
Former Clemson defensive tackle and top draft pick for the Miami Dolphins is an epically frugal spender, piling up $15k in savings during his time at Clemson thanks to an eclectic desire to spend as little as possible; resources available to college football players made this possible, along with avoiding a car and using his family’s phone plan and accepting federal Pell Grants available to low-income students. [Link; paywall]
Economic Research
The Macroeconomic Effects Of Student Debt Cancellation by Scott Fullwiler, Stephanie Kelton, Catherine Ruetschlin, and Marshall Steinbaum (Levy Economics Institute)
A comprehensive analysis of what would happen if the federal government were to cancel all outstanding student loan debt, with implications for consumer spending, overall growth, employment, and inflation. [Link; 68 page PDF]
Geology
The Fantastically Strange Origin of Most Coal on Earth by Robert Krulwich (National Geographic)
Where does coal come from? 90 percent of the coal extracted today comes from trees that were never broken down by microorganisms because they hadn’t evolved yet. [Link]
Driverless Kids
Driving? The Kids Are So Over It by Adrienne Roberts (WSJ)
Fewer teens have a driver’s license, thanks to more restrictive licensing laws as well as less need for cars thanks to ride-sharing, a preference for denser cities a bit later in their life, and the cost of car ownership. [Link; paywall]
Venture Capital
How the Kleiner Perkins Empire Fell by Polina Marinova (Fortune)
How one of the most successful venture capital firms fell behind: personality clashes, internal dissent, and chasing returns. [Link]
Read Bespoke’s most actionable market research by joining Bespoke Premium today! Get started here.
Have a great weekend!
The Closer: End of Week Charts — 4/26/19
Looking for deeper insight on global markets and economics? In tonight’s Closer sent to Bespoke clients, we recap weekly price action in major asset classes, update economic surprise index data for major economies, chart the weekly Commitment of Traders report from the CFTC, and provide our normal nightly update on ETF performance, volume and price movers, and the Bespoke Market Timing Model. We also take a look at the trend in various developed market FX markets.

The Closer is one of our most popular reports, and you can sign up for a free trial below to see it!
See tonight’s Closer by starting a two-week free trial to Bespoke Institutional now!
The Bespoke Report — With All-Time Highs Achieved, Time For Earnings To Deliver
The S&P 500 shrugged off disappointing mid-week global economic data and some soft Friday earnings to close the week at a new all-time high. Just about half of the S&P 500’s market cap has now reported, though smaller-cap stocks have a lot more left in the tank this earnings season. So far, results have been a bit mixed, especially when it comes to top-line revenues; with stocks back at record levels, earnings need to deliver and finish the season strong.
Below is a look at asset class total returns using key ETFs. For each ETF, we show total returns year-to-date, since the last all-time high for the S&P 500 on 9/20/18, and since the bull market began back on March 9th, 2009.
In this week’s report, we analyze earnings results, global economic data, commodity and foreign exchange price movements, market sentiment, and more to give you the inside track on what’s driving the market at all-time highs. We cover everything you need to know as an investor in this week’s Bespoke Report newsletter. To read the Bespoke Report and access everything else Bespoke’s research platform has to offer, start a two-week free trial to one of our three membership levels. You won’t be disappointed!
