The Closer: End of Week Charts — 6/14/19
Looking for deeper insight on global markets and economics? In tonight’s Closer sent to Bespoke clients, we recap weekly price action in major asset classes, update economic surprise index data for major economies, chart the weekly Commitment of Traders report from the CFTC, and provide our normal nightly update on ETF performance, volume and price movers, and the Bespoke Market Timing Model. We also take a look at the trend in various developed market FX markets.

The Closer is one of our most popular reports, and you can sign up for a free trial below to see it!
See tonight’s Closer by starting a two-week free trial to Bespoke Institutional now!
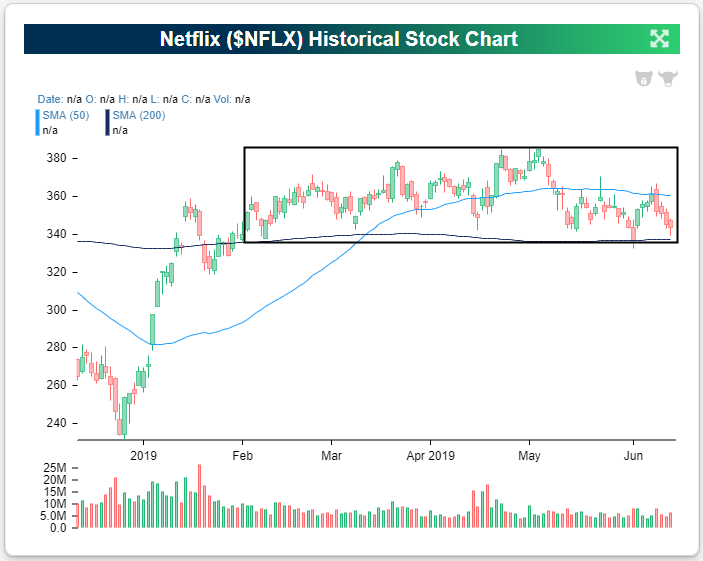
Sideways Netflix (NFLX)?
Netflix (NFLX) is not a stock that usually meanders sideways, but that is exactly what it has done for the past 5+ months. You can see the sideways track that NFLX has taken recently in the chart below pulled from our Security Analysis page that’s available to Bespoke Institutional members.
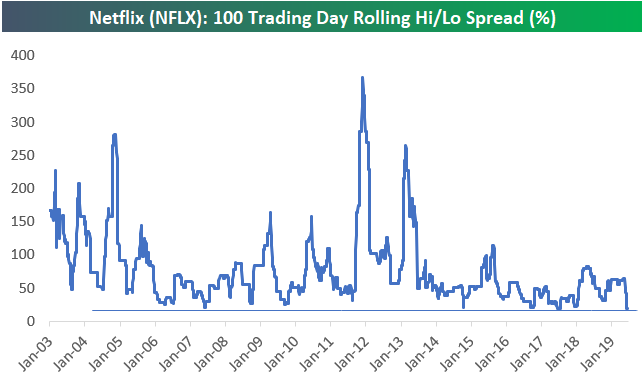
Over the last 100 trading days, the high/low closing spread for Netflix (NFLX) has been 19.5%. Below is a chart showing the rolling 100 trading day high/low spread for NFLX since it IPOd, and as you can see, the current spread is as tight as the stock has seen throughout its history. It could certainly get tighter, but we would expect this stock to break either higher or lower in a big way sometime soon given the long consolidation phase that it’s currently in.
B.I.G. Tips – Retail Sales: Even Stronger Below the Surface
While it may not have looked like anything special based on the weaker than expected headline reading, there actually wasn’t much not to like about May’s Retail Sales report. In addition to being slightly better than expected after stripping out Autos and Gas, April’s report was revised significantly higher.
The table below shows monthly streaks of gains or losses for each of the sectors tracked in the Retail Sales report. Here we can see how broad and consistent the strength has been in Retail Sales after taking revisions into account. Five sectors have seen m/m growth for five straight months, and no group has seen more than one straight month of decline. Bars and Restaurants are one group that has seen sales growth for five consecutive months, and while it has yet to overtake Food and Beverage Stores in terms of its total share of sales, it’s getting close.
We just published our monthly update to key trends in this month’s Retail Sales report. To see the report, sign up for a monthly Bespoke Premium membership now!

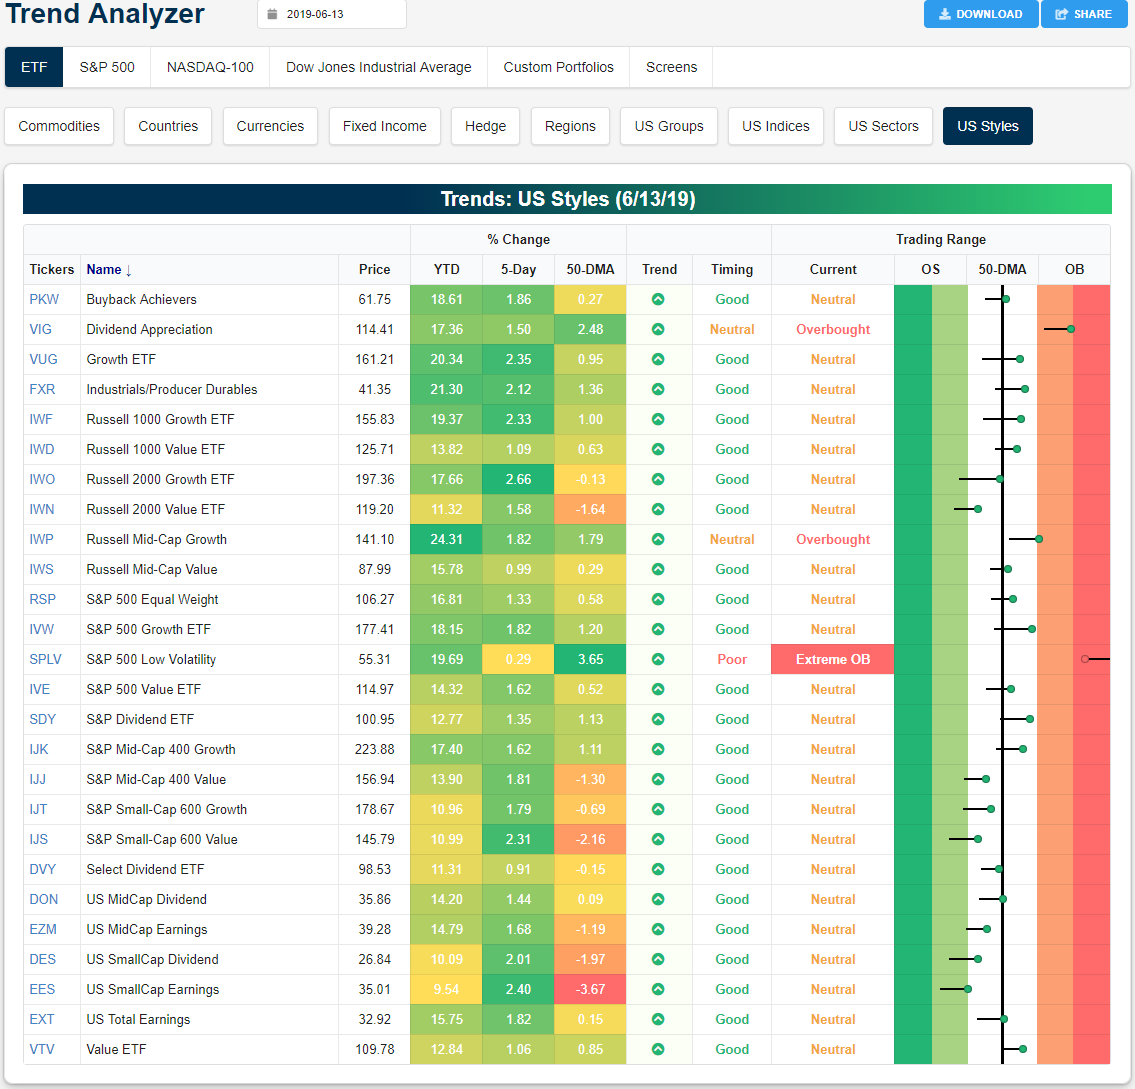
Trend Analyzer – 6/14/19 – Growth and Earnings Outperform
One week ago, small-caps—like the Micro-Cap ETF (IWC), Russell 2000 (IWM), and Core S&P Small Cap (IJR)—and the Nasdaq (QQQ) had all been unable to move out of oversold territory like the other major index ETFs. That has changed this week as all of the US index ETFs tracked in our Trend Analyzer tool are currently neutral. While they have moved out of oversold, small-caps are still lagging in the sense that they remain the furthest below the 50-DMA. Other indices either sit just below or have broken above in the past week. The Nasdaq has seen the most notable move towards the 50-day, surging 3.27% out of oversold territory. A weak earnings report from Broadcom (AVGO) last night has put pressure on the semis, and as a result, the broader technology sector and a tech-heavy Nasdaq. This is likely to eat into some of these gains today so it may take a bit longer until QQQ takes out the 50-day.

Over the past week, like the major index ETFs, the different style ETFs are almost entirely sitting at neutral. Although, there are some outliers like the S&P Low Volatility (SPLV) which is working its way out of extreme overbought levels (presumably as a flight to safety following May declines). One trend this week but also generally in 2019 to take note of is the outperformance of growth stocks versus value. Broadly speaking, the growth-focused ETFs like the Growth ETF (VUG) have been outperforming their value-focused peers by around 1% in the past week. This is the case across most of the indices and market caps, though, S&P Small and Mid Cap have seen slight outperformance of value. This is more evident in small caps. Additionally, earnings has been outpacing dividend-focused ETFs. Start a two-week free trial to Bespoke Institutional to access our interactive economic indicators monitor and much more.
Morning Lineup – Semis Spoil the Party
In a post on Wednesday, we highlighted the important juncture the semiconductor space was at, and unfortunately, the group didn’t take the bullish route. After failing to break out above resistance, last night’s earnings report from Broadcom (AVGO) dashed any hopes for the sector ending the week on a positive note and above resistance. The group is poised to open lower by close to 3% this morning as AVGO dampened the outlook for a second-half turnaround. Retail Sales, which haven’t exactly inspired confidence lately, actually came in relatively well, and Industrial Production and Capacity Utilization will be released later on. Please read today’s Morning Lineup for further analysis on AVGO’s earnings and the semis in general as well as a recap of some important overnight economic data in China.
Bespoke Morning Lineup – 6/14/19

Today’s decline in the semi ETF (SMH) will mark the 16th downside opening gap of more than 2.5% for the group over the last five years. Below we list each of those prior occurrences along with how SMH performed from the open to close. Overall, SMH has seen an average open to close gain of 0.76% (median 1.73%) following these downside gaps with gains 60% of the time. For each day, we also list the opening gap of SPY to show if the downside move in SMH was market-related or more specific to semis (like today’s move). As shown, the only time SMH gapped down this much or more while the S&P 500 saw a smaller downside gap was in October 2014.

Start a two-week free trial to Bespoke Premium to see today’s full Morning Lineup report. You’ll receive it in your inbox each morning an hour before the open to get your trading day started.
The Closer – Rates & Real Estate, Rails, Import Prices – 6/12/19
Log-in here if you’re a member with access to the Closer.
Looking for deeper insight on markets? In tonight’s Closer sent to Bespoke Institutional clients, we review real estate’s outperformance relative to equities and underperformance relative to rates. We also show the dominance of software versus traditional industrial companies. Further on the topic of industrials, we take a look at the collapse in rail volumes and performance of rail stocks. We finish with an update on import prices.

See today’s post-market Closer and everything else Bespoke publishes by starting a 14-day free trial to Bespoke Institutional today!
Bespoke’s Sector Snapshot — 6/13/19
We’ve just released our weekly Sector Snapshot report (see a sample here) for Bespoke Premium and Bespoke Institutional members. Please log-in here to view the report if you’re already a member. If you’re not yet a subscriber and would like to see the report, please start a two-week free trial to Bespoke Premium now.
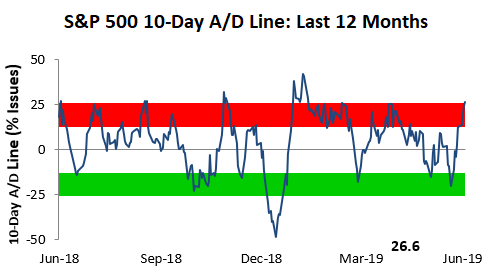
In this week’s Sector Snapshot, we note an overbought 10-Day Advance/Decline line even though the S&P 500’s price is trading at neutral levels.
To gain access to the report, please start a two-week free trial to our Bespoke Premium package now. Here’s a breakdown of the products you’ll receive.
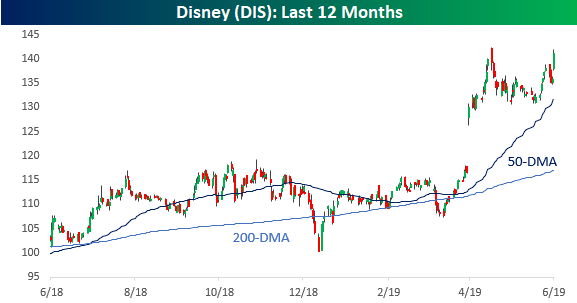
The Magic of Disney
What a day and a year it has been for Disney (DIS). The company’s stock is up over 4% today, which is the type of one day gain it has only seen three other times in the last four years. While the stock is not quite at an all-time high on an intraday basis, if the current levels hold into the close, it will be the highest closing price for the stock on record.
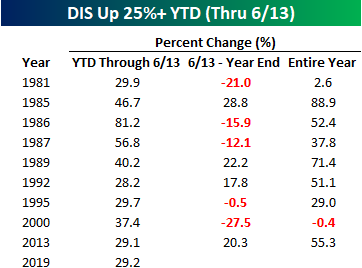
Shares of Disney are currently up over 29% YTD, putting it on pace for its best YTD performance (through 6/13) since 2000. The table below lists all years in which Disney shares were up 25% or more through this date in the year going back to 1980. For the nine prior years shown, we also show how DIS performed from 6/13 through year-end as well as how the stock performed for the entire year. As the results indicate, there is no clear pattern for the stock following strong starts for the year in the first half. In the nine prior years shown, the stock was up 10%+ four times, down 10%+ four times, and basically flat once!
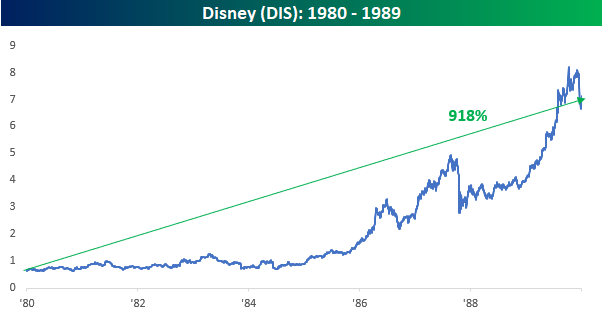
One decade out of the last four that was exceptionally strong for DIS was the 1980s. Of the nine prior years highlighted in the above table, five of them were in the 1980s. All those strong years add up. In that decade alone, the stock was up 918%, even after a decline of 17% in the final 12 weeks of 1989. Without that last sell-off to close out the decade, DIS would have been up over 1,120%. Start a two-week free trial to Bespoke Institutional to access all of our research and best stock ideas.
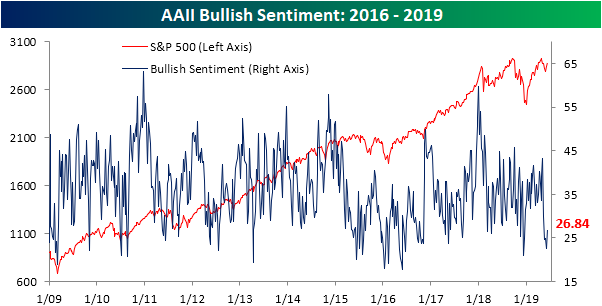
Bulls Slowly Return
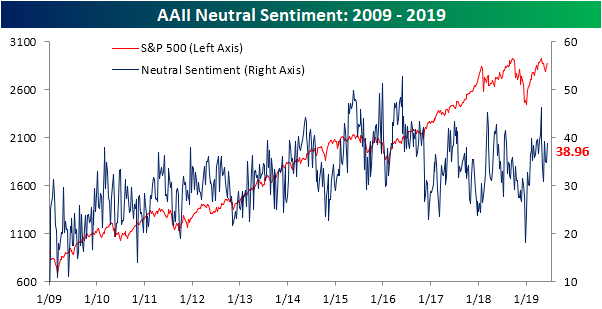
With equities pulling back in May, investor sentiment has held a bearish bias over the past few weeks. Last week’s rally has reversed this build-up of bearish sentiment to a small degree as the percentage of investors reporting as bulls in this week’s AAII survey grew to 26.84% from 22.53% last week. While this is an improvement, investors have been hesitant to rush back as bullish sentiment remains low relative to history. This week’s reading is still over one standard deviation below the historical average of 38.19%. This is a bit of a contrast to the Investors Intelligence survey of newsletter writers, which saw bulls come surging back with the largest increase in the number of respondents reporting as bullish since the first weeks of 2019.
Bearish sentiment, on the other hand, saw a sharper move, falling to 34.2% versus 42.58% last week. That is the largest decline in bearish sentiment since February 7th of this year when it had fallen just under 9% from 31.76% to 22.78%. Similar to bulls, while this is an improvement, bearish sentiment remains elevated above its historical average. Additionally, the bull-bear spread has favored bears for five weeks in a row now. The last time the spread had a streak like this (also five weeks long) was in May of 2016.

More than anything, investors appear to be hesitant on the current market as neutral sentiment is the predominant sentiment this week. Neutral sentiment is up ~4% this week to 38.96%. While higher than average and elevated, as it has been most of this year, this is not at any sort of extreme reading. Start a two-week free trial to Bespoke Institutional to access our interactive economic indicators monitor and much more.