The Closer – Low VIX Cuts, Risk Asset Rally, Housing Starts, Homebuilders – 6/18/19
Log-in here if you’re a member with access to the Closer.
Looking for deeper insight on markets? In tonight’s Closer sent to Bespoke Institutional clients, ahead of tomorrow’s FOMC rate decision, we take a look at previous rate cuts when the VIC looked similar to how it does today. We also show could be in store for the forward performance of equities and WTI given today’s rally. Next, with the ECB’s dovishness and positive trade headlines, we show today’s movement in credit and EMFX markets. Finishing with a bit of economic data, we recap today’s slightly stronger residential construction data and show how some Homebuilder stocks have been performing.

See today’s post-market Closer and everything else Bespoke publishes by starting a 14-day free trial to Bespoke Institutional today!
Bespoke Stock Scores — 6/18/19
Starts Starting to Roll
It has now been 15 months since Housing Starts last made a new high, and despite the fact that they seem to have stabilized, on a 12-month average basis, they are showing signs of rolling over. With residential housing being such a large share of the economy, we wanted to show how a rollover in Housing Starts fits in with the economic cycle. The chart below shows Housing Starts on a 12-month rolling average basis. In it, we have overlaid recessions in gray and colored the line red whenever the reading hit a one-year low. Looking at the chart, there wasn’t a single recession where the 12-month average reading in Housing Starts wasn’t at 12-month lows heading into the recession. There were, however, a number of ‘false positives’ where the 12-month average had rolled over and no recession followed before Starts started to rebound again. Those occurrences were in the mid-1960s, mid-1980s, mid-1990s (2 periods) and during the early stages of this expansion in 2011. So while the slowdown in Housing Starts is reflective of slower overall growth, it hardly guarantees a recession is around the corner. One trait that these ‘false-positive’ periods do have in common, though, is that during all five of them, the FOMC was easing monetary policy during or shortly after the 12-month low readings in Housing Starts.
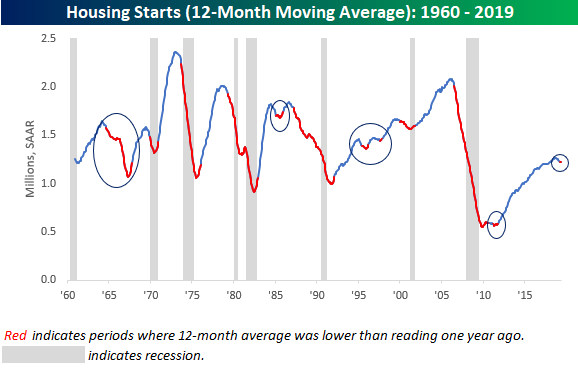
Given the volatility in multi-family units, we also ran this analysis using single-family Housing Starts, but here again, the results are similar. While single-family starts have typically already started to roll over well in advance of recessions, not all rollovers in single-family starts have been followed by recessions. Start a two-week free trial to Bespoke Institutional to access our entire suite of investment tools and all of our daily research.

B.I.G. Tips – Fed Days June 2019
Chart of the Day – 1% Morning Rallies
VIX Dragged Down, But What Happens Next?
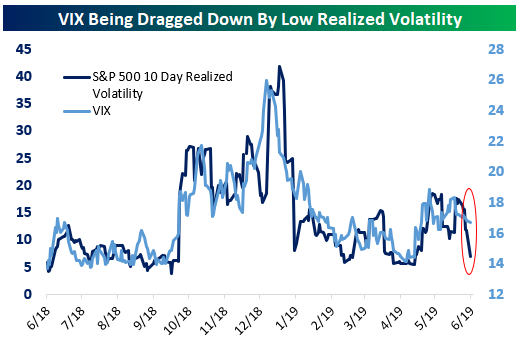
With the US equity market enjoying a period of very low volatility, the VIX index is being dragged down by the S&P 500’s low realized volatility. In the chart below, we compare the level of the VIX to the level of 10-day realized volatility for the S&P 500. As shown, realized volatility is grinding towards recent lows. In those situations, implied volatility (which the VIX measures) can’t stay elevated for long. Declining implied volatility is a direct response to elevated realized volatility.
The recent volatility decline has come after a 6-day run without a 50 bps move (through yesterday) for the S&P 500. That was preceded by 4 straight gains of at least 50 bps for the S&P. In the history of the index, that combination has only happened once before: the 10 sessions ended April 14th of 1966. As shown in the chart below, the result wasn’t great for equity investors, with stocks plunging more than 20% over the subsequent six months. These sorts of analogues are, of course, fodder for much anxiety and bearish crowing, but it’s important not to read too much into a sample size of just one. Start a two-week free trial to Bespoke Institutional to access our entire suite of investment tools and all of our daily research.
Stocks Crush Rocks
The 2010s have been a rough decade for the yellow metal. As shown in the chart below, since 2009, gold is on pace to lose out to equity market total returns by almost 10%…per year. It’s the sixth decade since the 1920s that the spot price of gold has lagged US equity market total return; over the course of the last 8 decades, the cumulative underperformance is more than 4%…and once again, that’s per year! Given the costs of storing gold, which generally translate to an upward-sloping futures curve (contango), this analysis using spot prices is if anything favorable to gold! In other words, persistent and large asset allocation to gold leads to a substantial underperfomance versus stocks, even when putting your hands on the scale in favor of gold. That doesn’t mean investors should never own gold, which can be a useful investment in terms of portfolio construction, but it does suggest that incremental units of gold exposure will reduce returns relative to equities over the long run. We covered the gold vs. stocks relationship in last night’s post-market macro note — The Closer. For more analysis like this on a daily basis, start a two-week free trial to Bespoke Institutional.
Facebook (FB) Leading FAANGs
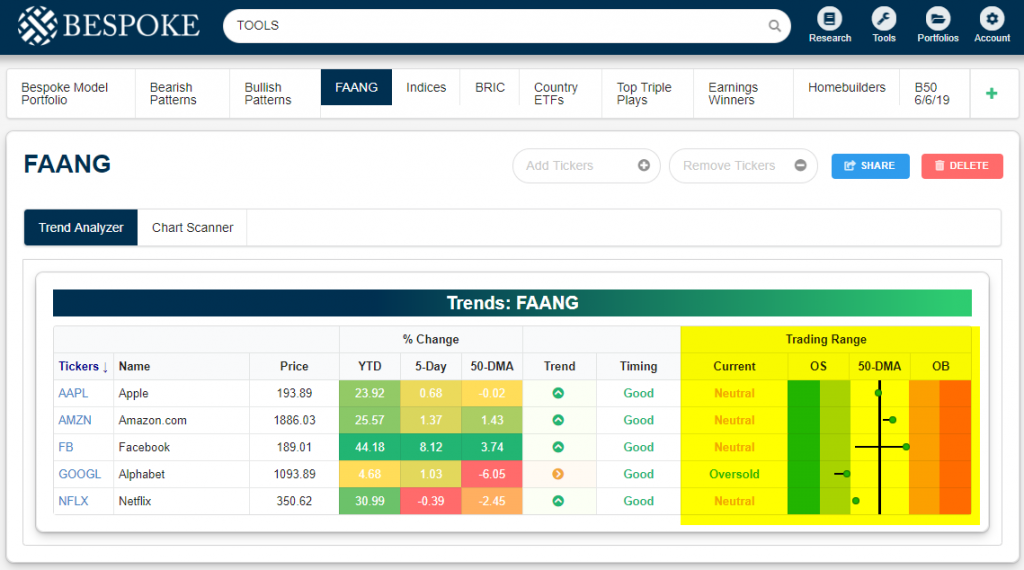
Below is a quick update on the five FAANG stocks as seen through our Trend Analyzer and Chart Scanner tools. As shown, Facebook (FB) has surged 8% over the last week, leaving it up 44% YTD. Given the relentless negativity we hear about the company these days, most people — from Wall Street to Main Street — would be surprised to see the stock up that much in 2019.
Amazon (AMZN) is the only other FAANG stock that’s above its 50-day moving average, while both Alphabet (GOOGL) and Netflix (NFLX) are solidly below their 50-DMAs. Apple (AAPL) is sitting ever slightly below its 50-day by just 2 basis points.

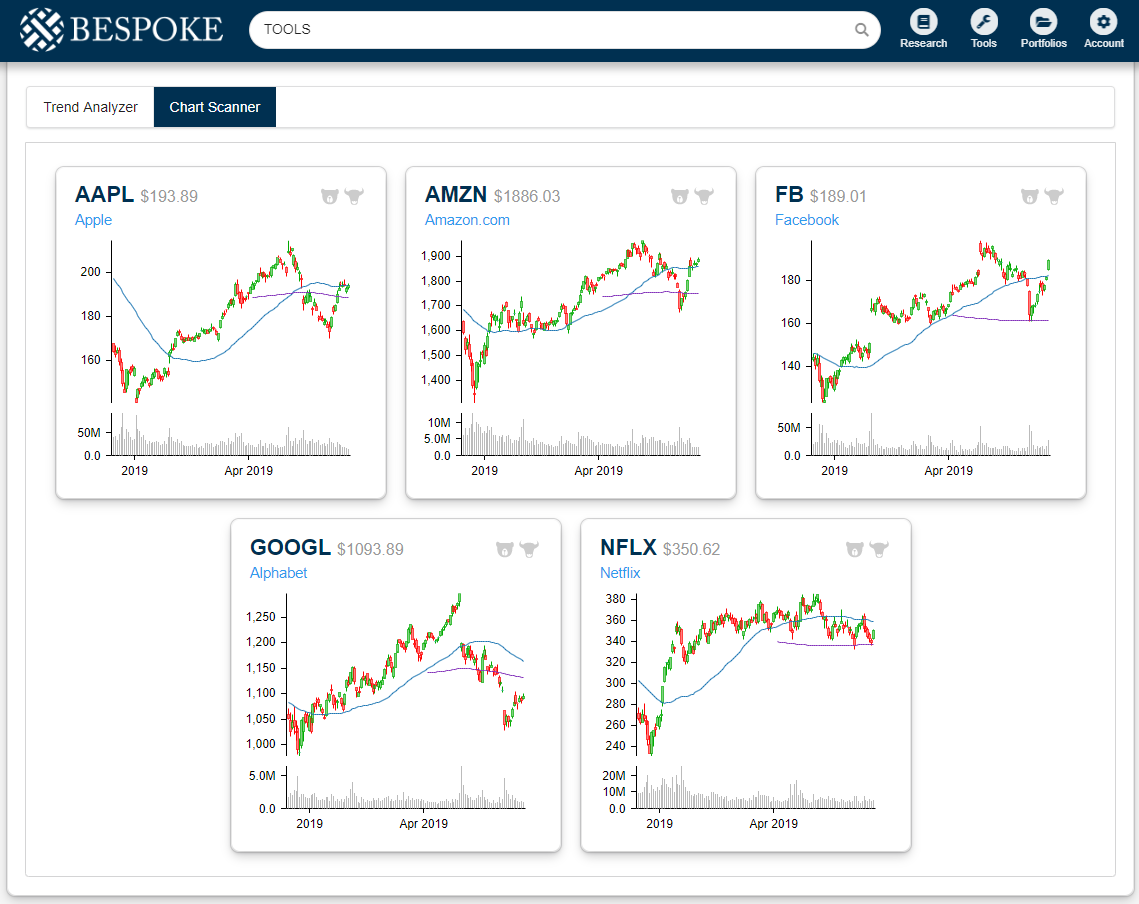
Below are price charts for each of the five FAANG stocks pulled from our Chart Scanner tool that’s available to Premium and Institutional members. Facebook (FB) and Amazon.com (AMZN) are the closest to their prior highs, but they all still have a ways to go before they experience a breakout. Netflix (NFLX) continues to trade in an uncharacteristically tight sideways pattern. Start a two-week free trial to Bespoke Institutional to access our entire suite of investment tools and all of our daily research.
Morning Lineup – Tired of Winning
While the US has been facing its own concerns regarding the state of the economy, there is widespread agreement that conditions are better here than other areas of the world. The latest indication this morning comes out of Europe as ECB President Mario Draghi suggested that “in the absence of improvement…additional stimulus will be required.” It’s great that the US economy is doing relatively well, but it has resulted in central banks around the world taking an easier stance towards monetary policy as the FOMC’s last move was a rate hike. The President is getting tired of all this winning and this morning vented his frustration again on Twitter, saying the latest comments from Draghi were “unfair to U.S.”
Please read today’s Morning Lineup for a recap of Draghi’s comments, the latest inflation data out of Europe, and housing data out of Australia.
Bespoke Morning Lineup – 6/18/19

Markets will face a big test tomorrow as the Fed will announce its latest policy move on interest rates. While it is likely no change to rates is made at the meeting, the market is obviously waiting for clarity as to what will happen going forward. Will the Fed move towards the market and the President (more cuts), or will it try to jawbone the markets closer to its view (fewer cuts)? That’s the big question, and while there is the potential for a volatile market reaction, the VIX is moving to multi-week lows ahead of the meeting. Just this morning, it dropped back below 15 and is now back below its 50-DMA for the first time since early May.

Start a two-week free trial to Bespoke Premium to see today’s full Morning Lineup report. You’ll receive it in your inbox each morning an hour before the open to get your trading day started.
The Closer – Low Vol, Gold Lagging, Empire Flop, IG Bonds Stretched – 6/17/19
Log-in here if you’re a member with access to the Closer.
Looking for deeper insight on markets? In tonight’s Closer sent to Bespoke Institutional clients, we highlight an uncommon occurrence of volatility slamming on the brakes and what has happened in the one other instance we found. As gold runs up near multi-year resistance, we then show how the metal has underperformed over the past decades. Turning to macroeconomic data, we give a reason to doubt today’s weak Empire Manufacturing number. Before finishing with a look at today’s release of Treasury flows, we review corporate credit and the ongoing rally in spreads.
See today’s post-market Closer and everything else Bespoke publishes by starting a 14-day free trial to Bespoke Institutional today!