GDP Unrevised In Total, With Some Small Changes Under The Surface
This morning the BEA released its third and final estimate of Q1 GDP growth. Economists were expecting a small revision higher to 3.2%, but the final reading on GDP growth in Q1 was 3.1%, unchanged from the second estimate on a rounded basis and +6 bps actual. In the table below, we show the evolution of the release from Q4’s final reading to today’s release, with the prior estimate included as well. Notable revisions higher include non-auto durables consumption, software spending, some other categories of fixed investment, and state/local government spending. Notable downward revisions included autos, household services spending (ex health care, which was revised up), and output of non-profit institutions. Inventories were also revised down slightly. Start a two-week free trial to Bespoke Institutional to access our entire suite of research services.

Chart of the Day: Shareholders Footing The Bill
Morning Lineup – Conflicting Headlines
Dow futures are under a bit of pressure this morning due to weakness in Boeing (BA), which is trading down nearly 3%. S&P 500 and Nasdaq futures, meanwhile, are both indicating a positive open although they too are off the highs of the overnight session. The more optimistic tone earlier was due to some positive headlines regarding this weekend’s meeting between President Trump and President Xi, but some of the air was let out of the balloon following a less optimistic tone from the WSJ.
Please read today’s Morning Lineup to get caught up on everything you need to know ahead of the new trading day including the latest news on trade, Sentiment among Korean businesses and in the EU, as well as the latest on the Brexit saga.
In economic news, GDP was slightly worse than expected (3.1% vs 3.2%), while Jobless Claims were a bit higher than expected (227K vs 220K expected).
Bespoke Morning Lineup – 6/27/19

Semis have been one of the most negatively impacted groups from all of the trade disputes between the US and China, but yesterday the group got a reprieve on the back of Micron’s (MU) big 13%+ gain. Overall, the Philadelphia Semiconductor Index (SOX) rallied over 3%, and while the S&P 500 sold off in the afternoon, semis managed to hold up much better. In fact, all 30 stocks in the SOX traded higher yesterday, which was the fourth time this month that we have seen every stock in the index trade higher on the same day.
While there have now been four days this month where every stock in the SOX traded higher on the day, there hasn’t been a single day where every stock traded lower. Going back to 2009, this is only the second month where we have seen a net of at least four days where breadth in the SOX was 100% positive. The one other month was back in July 2009 in the early stages of the bull market. Conversely, there has only been one month in the last ten years where there was a net of four days where every stock in the SOX traded down on four separate days in the same month. That month was March 2018 when the index also saw its high for 2018.

Start a two-week free trial to Bespoke Premium to see today’s full Morning Lineup report. You’ll receive it in your inbox each morning an hour before the open to get your trading day started.
The Closer – Oil Driving, Financial Conditions, Durables Slowing, GDP Tracking – 6/26/19
Log-in here if you’re a member with access to the Closer.
Looking for deeper insight on markets? In tonight’s Closer sent to Bespoke Institutional clients, we begin with a look at the hit small caps have taken, but provide a reason for optimism in the space. Given the spike up in oil from geopolitical factors and today’s EIA data, we then show the strength of the energy sector and CAD. We also review how financial conditions are using a composite of indices from Goldman Sachs, Bloomberg, and the Chicago Fed. Further in economic data, we make sense of today’s messy durable goods release followed by a recap of the trade balance and inventories. We finish tonight with our weekly look at ICI fund flows.

See today’s post-market Closer and everything else Bespoke publishes by starting a 14-day free trial to Bespoke Institutional today!
Netflix (NFLX) on Ice
Despite news that its most popular show would no longer be available on the streaming service beginning in 2021 and that one of its top creative directors was jumping ship for Disney (DIS), shares of Netflix (NFLX) have managed to rally today and are actually slightly outperforming the broader market. While NFLX is higher today, the stock remains stuck in a major trading range between the mid-$330s and mid-$380s. That may sound like a wide level, but believe it or not, the current 14% trading range that NFLX has been stuck in for the last 100 trading days is the narrowest in the stock’s history. For some perspective on how the current range compares to history, NFLX’s average 100-trading day range has been 78.1% or more than 5 times the current range! You may also recall that just two weeks ago, we also highlighted the narrow range in the stock, and since then the range has narrowed by another five percentage points.
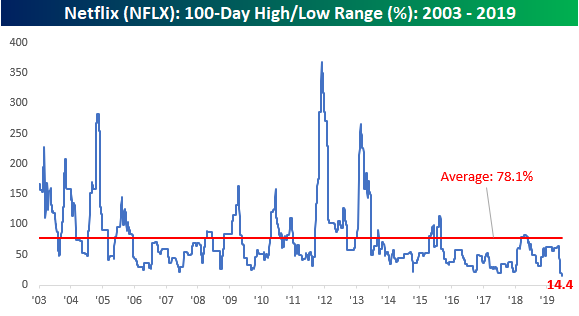
So what happens following periods when NFLX trades in a narrow range? In the 16 years that NFLX has been public, there has only been one other time where the stock traded in a 100-trading day range of less than 20%. That one period was in 2017, and while it doesn’t get any smaller than a sample size of one, that period ended up being a short period of consolidation before continuing higher. A key difference between the two periods, though, is that back in 2017, the sideways range followed a new all-time high in NFLX’s price, while the current sideways range comes more than a year after the stock last hit a high. Start a two-week free trial to Bespoke Institutional to access our entire suite of research services.
Chart of the Day: Long Term Bullish Breakouts
Russell 2000 New Lows By Sector
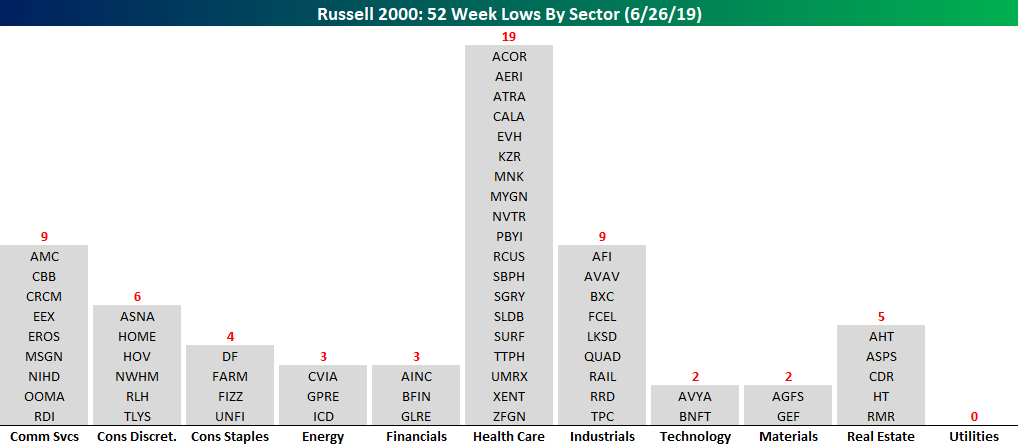
With the S&P 500 right near 52-week and all-time highs, there aren’t a lot of new lows to speak of in the index. So far today, for example, the only stocks in the index to hit a 52-week low are Iron Mountain (IRM), Kroger (KR), Macerich (MAC), and Simon Property (SPG). While the S&P 500 hasn’t seen much in the way of new lows, small-cap stocks have really lagged their large-cap peers which has resulted in significantly more stocks on the new low list. Through this afternoon, we have actually seen more than 60 new lows in the Russell 2,000.
We were curious to see if there was any specific sector driving the relatively high number of new lows in the Russell 2000, so the chart below breaks the stocks hitting new lows today out by sector. Looking at the list, we were somewhat surprised to see that the Health Care sector alone accounts for nearly a third of all the new lows today with 19. Behind Health Care, the next closest sectors are Communication Services and Industrials, each with nine. On the other extreme, not a single stock in the Russell 2000 Utilities sector traded at a new low today, but with the 10-year yield right around 2.0%, that should not come as a surprise. One sector with relatively few stocks on the new low list today is Energy with three. With oil rallying over the last few days, the sector has gotten a reprieve, but as recently as a week or two ago, there were regularly more than 30 stocks from the sector on the new low list. Start a two-week free trial to Bespoke Institutional to access our Chart Scanner tool which provides daily updates to the number of stocks hitting new 52-week highs and lows.
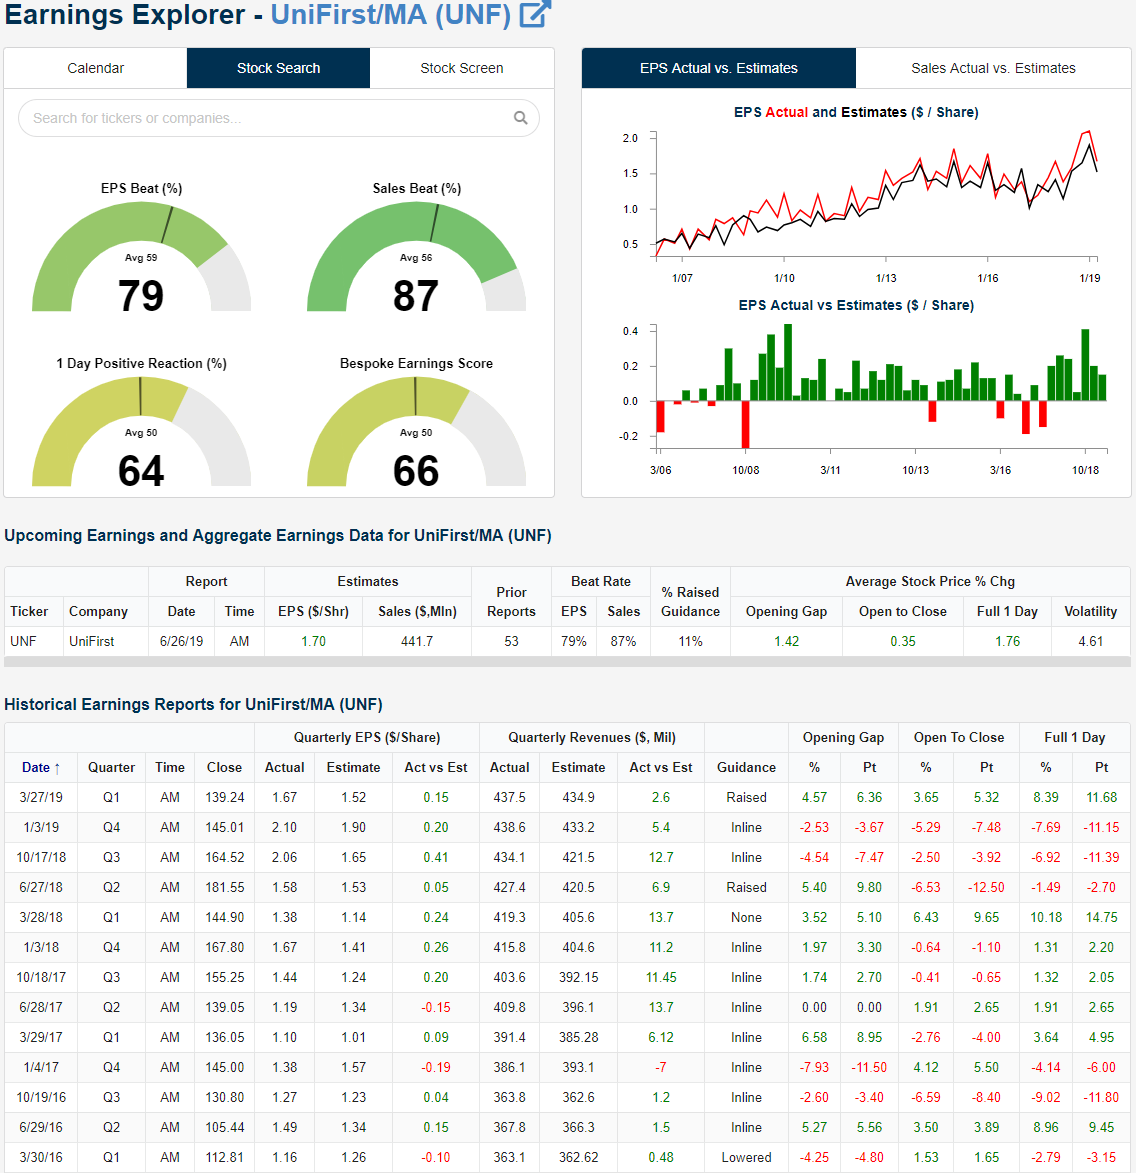
UniFirst (UNF) Ends Triple Play Drought
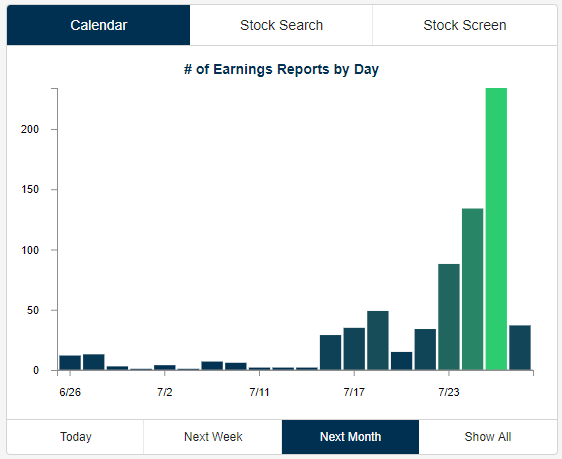
Seeing as we are between earnings seasons, the pace of earnings has been at a crawl over the past few weeks. As shown in the snapshot from our Earnings Explorer, things will more or less remain that way for the rest of June and into July with only 51 reports between now and July 15th. Afterward, things pick up when the major financials start to report their quarterly results as earnings season begins in earnest with 130 reports that week and 527 the following week.
With the caveat of small sample size, recently there have been very few earnings triple plays. This morning’s quarterly report from UniFirst (UNF), however, broke a two-week drought. Before UNF, the most recent triple play was Restoration Hardware (RH) on June 12th. We define a triple play as a beat in sales and EPS estimates in addition to the company raising guidance. We like to look at these as they can be indicative of solid fundamental health of a company.
UniFirst (UNF), a uniform/workwear rental and facility service company, saw EPS come in at $2.46, well above estimates of $1.70. Revenues were over $12 million above estimates at $453.72 mln; 6.2% growth versus the comparable quarter last year. This was UNF’s second consecutive triple play. The company cited revenues benefiting from solid organic growth and lower costs in its core business in addition to solid growth and margins in its specialty garments business (nuclear decontamination and cleanroom operations) thanks to a 2018 acquisition paying off.
In the other six triple plays in its earnings history, UNF has averaged a gap up of 6.78% followed by an average decline from open to close of 1.7%. UNF has followed this script today with the stock gapping up 7.37% and so far falling 1.28% from the open as of this writing. Start a two-week free trial to Bespoke Institutional to access our interactive Earnings Explorer tool and much more.
Fixed Income Weekly – 6/26/19
Searching for ways to better understand the fixed income space or looking for actionable ideas in this asset class? Bespoke’s Fixed Income Weekly provides an update on rates and credit every Wednesday. We start off with a fresh piece of analysis driven by what’s in the headlines or driving the market in a given week. We then provide charts of how US Treasury futures and rates are trading, before moving on to a summary of recent fixed income ETF performance, short-term interest rates including money market funds, and a trade idea. We summarize changes and recent developments for a variety of yield curves (UST, bund, Eurodollar, US breakeven inflation and Bespoke’s Global Yield Curve) before finishing with a review of recent UST yield curve changes, spread changes for major credit products and international bonds, and 1 year return profiles for a cross section of the fixed income world.
In this week’s report we look at the historic returns from international bond markets and the outlook based on current yields.

Our Fixed Income Weekly helps investors stay on top of fixed income markets and gain new perspective on the developments in interest rates. You can sign up for a Bespoke research trial below to see this week’s report and everything else Bespoke publishes free for the next two weeks!
Click here and start a 14-day free trial to Bespoke Institutional to see our newest Fixed Income Weekly now!
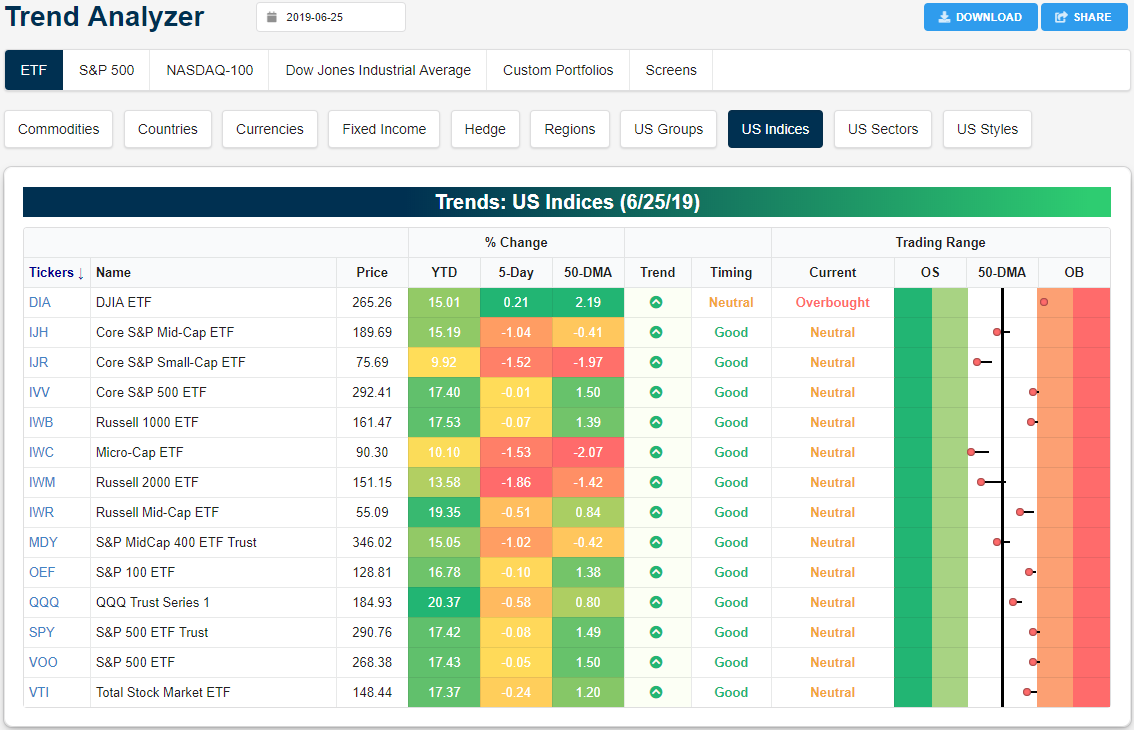
Trend Analyzer – 6/26/19 – Dow (DIA) Remains Overbought
Stocks broadly declined yesterday, although the Dow (DIA) fared slightly better than the other indices. Only declining 0.71% in yesterday’s session—versus a 0.98% decline in the S&P 500 (SPY) and 1.72% loss for the Nasdaq (QQQ)—DIA is now the only major index ETF that is still overbought and the only one to be up from this time last week. All of the other index ETFs have fallen off of overbought levels from the past few weeks and currently sit at neutral. Granted, most of this movement still leaves the ETFs on the border of neutral/overbought so it will not take much upside for a return to overbought. With this fall to neutral, all of these ETFs are also down over the past five days with losses ranging from a very small 1 bp decline for the Core S&P 500 (IVV) to a much more substantial 1.86% loss for the Russell 2000 (IWM). IWM is not alone in large losses though as other small and mid caps also have lost over 1%, also bringing them below the 50-DMA as well. Start a two-week free trial to Bespoke Institutional to access our interactive Trend Analyzer and much more.
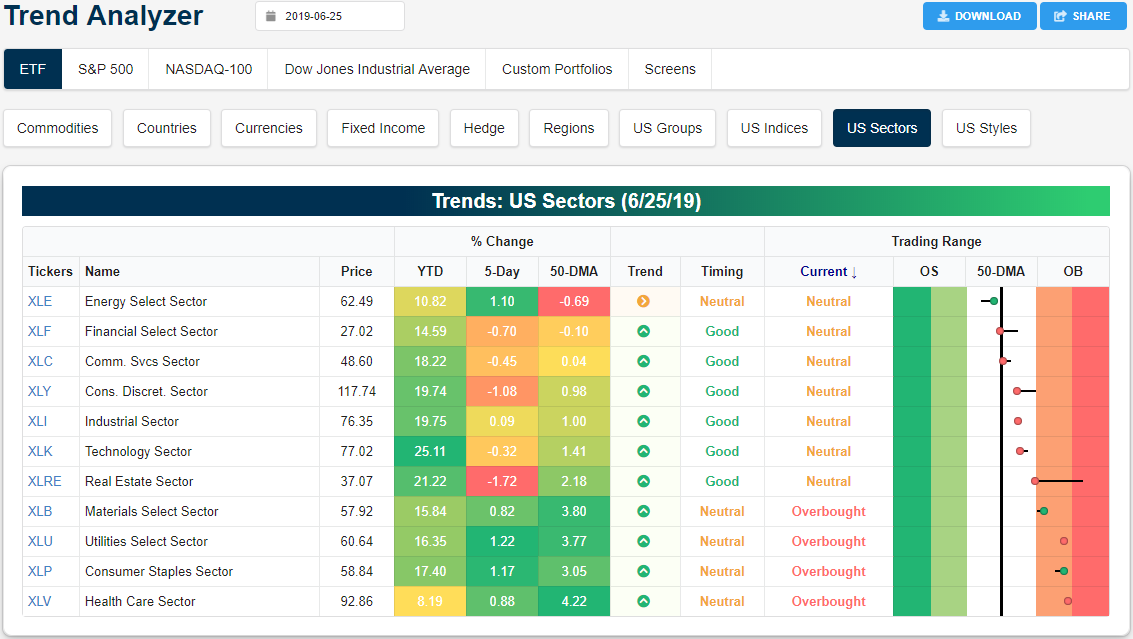
Recently, there has been a steady rotation into more defensive sectors, but in the past week this picture has become more mixed as the distinction between cyclical/counter-cyclical performance has muddied. The second best performing sector this year has been Real Estate (XLRE) with better than a 20% gain YTD but in the past week, XLRE has underperformed dramatically losing 1.72%. After sitting at extremely overbought levels last week, it has fallen sharply in its trading range and is now neutral like six other sectors. While no other sector experienced quite as large of a decline, there are four other sectors (all cyclicals) that are lower versus last week including Financials (XLF), Communication Services (XLC), Consumer Discretionary (XLY), and Technology (XLK). Each of these also sits in neutral territory along with Industrials (XLI) and Energy (XLE). XLE has been the only sector ETF to sit below the 50-DMA recently, and given this more oversold level, the sector has begun to be bought up rising 1.1% in the past week. While XLRE has fallen, there is a disconnect with other defensives—Utilities (XLU), Staples (XLP), and Health Care (XLV)—which have done well. XLU, XLP, and XLV in addition to Materials (XLB) have all outperformed the other sectors in the past week. Additionally, these four are the only sectors that have become overbought with XLV sitting just below extreme levels.