Chart of the Day: Monday Morning Meltdowns
Bespoke’s Morning Lineup – “…verge of a very dangerous situation.”
“…verge of a very dangerous situation.” Take your pick as to the litany of issues here at home and around the world that this statement could be referring to this morning, but in this case it was a quote from the Chief Executive of Hong Kong, Carrie Lam, describing the current state of tensions in that city following what has now become nine straight weeks of protests.
The big issue this morning, however, is the further escalation of the trade war as China responded to President Trump’s tweets from Thursday by reportedly instructing state-owned corporations to halt imports of US agricultural products, and more importantly, allowing the yuan to float above 7.
After a weak session of trading on Friday, global equities are in further liquidation as major Asian and European equity benchmarks are down close to 2% and US futures are trading down over 1%. Keep in mind too, that US stocks were down every day last week with the S&P 500 falling over 3%. Treasury yields are down sharply again this morning with the 10-year down to 1.77%, and the yield curve (10y/3m) is at new extremes in terms of inversion.
Continue reading in today’s Morning Lineup.
Bespoke Morning Lineup – 8/5/19

Bespoke Brunch Reads: 8/4/19
Welcome to Bespoke Brunch Reads — a linkfest of the favorite things we read over the past week. The links are mostly market related, but there are some other interesting subjects covered as well. We hope you enjoy the food for thought as a supplement to the research we provide you during the week.
While you’re here, join Bespoke Premium for 3 months for just $95 with our 2019 Annual Outlook special offer.
ETFs
Saudi stocks attract billions of dollars in inflows by Richard Henderson (FT)
Despite a relatively narrow market, MSCI’s inclusion of Saudi Arabia in its Emerging Markets Index has driven massive inflows via passive buying of Saudi stocks. [Link; paywall]
For Monster Gains With World’s Largest ETF, Trade It After Hours by Olivia Rinaldi and Vildana Hajric (Bloomberg)
Using Bespoke data, the authors highlight huge gains for after-hours outperformance for the world’s largest ETF (the S&P 500 tracker SPY). [Link; soft paywall]
Politics
Detailed Maps of the Donors Powering the 2020 Democratic Campaigns by Josh Katz, K.K. Rebecca Lai, Rachel Shorey and Thomas Kaplan (NYT)
Detailed maps that reveal the geographic strengths and weaknesses of various candidates – including the overwhelming small donor advantage of Bernie Sanders across the entire country – contesting the Democratic nomination for President. [Link; soft paywall]
Meet the people working to kick Chicago out of Illinois by Cindy Dampier (Chicago Tribune)
Despite Chicago funding huge swathes of state expenditure downstate, rural denizens of Illinois are trying to cast themselves loose of the city. [Link]
Disaster
A Natural Disaster Wipes Out Your Home. Then the Buyers Come Calling. by Konrad Putzier (WSJ)
Hurricanes, wild fires, and other catastrophes are becoming a catalyst for speculation on real estate; buyers swoop in with ready checks for homeowners who have lost everything. [Link; paywall]
The Mosquitoes Are Coming for Us by Timothy C. Winegard (NYT)
If you had to pick a cause of death for half of the humans who have ever lived, you could do worse than the mosquito, which bring malaria, yellow fever, dengue, West Nile, Zika, and more. [Link; soft paywall]
Economics
Hotels: Occupancy Rate Decreased Year-over-year, “Hotels’ rocket is losing fuel” by Bill McBride (Calculated Risk)
After years of grinding improvements in occupancy rates, revenue per available room, and prices per room, the hotel industry is starting to show its limits. [Link]
Financialisation as structural change: measuring the financial content of things by Marwil J. Dávila-Fernández and Lionello F. Punzo (Taylor & Francis)
The authors analyze the financial content (that is, value-add from financial activities) in various industries, showing a new measure of financialization and its impacts. [Link; paywall]
Opioids
The Opioid Crisis Is About More Than Corporate Greed by Zachary Siegel (The New Republic)
Headline quotes may point the finger at the pharmaceutical industry, but similar to the mortgage crisis there is no simple answer to “who is at fault” when considering the havoc wrecked by addiction to painkilling drugs. [Link]
Disabilities
A Wisconsin lawmaker who’s paralyzed isn’t allowed to call into meetings; he says that keeps him from doing his job by Patrick Marley (Milwaukee Journal Sentinel)
In Wisconsin, a state legislator has been told by other lawmakers that he cannot call in to meetings, an accommodation he requested related to the fact that he is paralyzed. [Link]
Munchies
A shocking number of delivery drivers admit doing this to your food by C. W. Headley (The Ladders)
28% of delivery drivers admit to nibbling at customers’ orders, with more than half reporting that they simply couldn’t resist the smell. [Link]
Read Bespoke’s most actionable market research by joining Bespoke Premium today! Get started here.
Have a great weekend!
The Bespoke Report — 8/2/19
This week’s Bespoke Report newsletter is now available for members.
In this week’s newsletter, we provide our thoughts on where the market is headed following Powell’s presser and Trump’s tariffs this week. To read the Bespoke Report and access everything else Bespoke’s research platform has to offer, start a two-week free trial to one of our three membership levels. You won’t be disappointed!

The Closer: End of Week Charts — 8/2/19
Looking for deeper insight on global markets and economics? In tonight’s Closer sent to Bespoke clients, we recap weekly price action in major asset classes, update economic surprise index data for major economies, chart the weekly Commitment of Traders report from the CFTC, and provide our normal nightly update on ETF performance, volume and price movers, and the Bespoke Market Timing Model. We also take a look at the trend in various developed market FX markets.

The Closer is one of our most popular reports, and you can sign up for a free trial below to see it!
See tonight’s Closer by starting a two-week free trial to Bespoke Institutional now!
July 2019 Headlines
Next Week’s Economic Indicators – 8/2/19
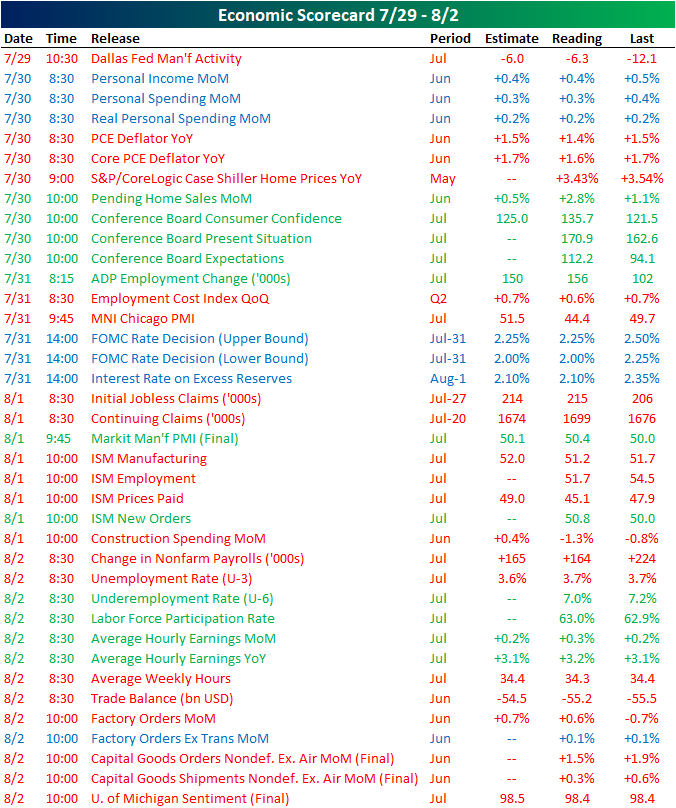
Economic data may have taken a bit of a backseat amidst the FOMC meeting Wednesday and tariff headlines at the tail end of the week, but the US still had a heavy slate with 38 total releases.
Data was broadly weaker with almost twice as many releases coming in weaker (20) than stronger (11) relative to forecasts (or the prior release when there was no consensus forecast). The Dallas Fed kicked off the week with a weaker than expected reading on manufacturing activity, but it was an improvement from June’s level of negative 12.1. In other manufacturing data, on Thursday we got Markit and ISM PMIs which were mixed. While Markit was stronger, the headline reading of ISM was weaker; new orders did improve, however. Headline factory orders were also weaker, but excluding transportation they were unchanged. As forecasted, personal income and spending weakened while inflation came in at a slower than expected pace on Tuesday. The Conference Board’s Consumer Confidence indices were the main bright spot of the week with stronger readings across the board. Claims data continued to show a slower pace of improvement on Thursday as both initial and continuing claims came in above expectations. Meanwhile, Friday’s Nonfarm Payrolls report was the most inline with expectations since October 2012, coming in only 1K below forecasts of 165K.
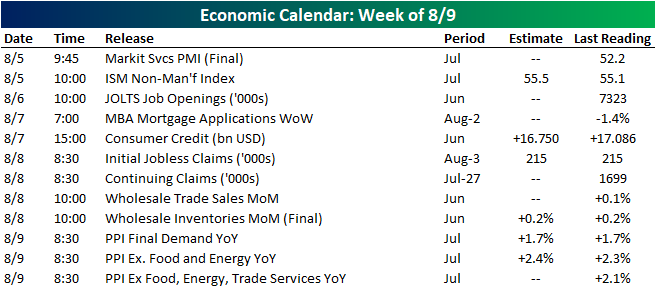
Economic data is much lighter next week. The non-manufacturing portions of ISM and Markit PMIs are due on Monday. JOLTS and consumer credit are out on Wednesday. Producer inflation gauges are set to be released Friday. Start a two-week free trial to Bespoke Institutional to access our interactive economic indicators monitor and much more.
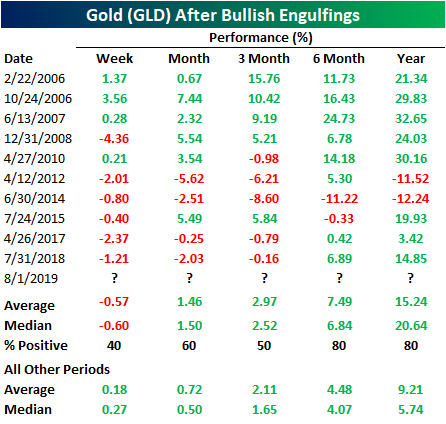
Outside Day for Gold (GLD)
Even though assets have been selling off across the board in response to Wednesday’s Fed decision and the President’s announcement of increased tariffs yesterday, there is one bullish point to be found. Yesterday, gold (GLD) had initially moved slightly lower around the open but then surged into the close, finishing the day only a couple of cents off of the intraday high. Not only did GLD fully recoup the morning’s losses, but it also gained back the previous day’s losses and then some. This outside day/bullish engulfing pattern is typically seen as a bullish technical signal.
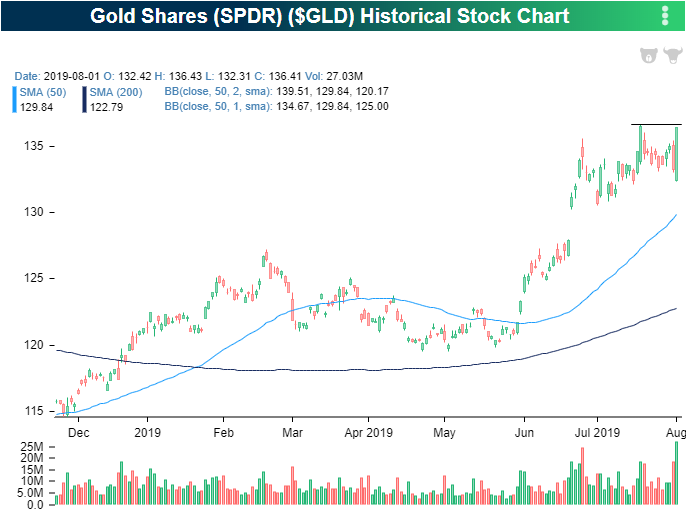
This pattern has occurred a total of 35 times in the history of the Gold ETF (GLD). Below we show the 10 previous times that this pattern was observed after not having occurred in the previous six months. Despite being a bullish setup, performance in the next week has actually had a negative bias with an average return of -0.57%. The past five times have seen a loss in the following week. Likewise, three months out sees better than average returns but the probability of GLD trading higher is the just the same as a coinflip. But, generally, in the months and year after, GLD continues to trend higher on average with more consistent gains in the next month, 6 months, and year periods. Returns are also better than normal across these time frames. Start a two-week free trial to Bespoke Institutional to access our interactive Security Analysis tool and much more.
Fakeouts
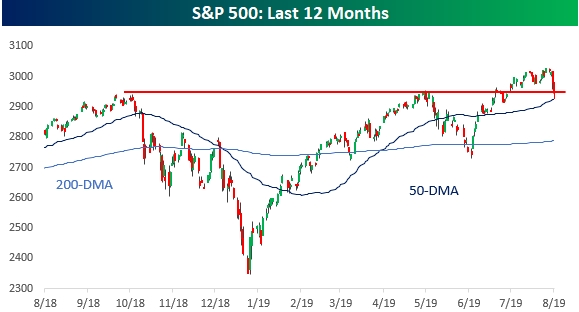
Throughout the course of the entire year, large caps have been leading the market higher, and they are the only market cap range of the equity market to actually make new highs in the most recent leg higher for equities. After this week’s pullback, though, the S&P 500 is coming perilously close to breaking through support at the prior highs from April and last fall. A close below those levels today would not be a great mood-setter for the bulls heading into the weekend.
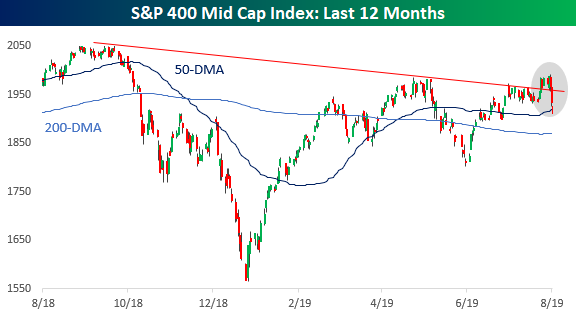
For Mid and Small Caps, the picture is even less optimistic. The S&P 400 Mid Cap index never came close to a new high in the most recent rally, but it did appear to break its downtrend from the highs late last year. But that breakout quickly turned to a fakeout this week as the S&P 400 broke back down below its prior downtrend line and is breaking below the 50-DMA today.
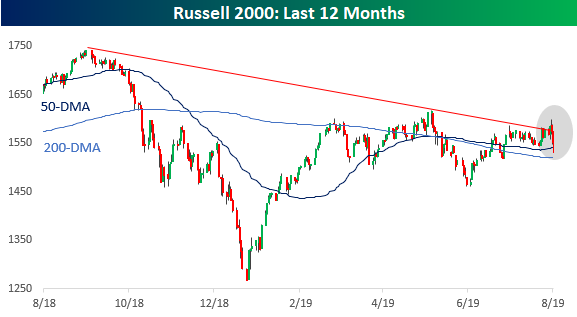
For the small-cap Russell 2000, it’s an identical picture. In this case, the break above the downtrend line was even more short-lived, and like the S&P 400, the Russell 2000 is not only back below its 50-DMA, but it also isn’t that far from breaking below its 200-DMA. Start a two-week free trial to Bespoke Premium to receive our best equity research on a daily basis and gain access to our Trend Analyzer and Chart Scanner tools.
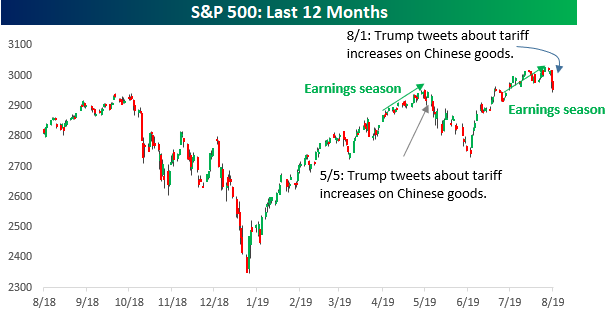
Earnings Season Déjà Vu
Is it happening again? After what has to this point been a perfectly good earnings season for the US stock market sending the S&P 500 to new all-time highs in the process, the President spoiled the party yesterday when he tweeted that a new round of tariffs would be instituted on Chinese Imports. Stocks had erased all of their declines from Powell’s Wednesday press conference by mid-day Thursday, but then the President’s tweet sent equity markets reeling with the Dow falling more than 1%, while the yield on the 10-year US Treasury fell back below 2%.
If this whole scenario sounds familiar to you, that’s because we saw the same thing last quarter. Remember back in April when the S&P 500 rallied to new highs in the early weeks of earnings season? There was a feeling then that the market was finally breaking out of its rut and on the path to a sustained breakout. But then over the first weekend of May, on a Sunday afternoon no less, the President sent out a series of tweets outlining his plan for increased tariffs on Chinese imports. The following Monday, the market opened lower and kept falling throughout the month. By the end of May, the S&P 500 was down 6.6% for the month, making it the worst May for the S&P 500 since 2010. August has historically been an iffy month for the stock market as many on Wall Street take vacations and try to relax, but if the market follows the earnings season script from last quarter, this will be an August of little rest. Start a two-week free trial to Bespoke Premium to receive our best equity research on a daily basis.