Small Claims Change
Today’s initial jobless claims release was expected to come in unchanged from last week’s reading of 215K. Instead, claims fell to 209K while last week’s data was revised up to 217K. After reaching recent highs in June, initial jobless claims been in a tight range between 208K and 217K all summer with this week’s print being at the low end of this range. Claims also held onto their record streaks below 250K and 300K at 96 and 213 weeks, respectively.
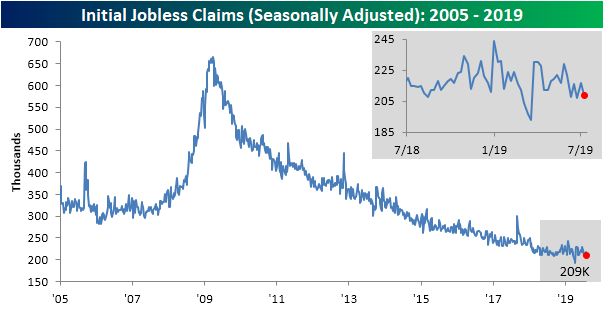
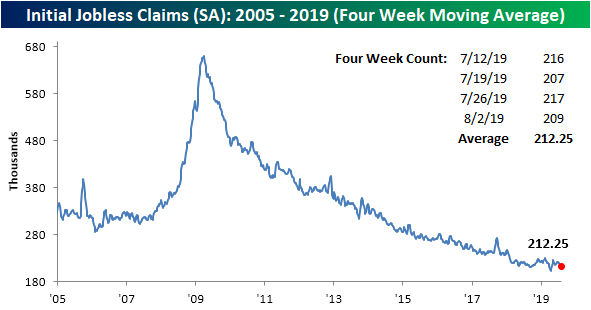
Despite the lower reading this week in the seasonally adjusted number, the four-week moving average actually moved up ever so slightly to 212.25K compared to 212K last week. Even with the increase, though, the four-week moving average remains right near its lows for the cycle.
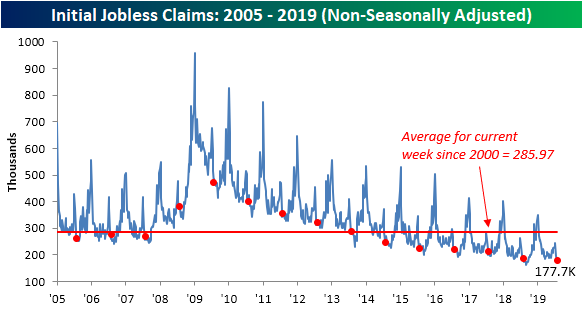
On a non-seasonally adjusted basis, claims also saw a very small change only falling 0.2K to 178.7K. That is the smallest week-over-week change for any week since last October. For the current week of the year (31st week), this was the smallest absolute change week over week since 1986 when it rose by 0.2K. In the history of the data, the current week of the year has averaged a decline of 16.65K as the indicator is usually still working off of its seasonal peak from a few weeks prior. Despite the minor move lower, at the current level, unadjusted claims are now at the lowest levels since the post-recession cycle lows reached last September. Overall, although it continues to reaffirm labor market strength, this week’s release also further epitomizes the slower pace of improvement that we have recently seen in the labor market. Start a two-week free trial to Bespoke Institutional to access our interactive economic indicators monitor and much more.
Austria.com
Following recent moves in financial markets in the last few days, there are some pretty nutty looking charts out there, but one that sticks out more than most others is the performance of the Austrian 100-year bond. Launched in late 2017 with a yield of 2.1%, there were more than a few people who laughed at the fact that anyone would lend money to any government for a hundred years at an annual coupon of just 2.1%. Well, the only people laughing now are the ones who bought it. Since inception, the Austrian 100-year has seen a rally of 84.1% and that doesn’t even include the precious 2.1% coupon. Just this year, the bond has rallied 58%, and since the end of Q2, it has rallied 18.5%. It’s up almost 8% in August alone!
Today, the rally in fixed income has run out of steam and the price of the bond is down nearly 4%. If those losses hold, it would be the worst one-day decline for the bond since May 2018. Is this the beginning of the end in the fixed income rally? Who knows. And while we would probably stay away from a security like this, we stayed away back when it launched too. Start a two-week free trial to Bespoke Premium to access Bespoke’s most actionable research reports.

Where FAANG Sits
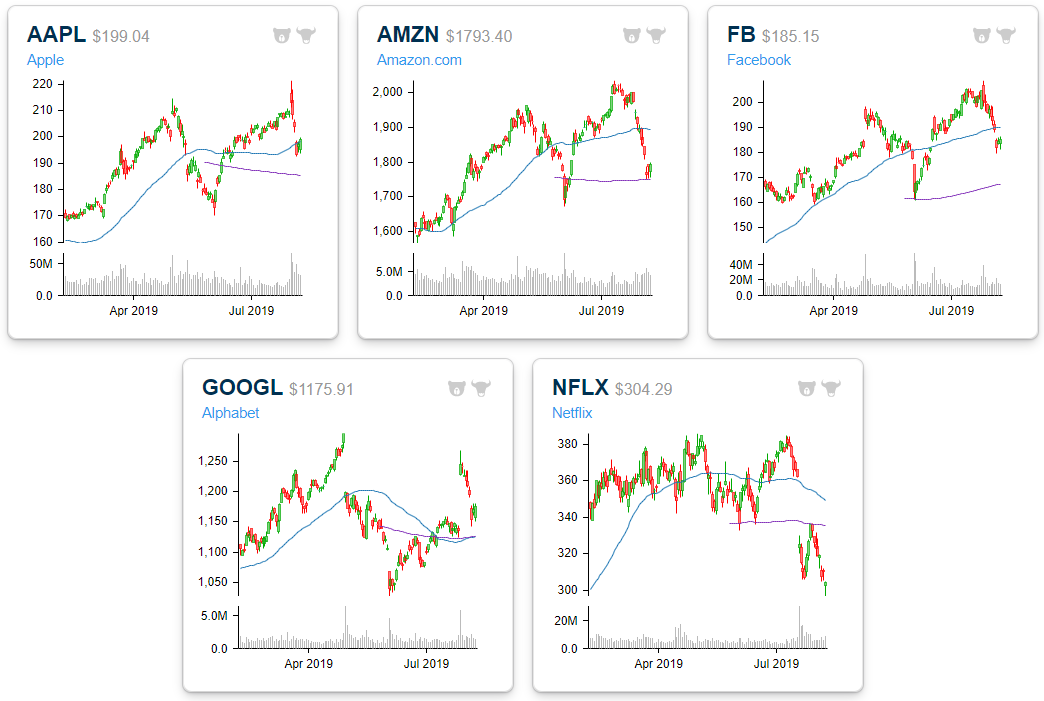
For those keeping score, Apple (AAPL) has been the worst performing FAANG stock over the past week with a decline of 6.57%. Netflix (NFLX) is down the second most at -5.79%, while Alphabet (GOOGL) has held up the best with a drop of 3.47%. All five have of course moved lower within their trading ranges over the last week, but NFLX is the most oversold, while Amazon (AMZN) is also trading just into oversold territory. Even with its recent drop, Apple (AAPL) has managed to hang above support at its 50-day moving average. Start a two-week free trial to Bespoke Premium to access Bespoke’s most actionable research reports.

Below is a look at six-month price charts for the five widely-followed FAANG names. While AMZN has broken below its 50-day moving average, it has managed to hold above support at its 200-day this week. Netflix, on the other hand, is well below both its 50-DMA and its 200-DMA, and the last time it tested its 200-DMA, it failed miserably.
Trend Analyzer – 8/8/19 – Defensives Hold
As stocks bounced back intraday yesterday, the major index ETFs held firm in neutral territory, but still remain below their 50-day moving averages. Only the Russell 2000 (IWM) and Micro-Cap ETF (IWC) remain oversold, with IWC over 2 standard deviations below the 50-DMA. IWC has by far been the weakest ETF of this group over the last week with a decline of more than 5%. IWM has been the next worst performer falling 4.62%. Although everything is down, large-cap indices like the Dow (DIA) have seen lesser—but still over 3%—declines.
Of the individual sectors, given the macroeconomic tensions in the past week, there has been continued rotation into defensives. Both the Utilities Sector ETF (XLU) and Real Estate Sector ETF (XLRE) have actually risen over 1% in the past five days. XLRE’s gains have even brought it into overbought territory. While Consumer Staples (XLY) did not rise like these two, it is also one of the only ETFs that is still above its 50-DMA. Meanwhile, Energy (XLE) has been the worst performer falling over 7% over the last week. Now over 6% below its 50-DMA, it has reached extreme oversold territory thanks to weakness in oil. XLE is also the only sector ETF to show a downtrend in our Trend Analyzer. Start a two-week free trial to Bespoke Institutional to access our Trend Analyzer and much more.

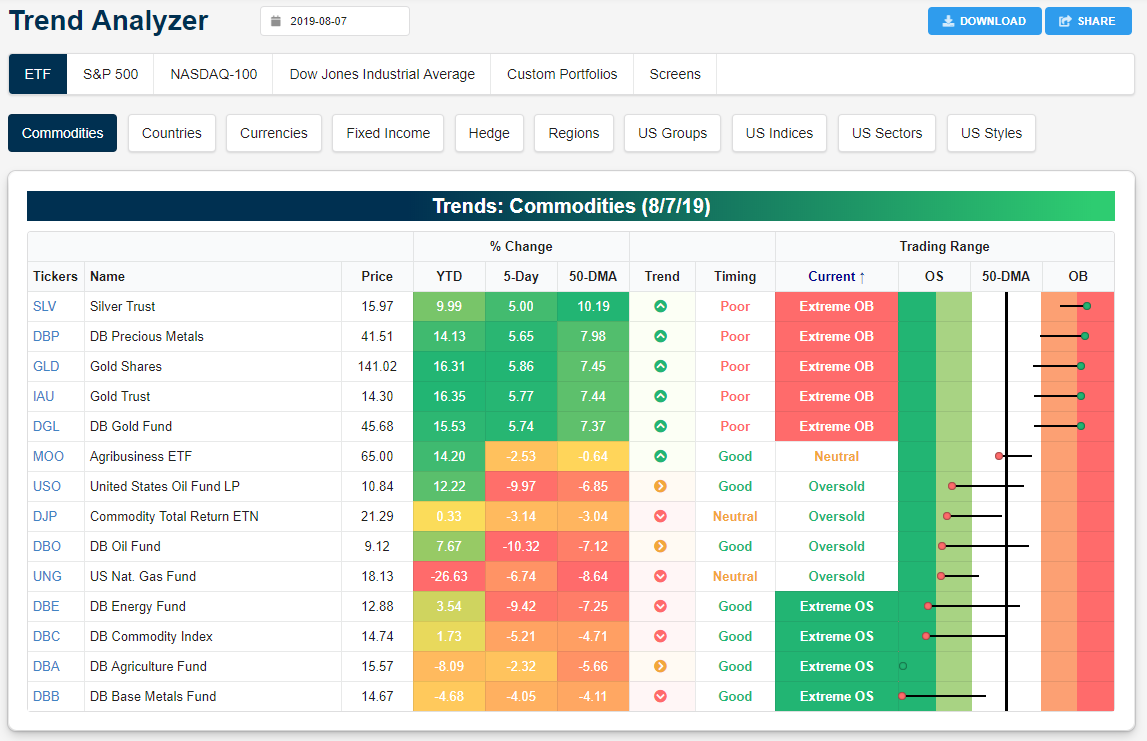
Commodities Internal Divergence
We’ve seen some interesting trends in the commodities space over the last few weeks. As shown in the snapshot from our Trend Analyzer tool below, the precious metals group has been surging higher and now sits in extreme overbought territory, while the energy and agriculture groups sit in extreme oversold territory.
Both gold (GLD) and silver (SLV) are up 5%+ over the last week, and they’re now 7%+ above their 50-day moving averages. This has left them more than two standard deviations above their 50-day moving averages. Even though our trend algorithm now shows them as being in 6-month uptrends, the fact that they’re so extended to the upside gives them a “poor” timing rating. An investor looking to get long the space would be better served waiting for some downside mean reversion.
On the flip-side, base metals (DBB), agriculture (DBA), and energy (DBE) are down 4%+ over the last week and more than two standard deviations below their 50-day moving averages. While they’re noted as being in either sideways trends or downtrends, the fact that they’re so oversold gives them a “good” timing rating. An investor that has recently seen their actual allocation slip below their target allocation to these areas could add exposure here given how oversold they are.
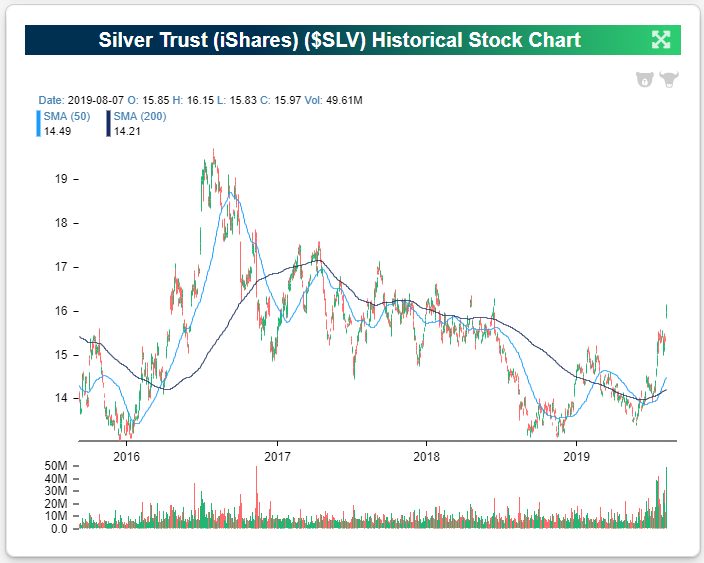
Below is a six-month chart of the silver ETF (SLV) from our Security Analysis page. Yesterday was a very impressive breakout with a big gap higher.

The long-term chart of SLV going back to 2016 looks much different, however. The recent move higher barely puts a dent in the declines seen from mid-2016 to late 2018. But one thing the recent move higher has done is break the multi-year downtrend that was in place. The recent series of higher highs and higher lows is a promising sign for SLV bulls.
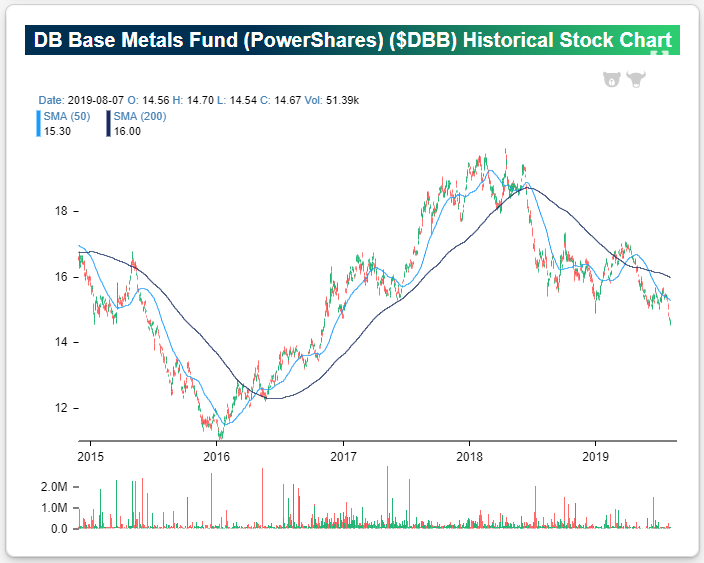
The most oversold commodity ETF right now is Base Metals (DBB). It’s literally falling off the chart.
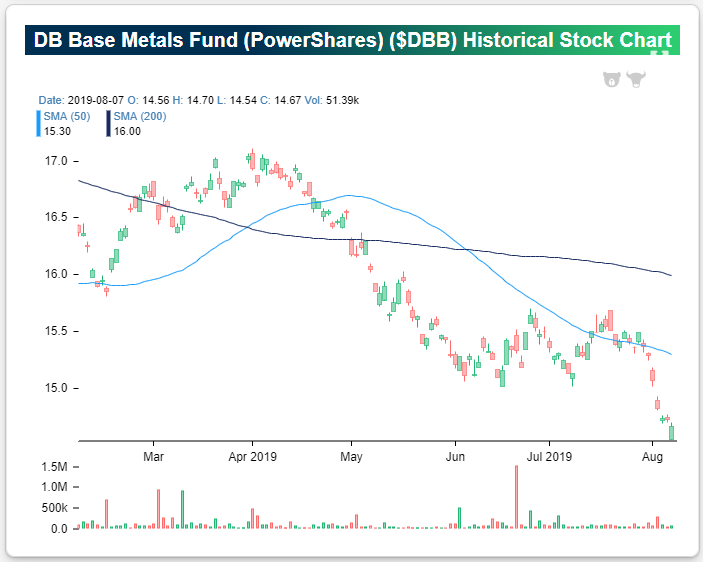
Longer-term going back to 2015, DBB is still well above lows seen in early 2016, but it continues to make lower lows on a regular basis. The drop seen over the last week marked another significant breakdown. Start a two-week free trial to Bespoke Premium to access Bespoke’s most actionable research reports.
Bespoke’s Morning Lineup – China Headlines Subside (For Now)
After a rocky few days for global financial markets, there’s an eerie sense of calm in the market today as both US futures and treasury yields are little changed (but depending on when you read this, there’s a good chance that things could change). Oil is trading higher by close to 2% after reports yesterday that Saudi Arabia has put all options on the table in its efforts to stop the decline in crude oil prices, while gold is down nearly 1% but still above 1,500 per ounce as the flight to safety is on hold for now. Continue reading in today’s Morning Lineup.
Bespoke Morning Lineup – 8/8/19

The Closer – Just Another Flat Day for Equities and Treasuries – 8/7/19
Log-in here if you’re a member with access to the Closer.
Looking for deeper insight on markets? In tonight’s Closer sent to Bespoke Institutional clients, we recap the dramatic price action in the major indices and Treasuries, putting into context the strong intraday reversals. Turning to commodities, we then take a look at the divergence between gold and copper prices. We also show S&P 500 performance when the metals have acted as they have. We finish tonight with a recap of today’s bearish EIA data print.

See today’s post-market Closer and everything else Bespoke publishes by starting a 14-day free trial to Bespoke Institutional today!
Chart of the Day: Buy Disney’s Sequel
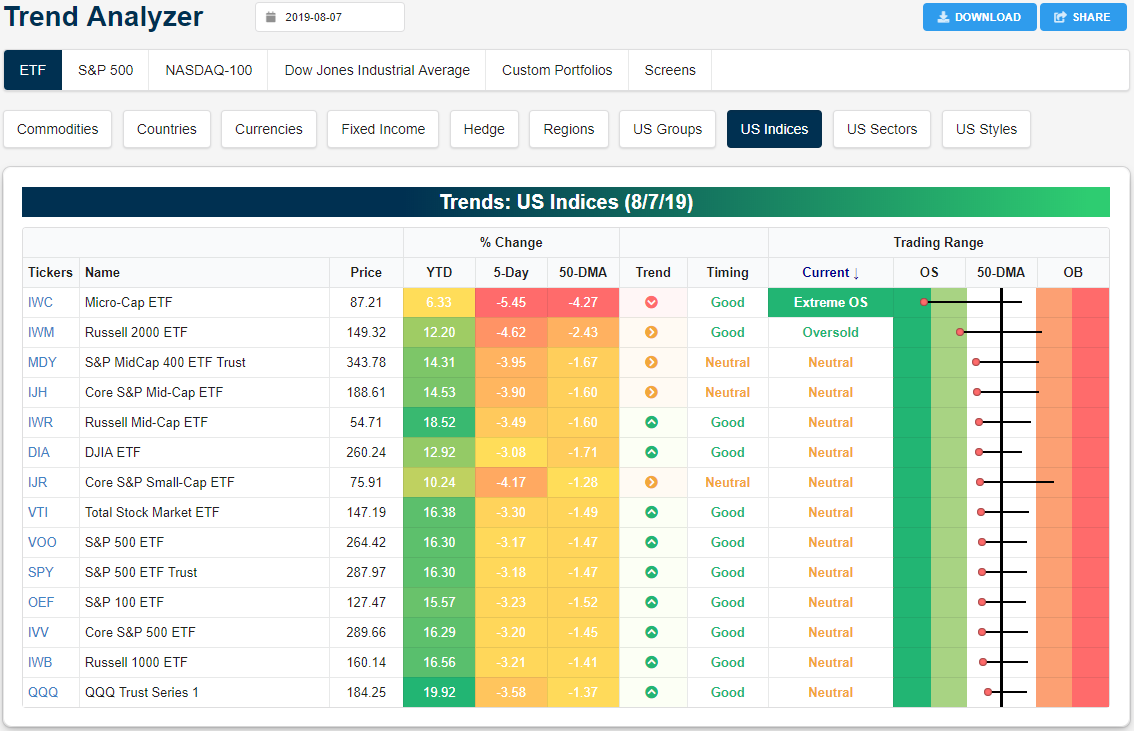
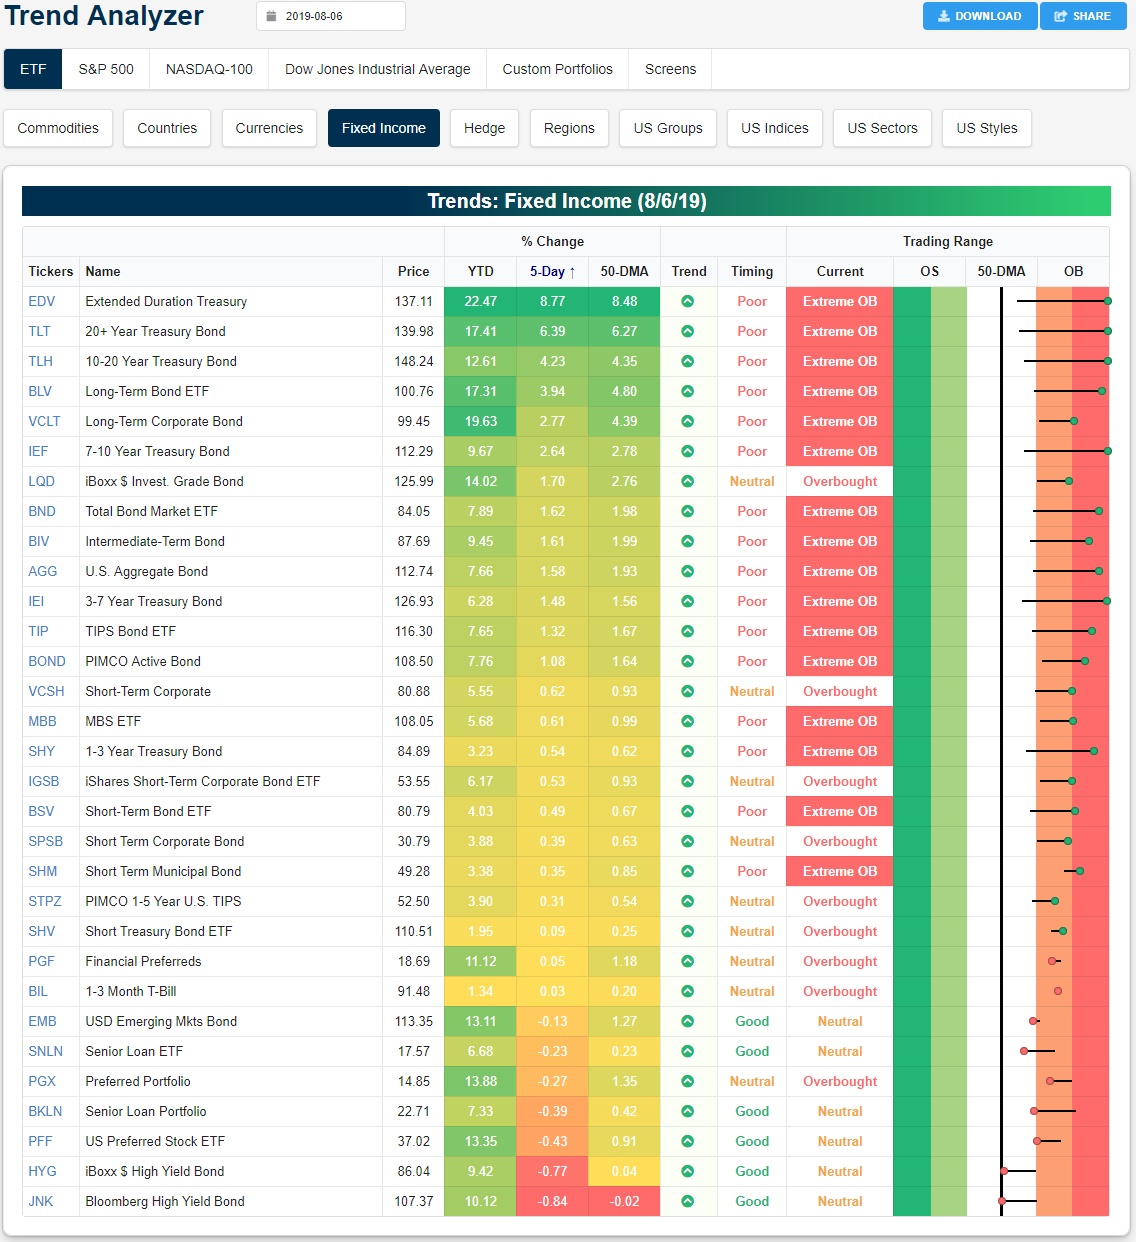
Trend Analyzer – 8/7/19 – Fixed Income Running Hot
Although major equity indices managed a modest rebound yesterday, they all still sit over 4% lower versus last week. The Micro-Cap (IWC) has seen even worse declines in this time with a decline of 6.52%. IWC is also the only major index ETF in extreme oversold territory and in a downtrend over the past six months. While the Russell 2000 (IWM) is also oversold, the rest of the ETFs have actually moved into neutral territory following yesterday’s gains. But keep in mind the fact that one week ago, all of these ETFs were overbought across the board.

While risk assets have gotten hit hard, fixed income has been surging. So much so that of the 31 fixed-income ETFs in our Trend Analyzer, 15 are now over 2 standard deviations above the 50-DMA. Medium to long term treasury ETFs tracking the 3-7 year (IEI), 7-10 year (IEF), 10-20 year (TLH), 20+ year (TLT), and the Extended Duration Treasury (EDV) are all even more extended at over 3 standard deviations above the mean. These have also gained the most in the past week with EDV seeing the largest gains at 8.1%. Meanwhile, high yield credit has declined. The Bloomberg High Yield Bond ETF (JNK) and iBoxx High Yield Bond ETF (HYG) have fallen 1.43% and 1.36%, respectively. Senior loans (SNLN) and Preferred Stock (PFF) have also fallen. Start a two-week free trial to Bespoke Institutional to access our interactive Trend Analyzer and much more.
Bespoke’s Morning Lineup – The Death of Yields
Global equities were trying to stabilize around the world overnight and this morning. Chinese equities were modestly lower, Japanese stocks were mixed, and Europe was rallying. US futures, for their part, were positive but have now given up all of those early gains and are firmly negative. Oil is modestly lower, precious metals like gold and silver are breaking out, while cyclical metals like copper are flat and iron ore is in free fall with a five-day decline of over 20% as trade fears hurt the outlook for global growth. The real story this morning is the collapse in yields both here in the US and around the world.
Continue reading in today’s Morning Lineup.
Bespoke Morning Lineup – 8/7/19