Brunch Reads – 8/3/25
Welcome to Bespoke Brunch Reads — a linkfest of some of our favorite articles over the past week. The links are mostly market-related, but there are some other interesting subjects covered as well. We hope you enjoy the food for thought as a supplement to the research we provide you during the week.
Hoops History: Before the NBA became the global force it is today, professional basketball in the US was fragmented. Two rival leagues, the Basketball Association of America (BAA) and the National Basketball League (NBL), were vying for talent, fans, and legitimacy. The BAA had the big-city arenas and a vision of professional sports entertainment, while the NBL had the basketball pedigree, with strong Midwestern roots and better talent. However, both leagues were hemorrhaging money and poaching players, and the post-war economy couldn’t support two competing professional leagues.
On August 3, 1949, in a modest meeting held in New York City, executives from both leagues agreed to a merger. The new league, formed from six surviving NBL teams and the ten BAA franchises, would be called the National Basketball Association (NBA). The name was simple. But it marked the formal birth of what would become a cultural juggernaut. Teams like the Minneapolis Lakers (with a young George Mikan), the Rochester Royals, and the Syracuse Nationals joined forces with the Boston Celtics, New York Knicks, and Philadelphia Warriors.
The NBA didn’t become a sensation overnight. Attendance was modest, teams folded, and some doubted it would last. Today, the NBA is a $10+ billion enterprise that rivals any sports league in the world. Its games draw millions of viewers annually. Player contracts routinely exceed $200 million, and the league’s next media rights deal is expected to surpass $70 billion over the next decade. Michael Jordan elevated the NBA to a global stage in the 1990s, turning basketball into a worldwide language. Kobe Bryant’s legacy helped cement the league’s popularity in places like China, while LeBron James has redefined the influence of athletes in the 21st century. The NBA now operates academies across multiple continents, hosts preseason games abroad, and boasts international stars like Giannis Antetokounmpo, Luka Dončić, and Victor Wembanyama.

Science & Space
Large-scale processing of within-bone nutrients by Neanderthals, 125,000 years ago (ScienceAdvances)
Neanderthals at a lakeside site in Germany were systematically hauling in fat-rich bones from horses, deer, and cattle-sized animals to crush and boil for grease. The remains, over 100,000 shattered fragments, show signs of deliberate butchery, marrow extraction, and fire use, all packed into a tight area that may have served as a kind of seasonal processing hub. This kind of organized, labor-intensive fat harvesting pushes the timeline way back on behaviors we usually associate with much later humans. [Link]
Continue reading our weekly Brunch Reads linkfest by logging in if you’re already a member or signing up for a trial to one of our two membership levels shown below! You can cancel at any time.

Daily Sector Snapshot — 8/1/25
Top Quotes from Today’s Earnings Calls: 8/1/25
We sifted through earnings calls from the biggest companies that reported since last night’s (7/31) close, looking for some of the most interesting macro-related quotes from management teams that may serve as broader signals about the state of the economy, consumers, and markets. Below are twenty of the most revealing quotes that we pulled from this batch of calls, offering a window into what executives are seeing across industries and geographies right now.
- Amazon (AMZN): “What we can tell you is what we’ve seen so far in the first half of the year, we just haven’t seen diminished demand. And we haven’t seen any kind of broad-scale ASP increases. And so that could change in the second half. There are a lot of things that we don’t know, but that’s what we’ve seen so far.” – Andy Jassy, CEO
- Apple (AAPL): “You are going to see an increase in CapEx. We also, from time to time, have other investments in facilities, in toolings, but I would say a significant portion of the driver of growth that you’re seeing now is really driven by some of our AI-related investments.” – Kevan Parekh, CFO
- Clorox (CLX): “At the same time that you see this value seeking and you see this uncertainty behavior from consumers… you also see this really made accentuated trend right now on convenience and experiences. Consumers are still buying things and experiences they like. You’re still seeing them do things outside their home, go back to eat, et cetera. We’re seeing significant move to convenience. We’re seeing all these dynamics of consumers having to manage the uncertainty, which is meaning they’re moving their dollars in their wallet across different places and they’re doing it very, very dynamically.” – Linda Rendle, CEO
- Eastman Chemical (EMN): “There are unfair trade practices around the world, and there is aggressive dumping by some countries, especially overcapacity out of China and transshipping to avoid tariffs… But those, while very serious, need a strategic approach, and the challenge… is that trade strategy applying to all countries in the world at the same time may create more economic harm than what’s necessary… You’ve got a lot of volatility of imports going up, private inventories dropping, there are people who are moving product all over the world to try and get ahead of tariffs… It’s really chaotic to try and understand what’s really going on in end-market demand.” – Mark Costa, CEO
- Lumen Technologies (LUMN): “The global AI race is a matter of economic development and national security for the United States. We are pleased with the administration’s AI action plan and recent tax legislation, which not only reduces regulatory barriers and helps accelerate our current network build-out, it also provides us with additional capital to invest in our nation’s digital infrastructure.” – Kathleen E. Johnson, CEO
- Magna (MGA): “Most of the policy impacts are secondary impacts, right, like the EV credits going away, and therefore, the consumers may be not buying as many EVs… But on the other hand, if it increases hybrid and ICE vehicle sales, then we are part of the equation there… If the BEVs come back… the investment is behind us, and we would see that as a tailwind going forward.” – Seetarama Kotagiri, CEO
- World Kinect Corporation (WKC): “The power business, we all know the electrification of the economy [is improving]. That’s going to continue to grow at 50% or more… And then sustainability within carbon, that is something that has been highly politicized, but it’s not going away. I mean there is going to be a continuing market for that. You’ve got mandates that are coming through regardless of what certain countries are doing or certain parts of the world. States have got different activities. It’s complicated the carbon accounting.” – Michael Kasbar, CEO
- DXC Technology (DXC): “We are in the era of experimentation. All of us are trying it in many ways. There is no way to learn other than doing. So curiosity is king here… this isn’t a plug-in and just accelerate an existing process. This will be rethinking every process using AI to replicate human functions, using AI to augment human intensity by lowering operational intensity.” – Raul Fernandez, CEO
- KLA Corporation (KLAC): “This environment is new to our industry and the long-term tariff situation remains unclear… we’re now facing the likelihood of higher structural tariffs… there are some business processes as it relates to how we move parts around, how do we leverage free trade zones… if it drives structural cost increase, then that’s something that we’ll have to deal with… if you add in the economic cost of incremental tariffs, all of a sudden, some of those issues rise up the priority scale.” – Bren Higgins, CFO
- Paramount Global (PARA): “Live sports are more valuable today than ever before, across both platforms. This year’s Final Four was the most watched in eight years, and CBS’s sports golf coverage in 2025 is up 13% year-over-year. It’s best performance in seven years.” – Chris McCarthy, CEO of Showtime
- Stryker (SYK): “[Ambulatory Surgical Centers are] not going to stop because it actually lowers the cost of health care. It’s a pleasurable experience for the surgeons. It’s a pleasurable experience for the patients. And I could see that healthy patients like to go to a place like this where there aren’t sick people. And so I absolutely see this trend continuing… I think you’ll see it across all specialties.” – Kevin Lobo, CEO
- Arthur J. Gallagher (AJG): “Within the US, we are seeing continued job growth, just not quite at the robust levels we saw during 2024. Additionally, trends from health insurance carriers continue to indicate ongoing increases in medical utilization and treatment costs. Our benefit professionals are well positioned to guide employers through these many challenges.” – J. Patrick Gallagher, CEO
- Colgate-Palmolive (CL): “I think one of the things we’re seeing both in the US and around the world is the inflation has hit food a little bit quicker than it’s hit other products. And as a result of that, consumers are spending more money on their food choices and as a result, perhaps be more cautious in other categories right now.” – Noel Wallace, CEO
- Telus (TU): “At some point, the market has to shift from irrational to rational… it’s just not sustainable to have that level of irrationality leading to negative NPV outcomes… Eventually, given the amount of capital that we deploy within our industry, I think economics have to drive our pricing decisions.” – Darren Entwistle, CEO
- CNH Industrial (CNH): “There is another conversation that hasn’t yet really revealed much detail and that is the trade deal between China and the US. We have recently observed on our side that China has removed some 600 extensions for tariff reductions from their import policy and that could go both ways. This could mean that there will be a trade deal between China and the US coming soon also including commodities. But it will also mean that this is not anymore possible for the US to import commodities to China. So, we don’t know really how that will play. And both has obviously impact on the Brazilian farmers who will improve, I think, their financial health next year and who will continue to purchase maybe at higher levels also next year their machines. But we need these certainties, particularly Brazil, US and China, US when it comes to commodity imports and exports.” – Gerrit Marx, CEO
- WW Grainger (GWW): “We do believe that market demand’s going to be relatively muted, and we’ve taken that down as well, and that’s just a reflection of what we think tariff price increases are likely to do for the market. We also think that’s temporary.” – D.G. Macpherson, CEO
- Edison (EIX): “We know the state knows that the underlying wildfire risk, again, broadly for the state, not just utility ignitions, but wildfire risk is only going to increase with climate change. I remind you that the adapting for tomorrow, white paper that we put out… said, that by 2050, California is [could see] as much as 3 feet of average sea level rise and 7x more the kind of hot days that today are in the top 1% and more floods and more droughts. And importantly, the risk of 20% more wildfire ignitions across all causes. So it’s imperative to this state be able to prepare for that risk that we know is coming and it’s going to be made worse by climate change.” – Pedro Pizarro, CEO
- Kimberly-Clark (KMB): “I do see purchasing power under pressure, for consumers. And frankly, we don’t really see a catalyst for that dynamic to change in the near to medium term… demand remains resilient and the categories continue to demonstrate durable growth, and that’s kind of a big deal.” – Mike Hsu, CEO
- Fluor (FLR): “Over the past couple of months, we’ve seen more clients continue to take a wait-and-see approach due to a variety of reasons, including ongoing trade policy discussions and developments, cost escalation and interest rates. In a few cases, we’ve seen project cancellations or extended deferrals.” – James Breuer, CEO
- LPL Financial (LPLA): “The primary driver [of lower client cash balances]… is just the denominator growing, right? We’ve got a strong equity market… almost $100 billion on average for the last several quarters in a row. So you just have the denominator growing. Cash balances themselves have been pretty stable around $5,000 per account for quite some time.” – Matthew Audette, CFO
The Bespoke Report – 8/1/25 – It’s a Two Way Street
To read our weekly Bespoke Report newsletter and access everything else Bespoke’s research platform offers, start a two-week trial to Bespoke Premium. In this week’s report, we cover the market running out of steam after a relentless rally, a lackluster response to earnings season, and much more.

Jobs Day In Four Charts
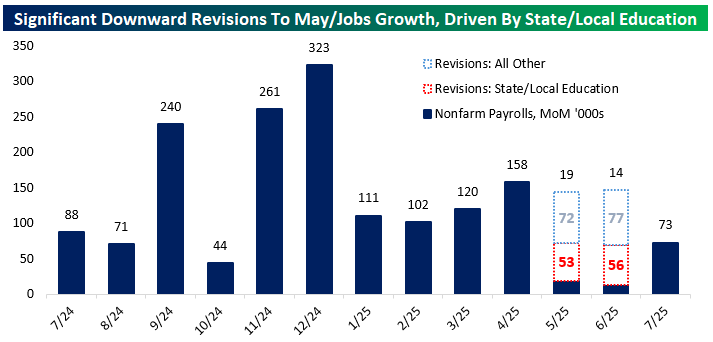
While payrolls announced by the BLS for July missed (+73k versus +104k estimated), the bigger story was revisions. A combined 258k jobs were revised out of May and June numbers, taking those months’ NFP prints to +19k and +14k respectively. Almost half of the revisions lower came from state and local government education, which accounts for less than 7% of total employment.
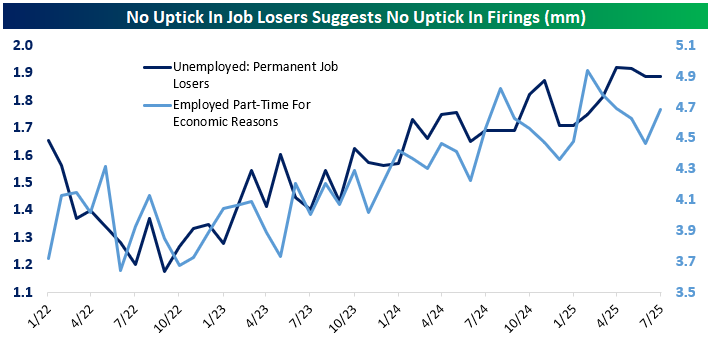
While jobs growth has slowed, there’s been no major uptick in unemployment due to job loss or more workers only part-time because they can’t find full-time work.
Labor income (employment times wages times hours) was also up over 7% annualized on the month and is up at 3.7% annualized on a 3m/3m basis that is similar to 2019’s nominal growth rate. Labor income has certainly slowed, but it’s not cratering in a way that would drive sharp pullbacks in spending despite the slow jobs growth.
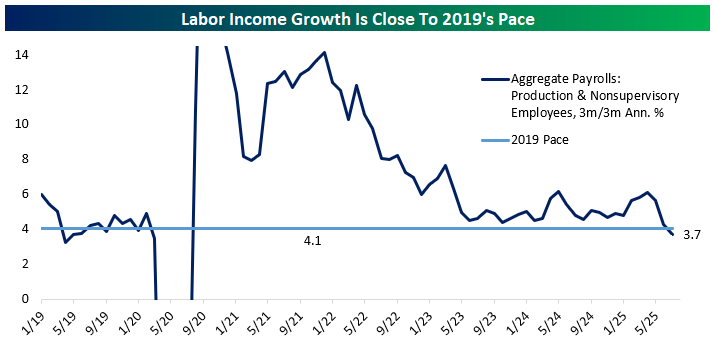
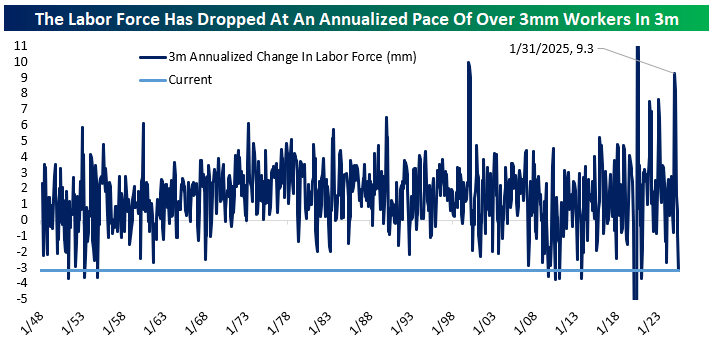
Since the Global Financial Crisis, labor market data has broadly been viewed as an insight to the demand side of the labor market. But the current context is quite different: unemployment remains low, while labor supply is falling. The last 3 months saw a 3.3mm annualized decline in the labor force, driven by immigration policy and to a lesser extent demographics. As a result, slow job creation is much less concerning than when labor supply is rising.
Like this analysis? Read more in this week’s Bespoke Report newsletter. Click here to start a trial to one of our three membership levels for access.

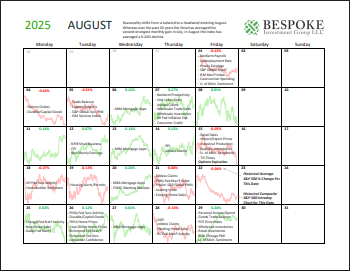
Bespoke Market Calendar — August 2025
Please click the image below to view our July 2025 market calendar. This calendar includes the S&P 500’s historical average percentage change and average intraday chart pattern for each trading day during the upcoming month. It also includes market holidays and options expiration dates plus the dates of key economic indicator releases. Click here to view Bespoke’s premium membership options.
Q2 2025 Earnings Conference Call Recaps: Cloudflare (NET)
Bespoke’s Conference Call Recaps use AI to summarize lengthy earnings calls. The commentary below is AI-generated and then edited by Bespoke for quality control. As always, none of these summaries should be construed as recommendations to buy or sell any securities, and investors should do their own research and/or consult with a financial professional before making any investment decisions.
Our latest recap available to Bespoke subscribers covers Cloudflare’s (NET) Q2 2025 earnings call.
![]()
Cloudflare (NET) is a cloud platform that secures and accelerates internet applications without adding hardware, software, or complexity. It offers a suite of services, including website and application performance optimization, DDoS mitigation, Zero Trust security, and developer tools like Workers AI. The company serves businesses ranging from startups to Fortune 500 enterprises, as well as public sector clients. Cloudflare is at the center of key internet trends like cybersecurity, AI infrastructure, edge computing, and the evolving economics of online content. Cloudflare posted $512.3M in revenue (up 28% YoY) and crossed a $2B run-rate, driven by surging demand from large customers, 3,712 now spend $100K+, up 22%. A standout $15M deal saw a leading AI company shift all inference workloads from a hyperscaler to Cloudflare. CEO Matthew Prince highlighted Act Four: building a monetization framework between AI platforms and online publishers, positioning Cloudflare to power the “Agentic Web.” Sales execution also improved, with record pipeline growth and increased productivity. Dollar-based net retention rose to 114%. NET shares popped 6.6% after hours on 7/31 but fell 4.3% at the open on 8/1 despite the triple play earnings…
Continue reading our Conference Call Recap for NET by becoming a Bespoke Institutional subscriber. You can sign up for Bespoke Institutional now and receive a 14-day trial to read our newest Conference Call Recap. To sign up, choose either the monthly or annual checkout link below:
Key ETF Asset Class Performance
The market ended the month of July on a down note, but the S&P 500 (SPY) still ended the month with a gain of 2.3%. The Dow (DIA) only gained 0.2%, however, while the Tech-heavy Nasdaq 100 (QQQ) gained 2.4%. While the cap-weighted S&P gained more than 2%, the equal-weight version of the index (RSP) gained just 1%.
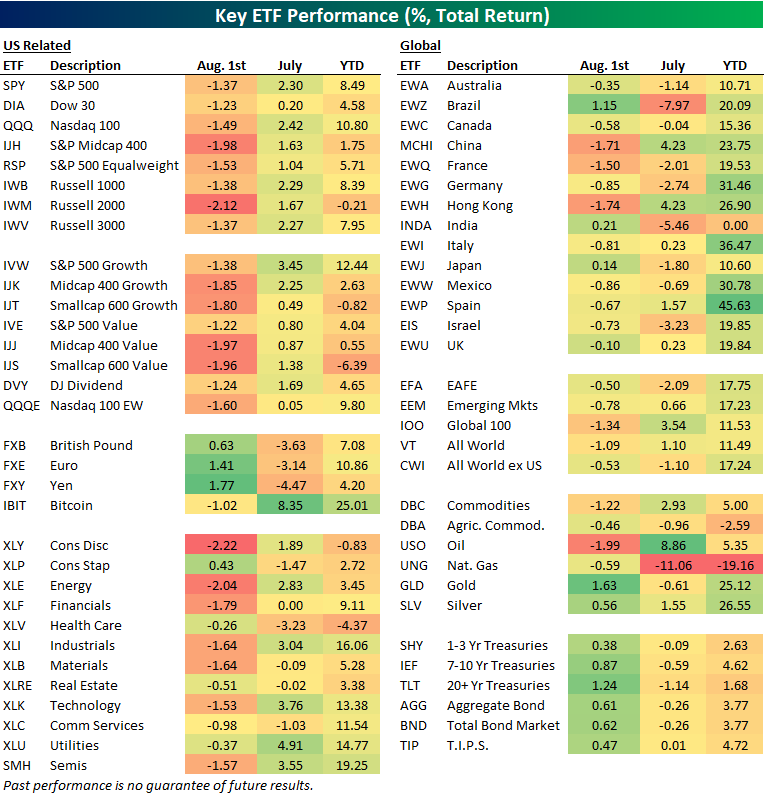
Above is a look at recent performance across asset classes using our key ETF matrix. For each ETF, we show its year-to-date change through July, its performance in July, and its performance today on the first trading day of August.
While domestic equities posted small gains in July, there was quite a bit of disparity among international markets. The all-world ex US ETF (CWI) actually fell 1.1% in July, while countries like Brazil (EWZ), France (EWQ), Germany (EWG), India (INDA), Japan (EWJ), and Israel (EIS) fell even more than that. China (MCHI) and Hong Kong (EWH) went the other way with gains of more than 4% during the month. On the year, China (MCHI) finished July up 23.75% year-to-date, which is much better than SPY’s 8.5% gain. Notably, India (INDA) ended July exactly flat on the year, which trails basically every other country around the world in terms of 2025 equity market returns.
Getting back to the US, sector returns have been scattered recently, with areas like Consumer Staples (XLP) and Health Care (XLV) selling off in July, while Industrials (XLI), Tech (XLK), and Utilities (XLU) — all areas benefitting from the AI Boom and its build-out — rallied.
To start August, however, Consumer Staples (XLP) and Health Care (XLV) are holding up well while the rest of the market plunges today.
In terms of large-caps versus small-caps, yet again, the small-cap Russell 2,000 (IWM) is lagging. IWM is down 2.1% today after finishing July in the red on a year-to-date basis. The small-cap value ETF (IJS) ended July down 6.4%. That’s nearly 15 percentage points weaker than the 8.5% gain seen for the large-cap SPY. Will small-caps ever outperform again?
Chart of the Day: Triple Plays Fall Intraday
Bespoke’s Morning Lineup – 8/1/25 – A Down Open
See what’s driving market performance around the world in today’s Morning Lineup. Bespoke’s Morning Lineup is the best way to start your trading day. Read it now by starting a two-week trial to Bespoke Premium. CLICK HERE to learn more and start your trial.
“Simple can be harder than complex”– Steve Jobs

Below is a snippet of commentary from today’s Morning Lineup. Start a two-week trial to Bespoke Premium to view the full report.
We almost made it through the week unscathed. The mega-caps reported generally good results, economic data didn’t ruffle any feathers, and Fed Chair Powell held to form and was a downer for stocks, but not by a lot. The only other hurdle was the August 1st tariff deadline, and for a President who thrives on volatility, his actions last night certainly shook things up. In a series of actions, Trump issued new tariff duties ranging from 10% to 41%. We cover this in more detail in the commentary of today’s Morning Lineup, and the actual impact will not be as painful as the headline numbers suggest. For a market that was already starting to act heavy, though, the tariff news pushed futures lower.
Along with weakness in US equities, Asian and European stocks fared even worse, bond yields moved slightly higher, oil prices declined, gold was little changed, platinum and palladium are both down close to 2%, and crypto prices are down sharply with declines of 1.5% in Bitcoin and over 3% in Ethereum.
We’re through most of the earnings data for the week, but on the economic calendar, we still have the July Employment report, ISM Manufacturing, Construction Spending, and Michigan Sentiment. Already this morning, the President has been railing against Powell, and if any of this morning’s data comes in weaker than expected, expect the volume on his Truth Social account to get to eleven quickly.
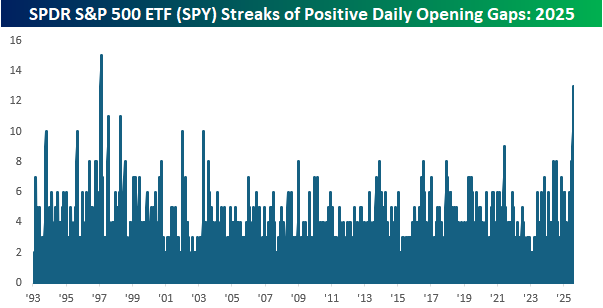
Hold on to your hats for a second, because the S&P 500 is on pace to not only open lower this morning, but at current levels, the decline would be about 1%. As shown in the chart below, the last time the SPDR S&P 500 ETF (SPY) gapped down 1%+ at the open was in late May, and it hasn’t opened lower since July 14th.
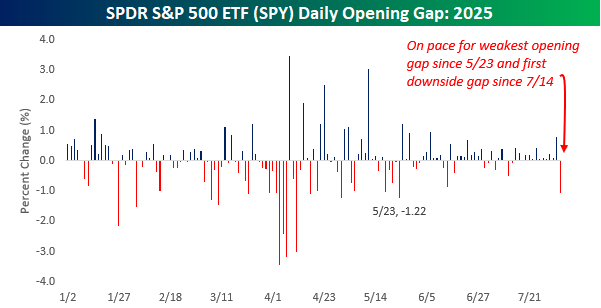
With 13 straight days of gains at the open, the streak that is about to end would be the second-longest in SPY’s history. The only streak that was longer ended in February 1997, and there were only two other streaks that lasted longer than ten days – July 1997 and February 1998. The comparisons always seem to go back to the late 1990s, don’t they?