
Documenting the Rally
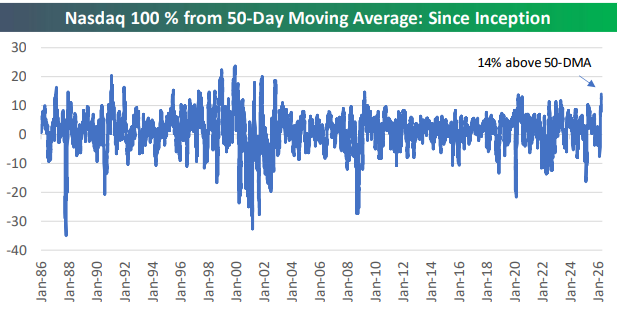
The S&P 500 is now up more than 17% since its late March low, and it’s 7% above its 50-day moving average. The tech-heavy Nasdaq 100 is double that at 14% above its 50-DMA!
As shown below, the last time the Nasdaq was this far above its 50-DMA was in late 2009 in the early days of the post-Financial Crisis recovery.
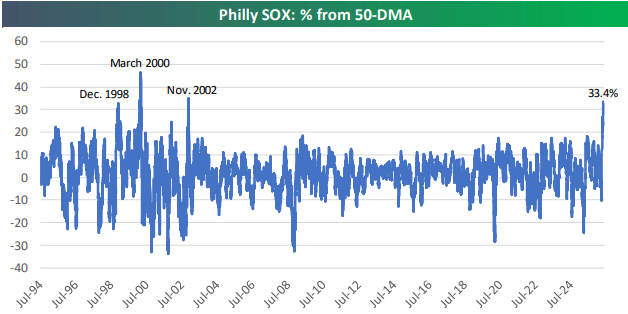
Within Tech, the Semis continue to soar to levels not seen since the Dot Com Boom and Bust of the late 1990s/early 2000s.
As shown below, the Philadelphia SOX semis index is currently 33% above its 50-DMA, a level only hit three other times: December 1998, March 2000, and November 2002.
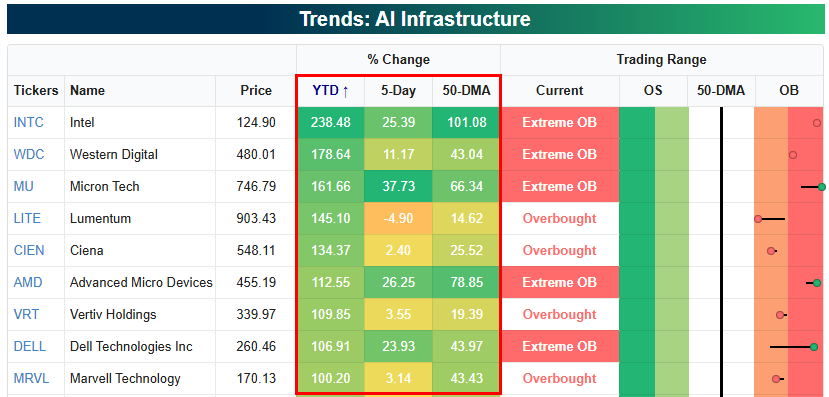
Below is a look at the best performing stocks this year in our AI Infrastructure basket (available with a Bespoke Institutional membership). There are nine stocks up more than 100% already!
Want to read more in-depth analysis of the recent rally for Tech? Join our Think BIG mailing list or Bespoke Premium by starting a trial today! Click below for details on how to sign up for Premium:

Chart of the Day: Weak Breadth and Ex Tech
Bespoke’s Morning Lineup – 5/11/26 – Six, Six, Six
See what’s driving market performance around the world in today’s Morning Lineup. Bespoke’s Morning Lineup is the best way to start your trading day. Read it now by starting a two-week trial to Bespoke Premium. CLICK HERE to learn more and start your trial.
“The toughest thing about success is that you’ve got to keep on being a success.” – Irving Berlin

Below is a snippet of commentary from today’s Morning Lineup. Start a two-week trial to Bespoke Premium to view the full report.
Futures point to a lackluster start to the new week as the S&P 500 and Nasdaq are both indicated to open the week 0.10% lower. Given the move higher in crude oil, though, it could be worse. WTI is trading up over 3% to more than $98 per barrel after the US rejected Iran’s latest peace proposal as a non-starter. The 10-year yield is nearly 3 bps higher but still under 4.4%, while gold is down over 1%, and Bitcoin is fractionally higher.
Overnight in Asia and Europe this morning, it’s been a negative start to the week on the Iran news, but in the US, attention will likely shift from the Middle East to inflation – at least in the short term – with Tuesday’s release of CPI and Wednesday’s PPI.
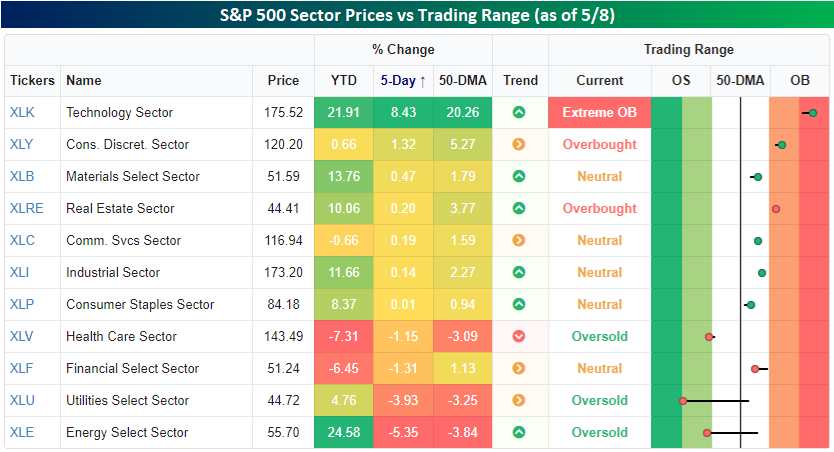
Every week is interesting, but last week’s breadth was a standout. The S&P 500 finished 2.33% higher, but mega caps did most of the heavy lifting as the average stock in the index finished the week higher by just 0.64%. Check out the snapshot below from our Trend Analyzer showing each sector’s performance and where they traded relative to their trading ranges. Again, while the S&P 500 was up over 2%, the only sector that outperformed the index was Technology, and with a gain of 8.43%, it outperformed by a lot! The only other sector that rallied more than 1%, though, was Consumer Discretionary (+1.32%), and no other sector even finished the week higher with a gain of 0.5%.
Not only did most sectors underperform last week, but more sectors were down 1% than up 1%. In fact, there were just as many sectors that finished down by over 3% – Energy and Utilities – as there were that finished up at least 1%!
Where each sector settled out the week relative to its trading range also varied widely. While Technology heads into the new week at ‘extreme’ overbought levels, Utilities is right on the cusp of ‘extreme’ oversold levels, and Energy and Health Care also finished the week at oversold levels.
However weak overall breadth was, a gain is a gain, and the S&P 500, Nasdaq, and Russell 2000 now all have winning streaks of at least six weeks. Six-week winning streaks aren’t that out of the ordinary for any of the three indices on their own, but for all three to have one simultaneously is much less common. Since the Russell 2000 started in 1979, there have only been ten other periods.
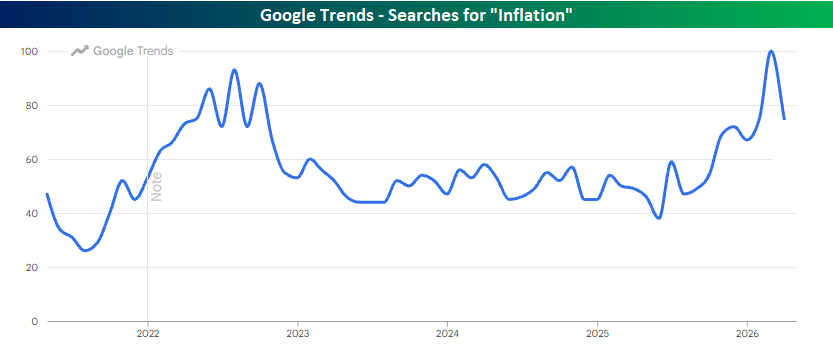
Finally, inflation will be a big topic this week with the release of CPI on Tuesday and PPI on Wednesday. Obviously, the market is expecting big upticks in inflation. What surprised us, though, is the uptick in search activity related to inflation. According to Google Trends, searches for “inflation” during March surpassed the peak levels seen during 2022 when CPI surged as high as 9.1% y/y. For tomorrow’s CPI, economists are only forecasting an increase to 3.7% from 3.4% in April.
Start a two-week trial to Bespoke Premium to continue reading today’s full Morning Lineup.
Brunch Reads – 5/10/26
Welcome to Bespoke Brunch Reads — a linkfest of some of our favorite articles over the past week. The links are mostly market-related, but there are some other interesting subjects covered as well. We hope you enjoy the food for thought as a supplement to the research we provide you during the week.
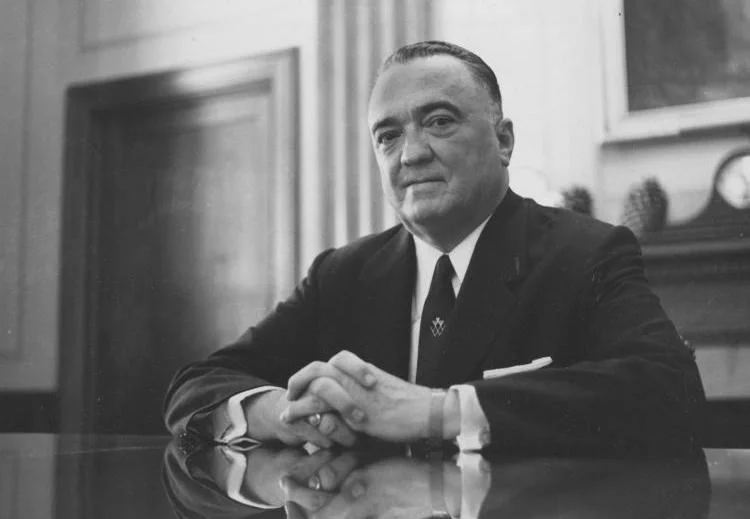
Building the Bureau: On May 10, 1924, a 29-year-old J. Edgar Hoover was appointed director of the Bureau of Investigation, the small and scandal-plagued agency that would later become the FBI. Hoover would remain in charge for nearly 48 years, serving under eight presidents.
During the 1930s, he aggressively pursued famous gangsters like John Dillinger, Pretty Boy Floyd, and Baby Face Nelson, helping turn the FBI into a symbol of federal authority during the crime wave of the Great Depression. World War II and the Cold War dramatically expanded Hoover’s power. Under his leadership, the FBI pursued Nazi spies, Soviet espionage networks, and suspected communist activity inside the United States. Hoover became one of the country’s fiercest anti-communists, often arguing that internal subversion posed as much danger as foreign enemies. His influence grew so large that presidents frequently feared crossing him. At the same time, critics accused him of abusing surveillance powers, compiling secret files on politicians and public figures, and using intelligence as leverage. Programs like COINTELPRO targeted civil rights activists, anti-war organizers, and political dissidents, including surveillance of Martin Luther King Jr.
Hoover’s relationship with John F. Kennedy and Robert F. Kennedy added another complicated chapter to his legacy. RFK, as Attorney General, technically oversaw the FBI and initially hoped to modernize parts of the agency, but Hoover remained immensely difficult to control. The two men often clashed over organized crime, civil rights enforcement, and the Bureau’s priorities. Hoover had long resisted acknowledging the scale of the Mafia, while RFK aggressively pursued organized crime prosecutions. Hoover also deeply distrusted the Kennedys’ inner circle and reportedly kept sensitive information on many political figures. After JFK’s assassination in 1963, Hoover became central to the federal investigation and worked closely with the Warren Commission. Critics later argued that Hoover pushed investigators too quickly toward the conclusion that Lee Harvey Oswald acted alone, partly because Hoover feared public panic or exposure of intelligence failures.
Hoover passed away in 1972 at the age of 77. Under his leadership, the FBI became more professional, technologically advanced, and nationally coordinated than it had been before. Yet his tenure also left behind deep questions about civil liberties, political surveillance, and the limits of federal authority that are still hotly debated.
Economic Trends
Why the US should refuse the UAE a dollar swap line (Financial Times)
The UAE is asking for access to US dollar backstops even though it already has hundreds of billions in reserves, giant sovereign wealth funds, and no obvious shortage of cash, which has some economists wondering why one of the world’s richest oil states needs help in the first place. The bigger issue is whether the US should extend emergency-style financial support to a country with limited transparency and banking systems tied closely to royal family interests, especially when the Federal Reserve already has a lower-risk tool that lets countries temporarily swap Treasuries for cash without handing out an open-ended lifeline. [Link]
Continue reading our weekly Brunch Reads linkfest by logging in if you’re already a member or signing up for a trial to one of our two membership levels shown below! You can cancel at any time.

Daily Sector Snapshot — 5/8/26
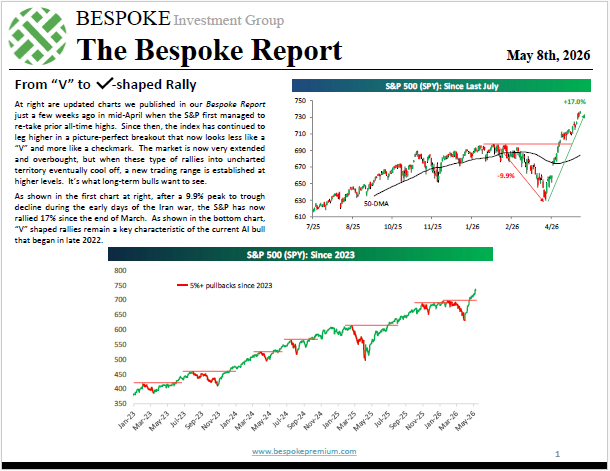
The Bespoke Report – 5/8/26 – Checkmark Rally
The S&P has continued to leg higher in a picture-perfect breakout that now looks less like a “V” and more like a checkmark.
The market is now very extended and overbought, but when these type of rallies into uncharted territory eventually cool off, a new trading range is usually established at higher levels. It’s what long-term bulls want to see.
We cover everything going on across markets and the economy in this week’s Bespoke Report newsletter.
To read this week’s newsletter and gain access to the rest of Bespoke’s daily research, start a 30-day trial to one of our three unique membership levels. CLICK HERE to sign up today!
The Triple Play Report: 5/8/26
An earnings triple play is a stock that reports earnings and manages to 1) beat analyst EPS estimates, 2) beat analyst sales estimates, and 3) raise forward guidance. You can read more about “triple plays” at Investopedia.com where they’ve given Bespoke credit for popularizing the term. We like triple plays as an indication that a company’s business is firing on all cylinders, with better-than-expected results and an improving outlook. A triple play is indicative of positive “fundamental momentum” instead of pure fundamentals, and there are always plenty of names with both high and low valuations on our quarterly list.
Bespoke’s Triple Play Report covers what each company does, what this quarter’s results say about their growth outlooks, and their histories of delivering triple plays. Bespoke’s Triple Play Report is available at the Bespoke Institutional level only. You can sign up for Bespoke Institutional now and receive a 14-day trial to read today’s Triple Play Report. To sign up, choose either the monthly or annual checkout link below:
Bespoke Institutional – Monthly Payment Plan
Bespoke Institutional – Annual Payment Plan
Bespoke Investment Group, LLC believes all information contained in these reports to be accurate, but we do not guarantee its accuracy. None of the information in these reports or any opinions expressed constitutes a solicitation of the purchase or sale of any securities or commodities. This is not personalized advice. Investors should do their own research and/or work with an investment professional when making portfolio decisions. As always, past performance of any investment is not a guarantee of future results. Bespoke representatives or clients may have positions in securities discussed or mentioned in its published content.
It’s Increasingly Becoming a Memory
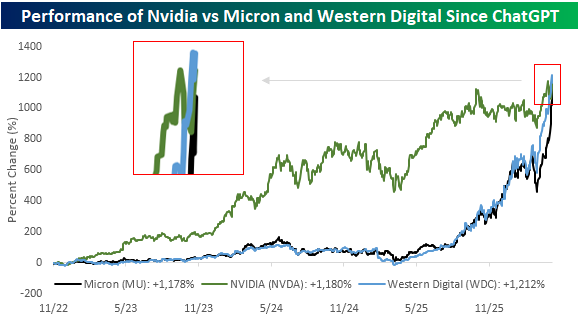
We’ve had a hard time keeping up with the price movements today, but suffice it to say that memory stocks are surging again. The rally in these stocks has gotten so large lately that they’re starting to crowd Nvidia (NVDA) out of the AI winner spotlight. Any mention of AI related to the stock market almost instinctively causes investors to think of NVDA, but when it comes to performance since the launch of ChatGPT, memory stocks, including Micron (MU) and Western Digital (WDC), have caught up.
As of Friday morning, MU’s gain of 1,127% since the launch of ChatGPT isn’t far behind NVDA’s 1,180% gain, while WDC’s gain of 1,212% now surpasses NVDA!
Ever since the AI boom started, NVDA had built a moat comprised of the best GPUs and its CUDA software ecosystem. Memory, meanwhile, was the most commoditized aspect of the entire tech ecosystem. Try telling that to the memory companies now!
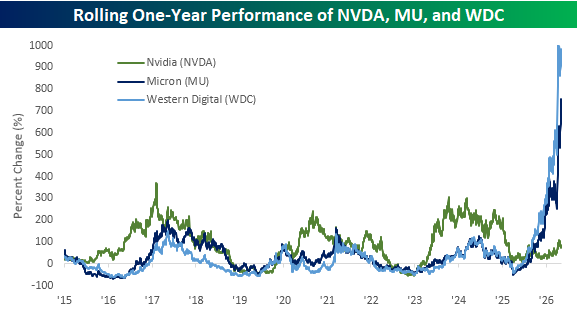
The magnitude of the moves in the memory stocks has been even more surprising. Back in early 2024, when NVDA was sitting on year/year gains of more than 300%, investors couldn’t believe it. Today, stocks like MU and WDC have experienced y/y gains of triple that or more! A key difference between these rallies in the memory stocks and NVDA is that NVDA surged more than 200% on a y/y basis and continued to build on gains of that magnitude for more than a year. At this point, the rally in memory stocks has been more of a concentrated flash (pun intended) in the pan move than an enduring rally. Can it continue? Most investors would probably say no. Once supply catches up to demand, prices will come down quickly, but when was the last time the market didn’t surprise you?
To receive Bespoke’s best and most actionable insights, join our Think BIG mailing list or start a trial to Bespoke Premium or Bespoke All Access today!
Bespoke’s Morning Lineup – 5/8/26
See what’s driving market performance around the world in today’s Morning Lineup. Bespoke’s Morning Lineup is the best way to start your trading day. Read it now by starting a two-week trial to Bespoke Premium. CLICK HERE to learn more and start your trial.
“There is nothing new in the world except the history you do not know.” – Harry Truman
Below is a snippet of commentary from today’s Morning Lineup. Start a two-week trial to Bespoke Premium to view the full report.
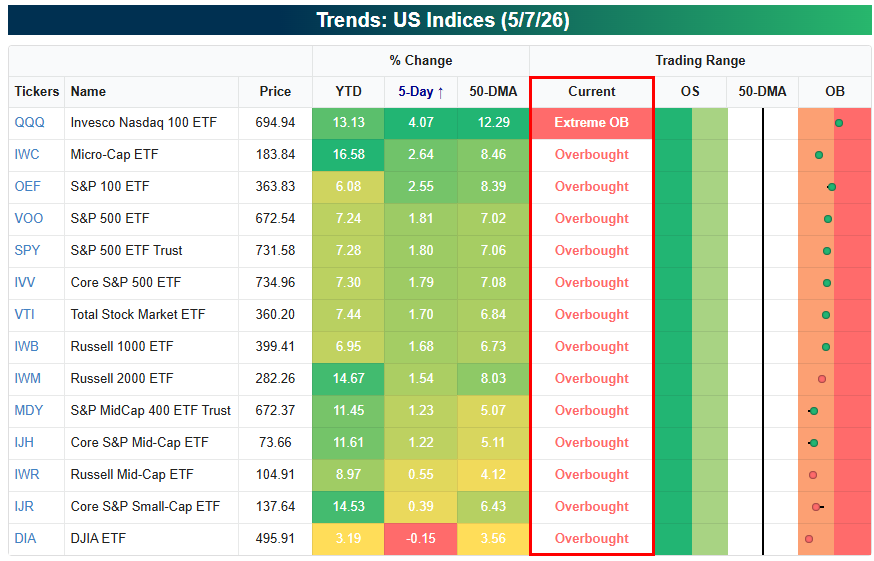
As shown below, we’re entering the last trading day of the week with all of key US index ETFs still in overbought territory:
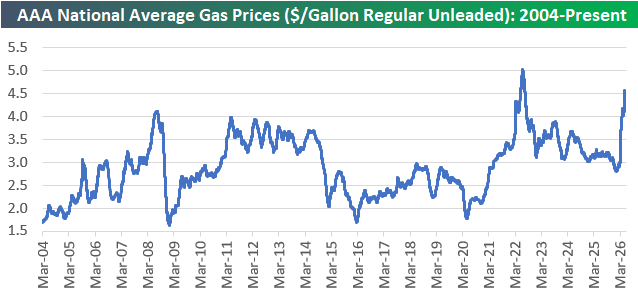
Gas prices continue to spike with the average price for a gallon of regular unleaded up to $4.55/gallon nationally. Ten days ago near the end of April, prices were at $4.17/gallon, so they’ve seen another meaningful pick-up recently.
Just before the Iran War, gas prices had fallen down into the $2s. Now they’re closer to $5/gallon than $4.
Start a two-week trial to Bespoke Premium to continue reading today’s full Morning Lineup.
The Closer – Fertilizer, Stable Sentiment, Expectations Up – 5/7/26
Log-in here if you’re a member with access to the Closer.
- Fertilizer prices have begun to moderate as related companies reported very strong first quarter results.
- Despite the push to fresh highs, sentiment has not gotten overly extended.
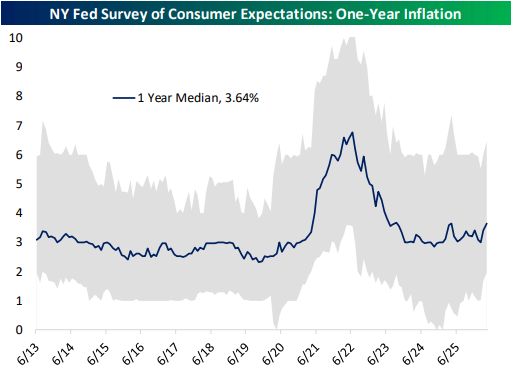
- The NY Fed’s Survey of Consumer Expectations saw multi-year highs for inflation expectaitons.
See today’s full post-market Closer and everything else Bespoke publishes by starting a 14-day trial to Bespoke Institutional today!