The Closer – VIX vs Stocks, Small Caps, Pending Homes, Output Revisions – 5/30/19
Log-in here if you’re a member with access to the Closer.
Looking for deeper insight on markets? In tonight’s Closer sent to Bespoke Institutional clients, we look at the VIX and small caps which closed at extreme oversold levels. We put into perspective what this means going forward. We then turn our attention to economic data with today’s release of pending home sales and the first revision of Q1 GDP. We highlight some of the labor and capex data in this release. With oil falling sharply today, we finish with a look at this week’s EIA data.
See today’s post-market Closer and everything else Bespoke publishes by starting a 14-day free trial to Bespoke Institutional today!
Bespoke’s Sector Snapshot — 5/30/19
We’ve just released our weekly Sector Snapshot report (see a sample here) for Bespoke Premium and Bespoke Institutional members. Please log-in here to view the report if you’re already a member. If you’re not yet a subscriber and would like to see the report, please start a two-week free trial to Bespoke Premium now.
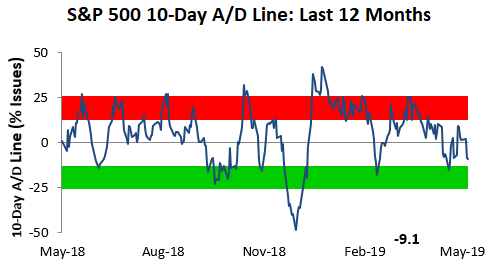
In this week’s Sector Snapshot, we discuss extreme oversold price levels for the major indices along with a pullback in defensives that had previously been rallying. While price is oversold, the S&P 500’s 10-Day Advance/Decline line has not yet reached extreme territory on the downside.
To gain access to the report, please start a two-week free trial to our Bespoke Premium package now. Here’s a breakdown of the products you’ll receive.
Bearish Sentiment Grows
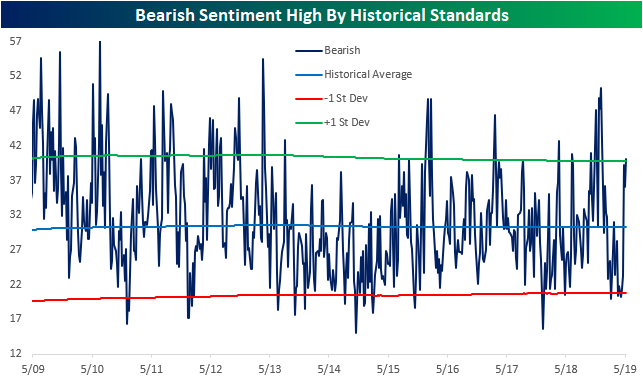
The AAII weekly sentiment survey remains biased towards a bearish outlook this week, though, bullish sentiment saw a small increase. 24.79% of respondents reported bullish sentiment this week. This small increase was not enough to bring it back into its historical range as it is still over 1 standard deviation from the historical average as shown in the second chart below. As we highlighted last week, these more extreme readings can actually be taken as a good sign for equities, but that is looking at when bearish and neutral remain in their normal ranges. That is no longer the case this week. Start a two-week free trial to Bespoke Institutional to access our interactive economic indicators monitor and much more.


Similar to the bulls, bearish sentiment has risen to an extreme this week. That is the first time that bearish sentiment is at an extreme high while bullish is also at an extreme low since late December 2018. This week’s increase up to 40.08% brings bearish sentiment around 10 percentage points above the historical average. Bearish sentiment has increased at a very rapid pace in May, rising over 18 percentage points over the course of the month. While bearish sentiment had risen to much higher levels through the sell-off in Q4 of last year, the most it rose in a four-week span was 12.91 percentage points. The last time there was as large of an increase in a month was in April of last year, when it rose from 28.49% on March 22nd to 42.75% on April 12th; a 21.42 percentage point move.
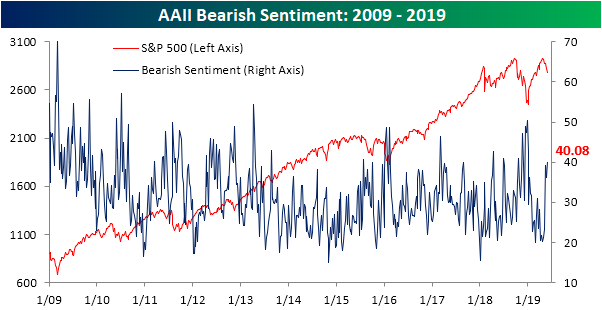
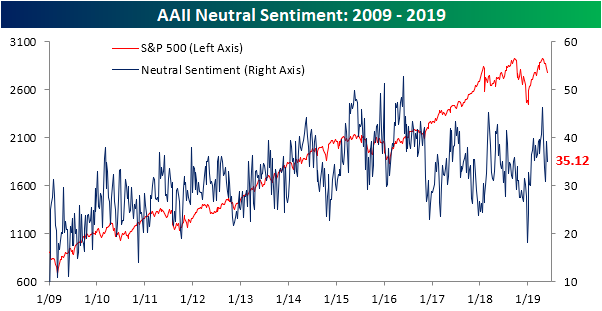
Bulls and bears borrowed entirely for the neutral camp as the percentage of investors reporting neutral sentiment fell around 4% to 35.12%. Neutral sentiment continues to be high relative to where it has been historically, but it has also come down considerably from multiyear highs reached earlier in the year.
Initial Jobless Claims Steady Again
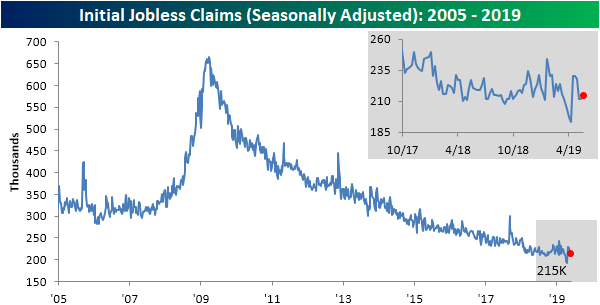
This week’s release of Initial Jobless Claims from the U.S. Department of Labor was pretty uneventful as the seasonally adjusted data was in line with expectations at 215K. That is a slight rise from the upwardly revised 212K (originally 211K) last week. That revision means that claims for last week had been unchanged from the prior release. In the past couple months, the seasonally adjusted numbers have seen this sort of pattern before. In the final weeks of April, claims came in at their recent high of 230K two weeks in a row. This was followed by a 2K lower reading of 228K. The weeks since have basically mirrored this with the aforementioned two consecutive weeks of a print of 212K and now this week’s 3K rise to 215K. Keeping steady like this, claims have remained below 250K for 72 weeks now, and have been below 300K for 221 weeks now. Start a two-week free trial to Bespoke Institutional to access our interactive economic indicators monitor and much more.
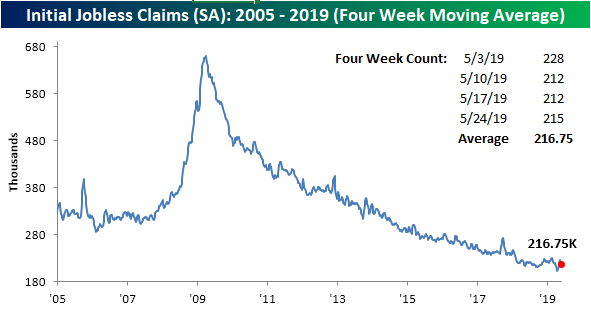
As the previously mentioned highs from late April have continued to roll off, the four-week moving average has fallen for its second straight week down to 216.75K from 220.3K last week. Like the seasonally adjusted level data, the four-week moving average now sits in the middle of its recent highs and lows. This means that this week’s reading continues to not indicate any sort of new direction for the data, rather, it is showing labor data is simply holding up at healthy levels.
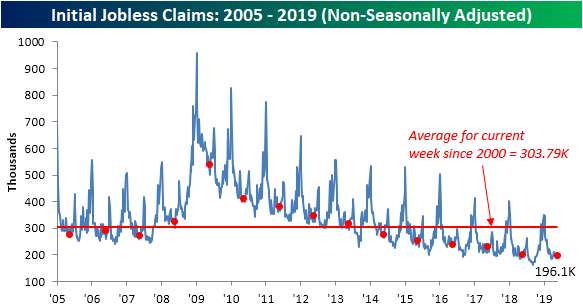
The non-seasonally adjusted number rose to 196.1K compared to 191.3K last week. That rise is typical for the current week of the year. As shown in the chart below, over the next several weeks of the year headed into the summer months, the data has usually seen a seasonal uptick. Given this and in spite of the rise, this week’s reading is still indicating a healthy labor market as it remains below levels from last year and all prior years of the current cycle. It is also still well below the average for the week of the year going back to 2000.
Trend Analyzer – 5/30/19 – Extremely Oversold
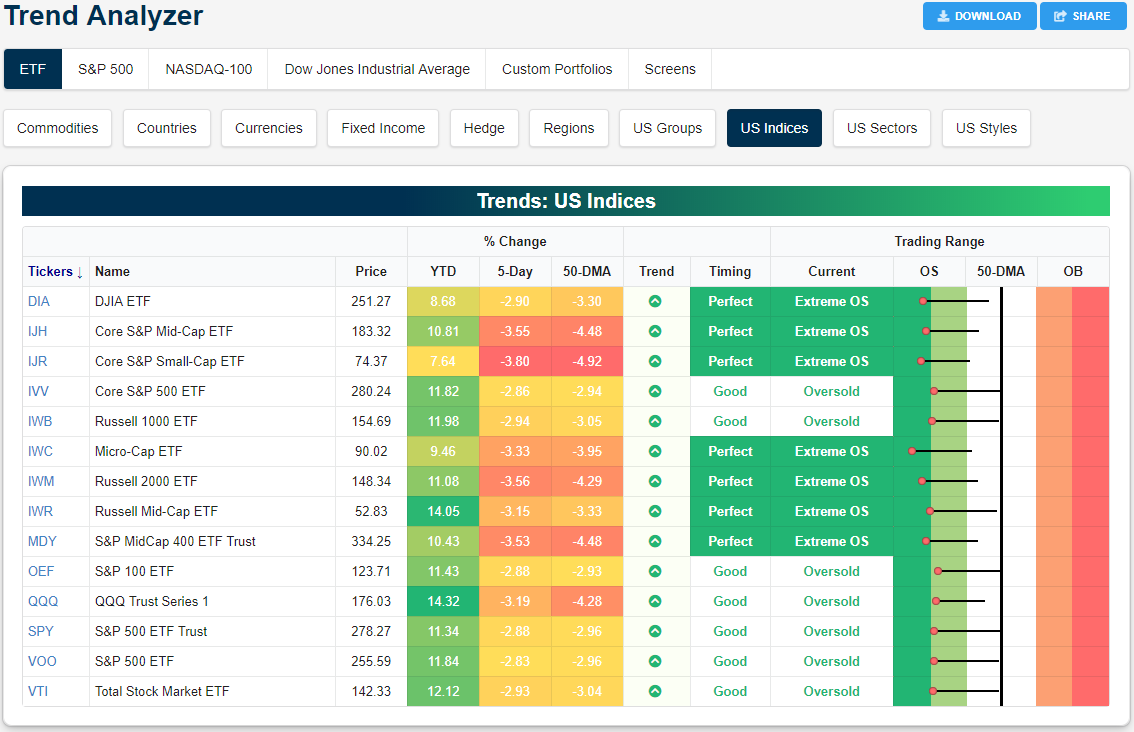
Further declines this week have continued to push the major index ETFs deeper into oversold territory. Currently half of the major index ETFs are sitting over 2 standard deviations below the 50-DMA; what we consider to be extremely oversold. While the rest of these ETFs are not yet at extreme levels, they are on the cusp of joining their peers. This push deep into oversold territory has been pretty rapid as evident by the long tails to the right in the Trading Range section of our Trend Analyzer. This time last week, these ETFs were just barely oversold or neutral. Some, like the S&P 500 (SPY) and Nasdaq (QQQ), were actually right near the 50-DMA. As this group has fallen into oversold territory, small and mid caps have led the way lower. The Core S&P 500 Small-Cap (IJR) is currently down the most with a 3.8% decline while the others are not far behind all down over 3%. Start a two-week free trial to Bespoke Institutional to access our interactive economic indicators monitor and much more.
Morning Lineup – Nearing Extremes
Futures are still indicating a positive open, but the degree of gains has been shrinking all morning ahead of a heavy dose of economic data. Trade tensions are once again in the headlines, and today’s economic data is unlikely to move things much in either direction as there were no major surprises. The revision to GDP was slightly stronger than expected, Core PCE and the GDP Price Index were weaker than expected, Jobless Claims were pretty much right in line, and Wholesale Inventories rose more than expected.
Make sure to check out today’s Morning Lineup for our analysis of the stealth rally we have seen in EM over the last few days along with our contrarian take on how the relevance of these non-stop trade headlines may be reaching a peak.

Even with the S&P 500 closing off its intraday lows yesterday, the market is approaching some levels that can be considered extreme in the short-run. For starters, the S&P 500 finished the day yesterday 1.998 standard deviations below its 50-DMA. For the sake of reference, we consider anything more than one standard deviation below the 50-DMA oversold, while two standard deviations is considered an extreme. We did see more extreme oversold levels last year in Q4 but that was a hardly the run of the mill decline.

In terms of the S&P 500’s individual components, the number of oversold stocks is starting to pile up. As of yesterday’s close, 10.4% of the stocks in the index were overbought (more than one standard deviation above their 50-DMA) while just under half (49.2%) were oversold. At a net reading of -38.8%, there haven’t been this many oversold stocks in the S&P 500 since January 3rd when over 70% of the stocks in the S&P 500 were oversold.

Start a two-week free trial to Bespoke Premium to see today’s full Morning Lineup report. You’ll receive it in your inbox each morning an hour before the open to get your trading day started.
S&P 500 Trading Range Chart and Sector Internals
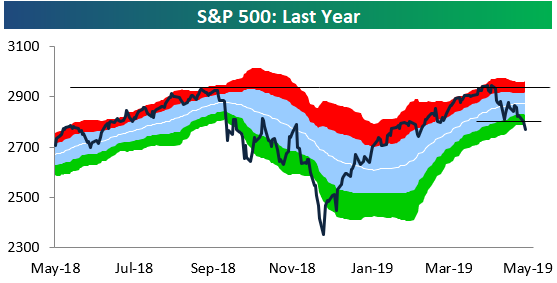
Below is an updated look at the S&P 500’s trading range chart over the last year. After just barely making a new 52-week high in April, it has been all downhill since, with the index currently trading in extreme oversold territory at two standard deviations below its 50-day moving average. Yesterday’s declines caused more technical damage when the index broke below its lows from a few weeks ago. Right now the bears have control and the onus is on the bulls to break the short-term downtrend that’s in place.
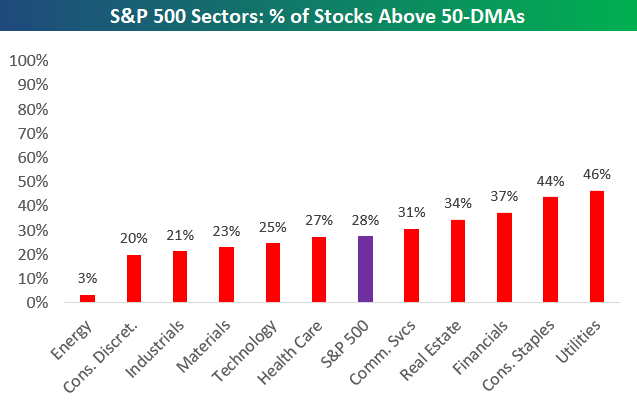
The defensive areas of the market like Consumer Staples and Utilities had been holding up well up until this week, but even these non-cyclicals have started to experience significant selling. The declines for defensives have left every single S&P 500 sector with less than 50% of its stocks above their 50-day moving averages. As shown below, just 28% of S&P 500 stocks and 3% of those in the Energy sector are above their 50-DMAs. The largest sector of the market — Technology — currently has a very weak reading of just 25% as well. Start a two-week free trial to one of Bespoke’s three premium membership levels.
The Closer – Bearish Backdrop Building – 5/29/19
Log-in here if you’re a member with access to the Closer.
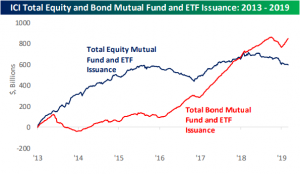
Looking for deeper insight on markets? In tonight’s Closer sent to Bespoke Institutional clients, beginning on a bearish note, we show the loose head and shoulders forming on the S&P 500 as the SPY also went below the 200-DMA intraday. We then show another technical pattern with similarities to the ends of the last two bull markets. One final bearish note, we make is corporate credit spreads signaling lower equity prices. Next, we turn to the Goldman Sachs financial conditions index which is beginning to mirror Fed policy. We finish with a complete look at the Five Fed manufacturing composite and ICI Fund Flows.
See today’s post-market Closer and everything else Bespoke publishes by starting a 14-day free trial to Bespoke Institutional today!
Dow Stocks Breaking Uptrends
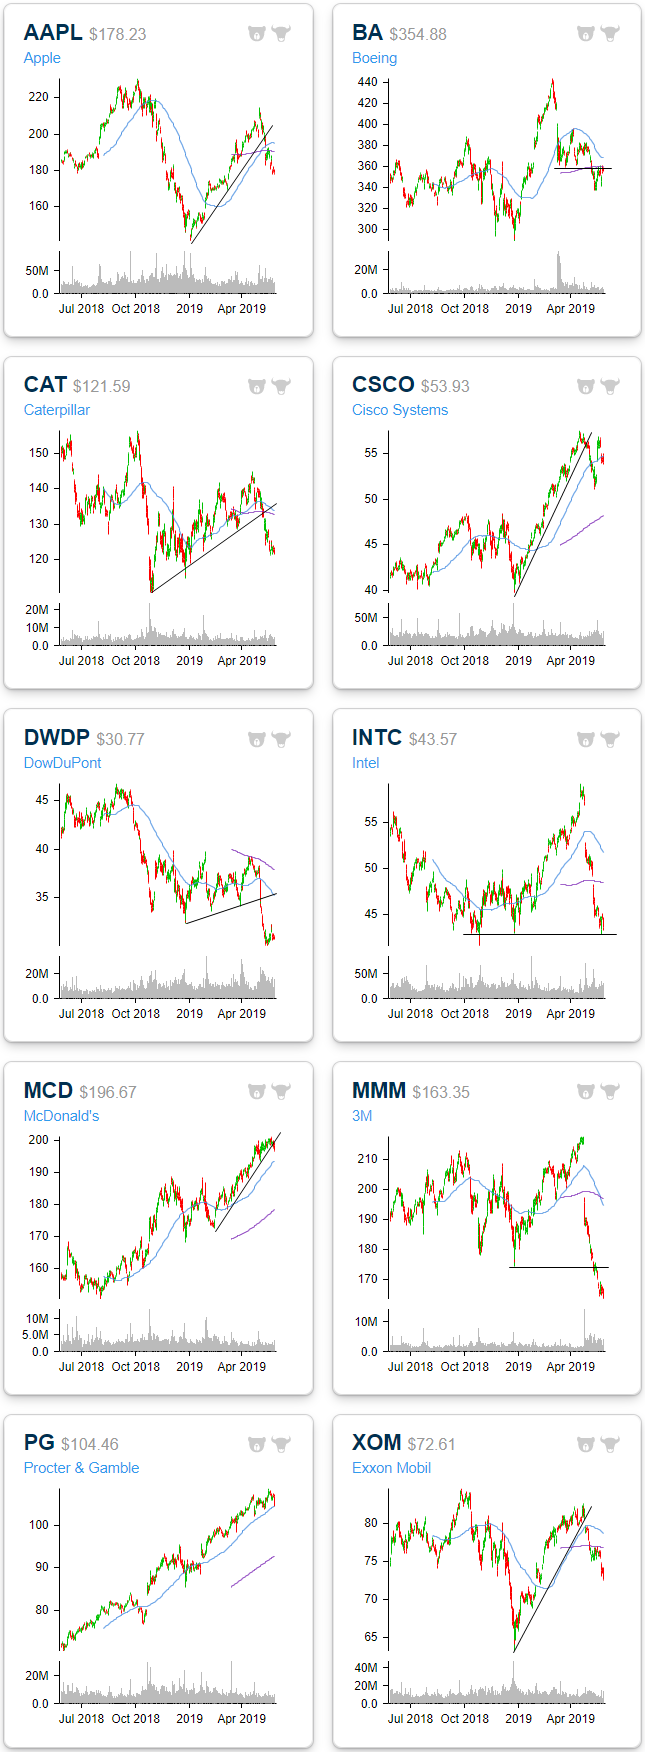
May has not been the kindest of months for equities as the Dow now sits -4.68% lower MTD. Several of the big blue chips had been in strong uptrends all year headed into May, but have since rolled over. For some, the breakdowns are more individual stories such as Boeing’s (BA) 737 Max headaches or DowDuPont’s (DWDP) recent weak quarter following multiple spinoffs, but they are also a factor of broader trends of concerns around global trade and growth. For example, Caterpillar (CAT) which has acted as a bellwether for global trade given its high exposure to China has been hit particularly hard as tensions have ramped back up. May declines have broken CAT’s uptrend in addition to having sent it below its moving averages. Its peers are seeing the same patterns with broken uptrends from the likes of Apple (AAPL), Cisco (CSCO), Intel (INTC), 3M (MMM), and Exxon Mobil (XOM). In the case of DWDP and MMM, this month’s sharp declines have brought them around 52-week lows. Other Dow stocks like McDonalds (MCD) and Procter and Gamble (PG) have held up far better and are still pretty much in their uptrends, but in the past few sessions they’ve begun to test their uptrend lines and 50-DMAs as well. Start a two-week free trial to Bespoke Institutional to access our Chart Scanner tool and much more.
Triple Plays Not Holding Gains
With earnings season now in the rear view, the pace of quarterly reports has slowed considerably. Tomorrow will actually be the busiest day of the next month with just 28 reports. Given that not many companies are reporting, we have also only seen four triple plays in the past couple of weeks since earnings season ended on May 16th. An earnings triple play is when a company beats EPS estimates, beats revenue estimates while also raising guidance; we keep track of the 100 most recent triple plays on our website for subscribers, and we publish a number of premium reports throughout the quarter focusing on these earnings winners. Start a two-week free trial to Bespoke Institutional to access our Earnings Explorer, Triple Plays, Chart Scanner and much more.
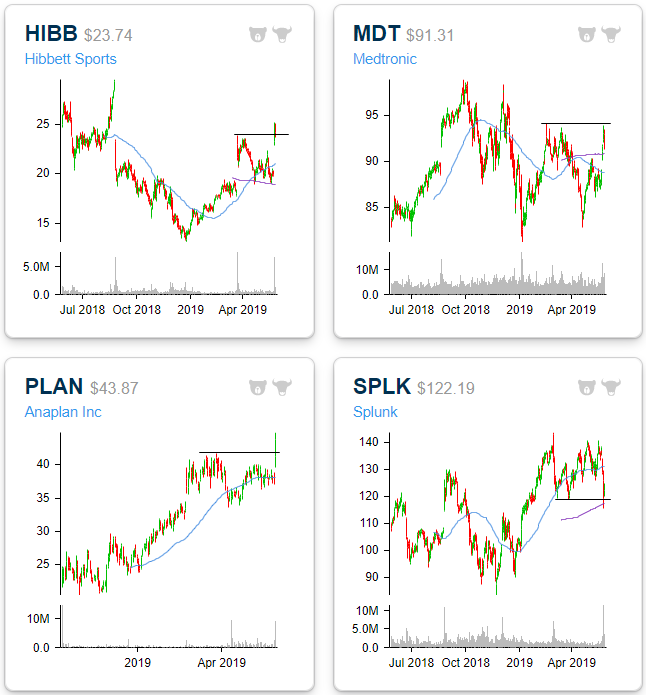
Since the end of earnings season, Medtronic (MDT), Splunk (SPLK), Hibbett Sports (HIBB), and Anaplan (PLAN) have all reported earnings triple plays. Despite some nice gaps higher on their earnings day, most gains have not been able to hold. MDT and SPLK reported last Thursday and saw two very different responses. In what was MDT’s second straight triple play, the stock rose 3.24%. SPLK on the other hand—also no stranger to triple plays with this most recent report being its 19th in its last 29 reports—fell 7.33% in response. That is somewhat unusual but not totally unheard of as the stock has risen on average 4.43% and has fallen 36.8% of the time when it reports a triple play. Since these reports though, MDT has stopped short at resistance near $93.50 at February/March highs. Meanwhile, SPLK has continued to fall, and despite a bit of a bounce yesterday, is right around support at the $120 level.
Hibbett Sports (HIBB), which reported on Friday, saw a huge positive response to earnings rallying over 20%. This was the company’s second straight triple play. Given this massive run-up, the stock has come back down to Earth right around 2019 highs from before earnings. As of this writing, the stock has fallen over 4.5% further in today’s trading; filling some of its gap up. Finally, Anaplan (PLAN) reported before the opening bell yesterday and also saw a large gap higher with more buying throughout the day leading the stock to finish the day up 18.22%. Like HIBB, PLAN is down today over 6% and is filling some of this gap higher.