Year over Year Increases are Back for Claims
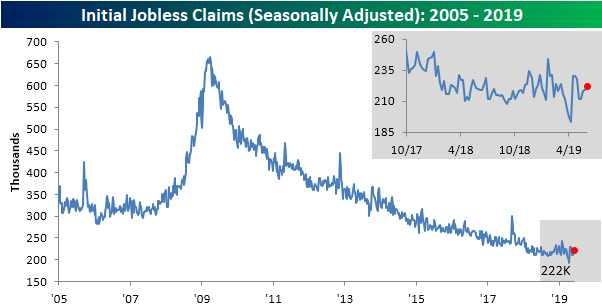
Last week’s initial jobless claims number was pretty unexciting, especially compared to the ADP and NFP numbers which saw massive misses. While certainly not to the same degree as last week’s data, this week’s claims also came in weaker rising to 222K compared to last week’s upwardly revised 219K. This also missed forecasts which called for a small drop to 215K. While it was an increase and a miss relative to estimates, on a seasonally adjusted basis, claims are still at healthy levels in the middle of the range from the past several months. In other words, given this week’s data, claims are neither improving nor worsening in any significant way. Claims have now spent a record 223 weeks under 300K and 74 weeks under 250K, closing in on the record streak of 89 weeks.
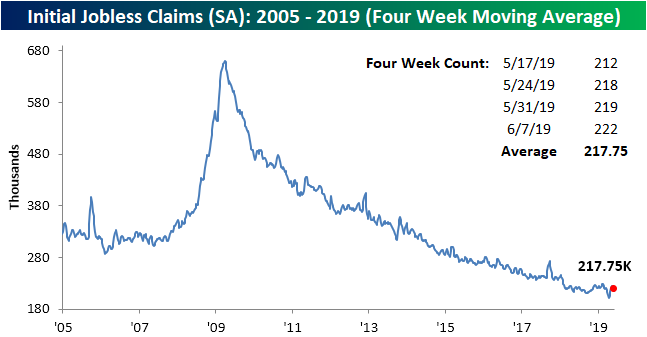
The less volatile four-week moving average also saw a slight increase this week to 217.75K from 215.25K last week. Like the seasonally adjusted number, the four-week moving average has not seen any large movements over the past month and is in between recent highs and lows.
Non-seasonally adjusted initial jobless claims rose to 219.9K. That is a sizeable increase from last week’s 189.6K, but this increase was not anything unusual for the current week of the year. From this time of the year through the next several weeks, NSA data typically sees a steady increase due to seasonal patterns as schools get out for summer. While the week-over-week increase could be expected, the NSA number also rose year-over-year. The increasing frequency of these YoY increases in 2019 is something that we have made note of in the past as a possible concern and could be pointing to a potential bottoming out in claims. Start a two-week free trial to Bespoke Institutional to access our interactive economic indicators monitor and much more.

S&P 500 Sector Trading Range Charts
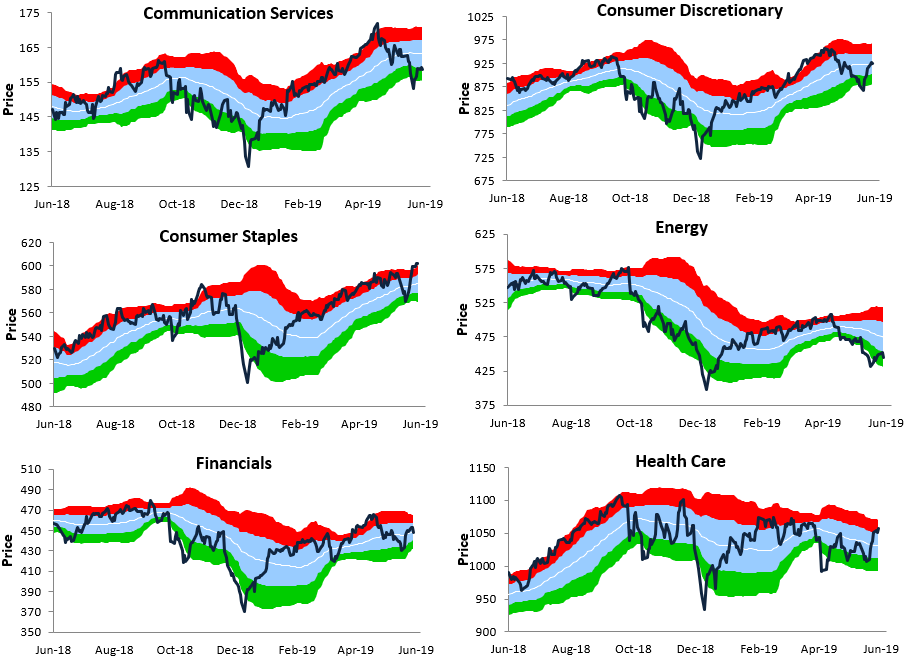
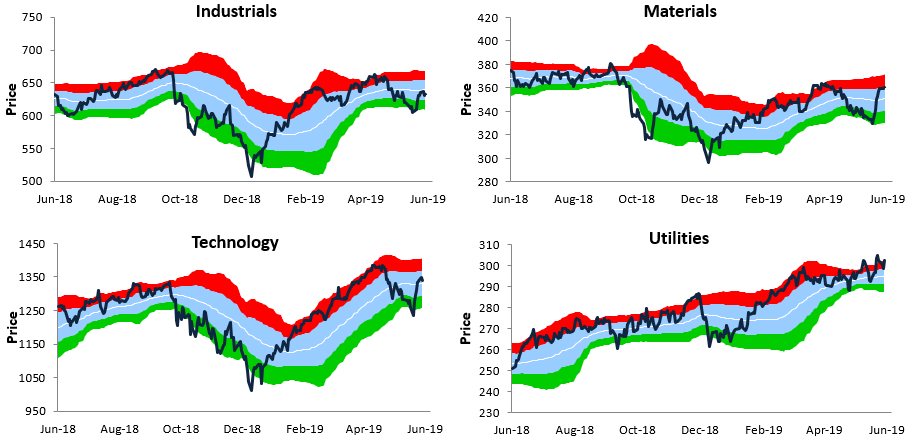
Every Thursday we publish the trading range charts below in our Sector Snapshot report. Start a two-week FREE TRIAL to Bespoke Premium to read our weekly Sector Snapshot report every Thursday. Along with these price charts that help identify overbought and oversold levels for sectors, we also publish breadth charts of the 10-day advance/decline line and the percentage of stocks above their 50-day moving averages. Additionally, we include relative strength charts and PE charts so that when put together, investors get a very clear picture of how the S&P’s major sectors all look at the moment.
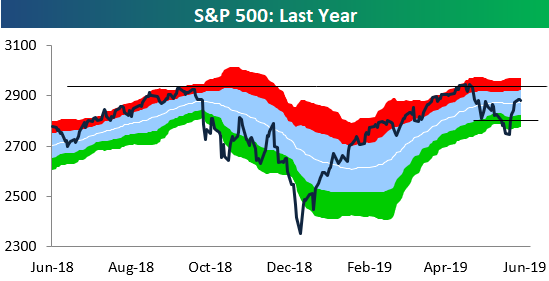
As shown below, the S&P 500 is currently about as neutral as it gets. The index is just above its 50-day moving average, and right in between a key resistance level on the upside and a key support level on the downside.
Looking at individual sectors, two defensives — Consumer Staples and Utilities — are currently in the strongest uptrends, which doesn’t say much for the health of the rally. However, we have seen cyclical sectors like Consumer Discretionary, Materials, Financials, and Technology all re-take their 50-day moving averages recently. Health Care has also popped over the last few weeks, which has caused it to put a dent in the longer-term downtrend channel that had been in place for the sector all year.
On the weaker side, Industrials hasn’t managed to get back above its 50-day moving average yet, and neither has Communication Services due to weakness from mega-cap companies like Alphabet (GOOGL) and Facebook (FB) that are dealing with anti-trust issues. The Energy sector is by itself with the weakest chart pattern by far. Like these charts and want to see more of them? Start a two-week FREE TRIAL to Bespoke Premium to view them in our Sector Snapshot report every Thursday.
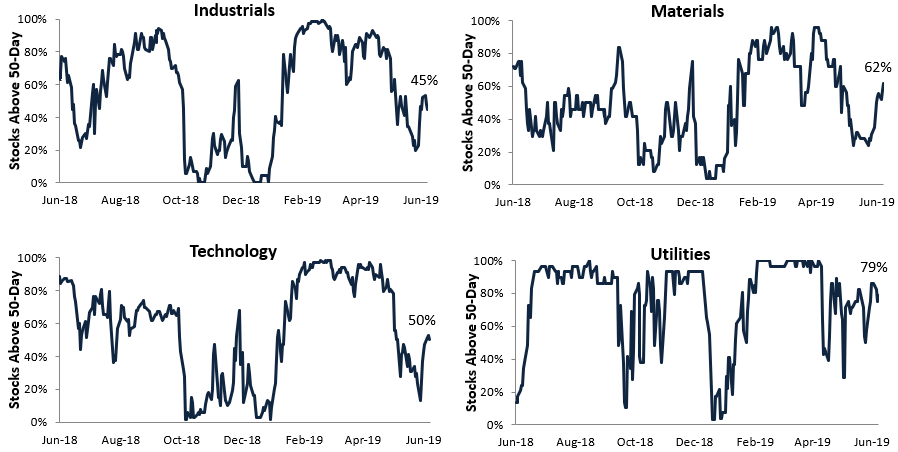
S&P 500 Sectors: Percentage of Stocks Above 50-Day Moving Averages
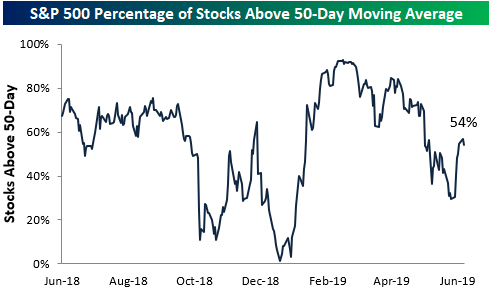
54% of stocks in the S&P 500 are currently trading above their 50-day moving averages. This indicator has been in a downtrend since peaking in February when breadth exploded higher.
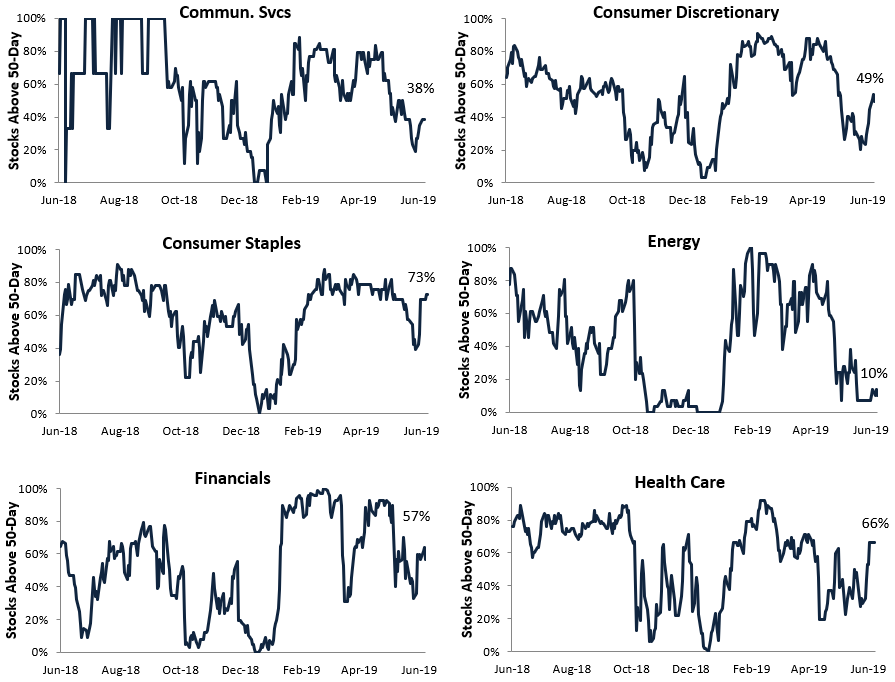
Below we show similar breadth readings by S&P 500 sector. Utilities, Consumer Staples, Health Care, and Materials currently have the strongest readings (all above 60%), while Energy is currently the weakest sector with just 10% of its stocks above their 50-day moving average.
The ever-important Technology sector currently has a reading of 50%, which means exactly half of the sector’s stocks are above their 50-DMAs. It doesn’t get more neutral than that!
Given its massive weighting, whichever direction Tech breaks in the coming days will likely set the near-term trend for the overall market. Start a two-week FREE TRIAL to Bespoke Premium to read our weekly Sector Snapshot report every Thursday.
LULU and RH Keep Up Interesting Earnings
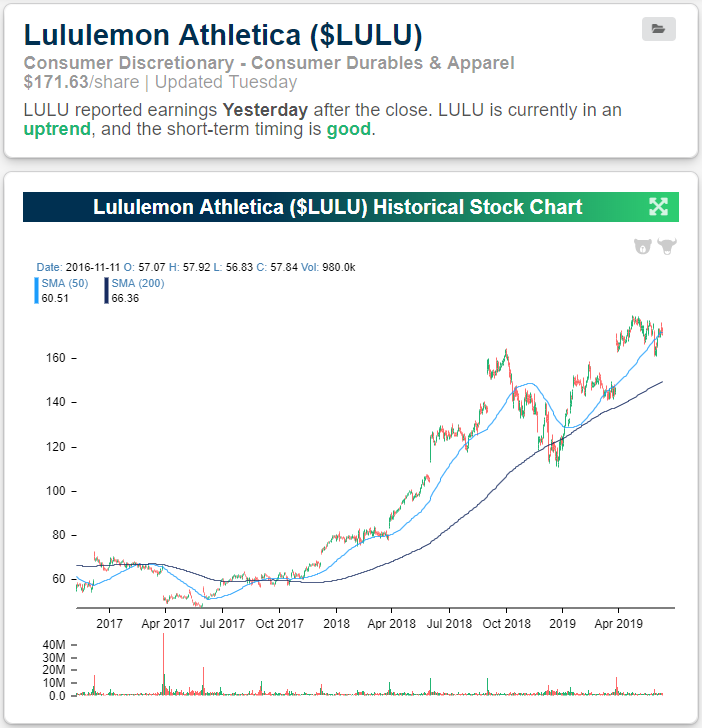
After yesterday’s close, there were two notable earnings reports from a pair of retailers: Lululemon (LULU) and Restoration Hardware (RH). Both stocks are seeing impressive positive reactions in response to earnings this morning with LULU up 6.35% ahead of the open and RH exploding higher, now up 26.80% as of this writing. These strong responses are pretty in line with the stocks’ histories over the past few years.
In LULU’s case, the company beat EPS estimates by 4 cents and revenues came in 20.4% higher than last year at $782.3 million versus estimates of $755.92 million. The company also kept inline guidance. Over the past couple of years, the company has been reporting more of these of solid quarters, and the stock price has reflected that. Prior to 2017, the stock had been meandering sideways and reporting unimpressive earnings results (frequently lowered guidance and some EPS or revenue misses). But since its March 2017 report when EPS missed and guidance was lowered (the last time either of these happened)— which led the stock to gap down over 20% right around $50—LULU has been on the up and up with EPS and revenue beats every quarter (now 9 straight). Additionally, there were multiple quarters with raised guidance which prior to 2017 had not happened since 2010. Today will mark the ninth time since that weak quarter in March 2017 that the stock will gap up at the open of trading following earnings. These more positive fundamental trends have led the stock to sit in a solid uptrend over the past couple of years and today’s gap higher will bring it to a new all-time high. While most of retail is stalling out these days, LULU is still firing on all cylinders.

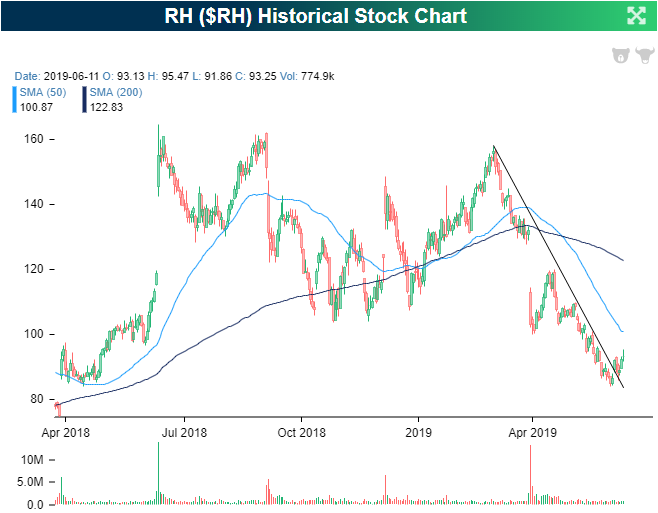
Restoration Hardware (RH) has been rocketing higher in pre-market trading and is currently up 26% versus yesterday’s close. Last night the company reported a triple play with raised guidance, EPS of $1.85 versus estimates of $1.53, and revenues just under $15 million above estimates. That is the first triple play for RH since 2013!
RH’s massive share price move on earnings is nothing new for the stock. On average in the course of its history as a public company, the stock sees a full day swing in either direction of 12.95% on its earnings reaction day. The past several quarters, like this quarter, have seen above-average volatility. Looking over a few from the past year, RH has seen moves of -21.97%, -13.07%, +30.55%, +22.48%, ad 44.76%. Over the past several months, the stock has been in a downtrend. As recently as March, RH was trading above $150, but it had fallen all the way down to the mid-$80s by early June. Over the past two weeks leading up to last night’s earnings report, the stock managed to break above its downtrend line, and today’s positive response to earnings is likely to erase a sizeable portion of the losses from the past few months. Start a two-week free trial to Bespoke Institutional to access our interactive Earnings Explorer and much more.

Morning Lineup – That’s No Bull
As one might expect given the big rally over the last several days, bullish sentiment on the part of individual investors ticked higher this week, but at just 26.8%, the latest sentiment survey from AAII shows that the vast majority of investors have been slow to get back in the pool as bearish sentiment remains elevated at 34.20% and the percentage of investors who just can’t make up their mind increased to 39%.
For today, all eyes are on Jobless Claims which came in at 222K versus estimates for a reading of 215K. Going forward, this afternoon’s earnings report from Broadcom (AVGO) will help to decide the path that semis take to close out the week. Please read today’s Morning Lineup for our latest take on events from overnight and this morning, including Industrial Production out of Europe and German Auto Exports.
Bespoke Morning Lineup – 6/13/19

On the subject of Industrial Production out of Europe, this morning’s print of a decline was right inline with expectations, but that doesn’t mean it was particularly good. As shown in the chart below, m/m readings have now only increased two times in the last eleven months!

Start a two-week free trial to Bespoke Premium to see today’s full Morning Lineup report. You’ll receive it in your inbox each morning an hour before the open to get your trading day started.
The Closer – State Equity Gains, CPI Wanes, No Deficit Pains – 6/12/19
Log-in here if you’re a member with access to the Closer.
Looking for deeper insight on markets? In tonight’s Closer sent to Bespoke Institutional clients, we show equity market returns broken up by the states that companies are headquartered in. With a busy day in macroeconomic data, we then look at today’s release of CPI data in addition to what the New York Fed’s Underlying Inflation Guage is showing. We also use monthly budget statement data released today to get a read on the impact of tariffs and government deficits. We finish with EIA Petroleum data which showed a build in inventories which sent oil prices lower today.
See today’s post-market Closer and everything else Bespoke publishes by starting a 14-day free trial to Bespoke Institutional today!
Fixed Income Weekly – 6/12/19
Searching for ways to better understand the fixed income space or looking for actionable ideas in this asset class? Bespoke’s Fixed Income Weekly provides an update on rates and credit every Wednesday. We start off with a fresh piece of analysis driven by what’s in the headlines or driving the market in a given week. We then provide charts of how US Treasury futures and rates are trading, before moving on to a summary of recent fixed income ETF performance, short-term interest rates including money market funds, and a trade idea. We summarize changes and recent developments for a variety of yield curves (UST, bund, Eurodollar, US breakeven inflation and Bespoke’s Global Yield Curve) before finishing with a review of recent UST yield curve changes, spread changes for major credit products and international bonds, and 1 year return profiles for a cross section of the fixed income world.
In this week’s report we take a look at which parts of the fixed income markets are getting cheap thanks to the shift in short-term interest rates.
Our Fixed Income Weekly helps investors stay on top of fixed income markets and gain new perspective on the developments in interest rates. You can sign up for a Bespoke research trial below to see this week’s report and everything else Bespoke publishes free for the next two weeks!
Click here and start a 14-day free trial to Bespoke Institutional to see our newest Fixed Income Weekly now!
US Dividend Yields Significantly Lower Than Rest of World
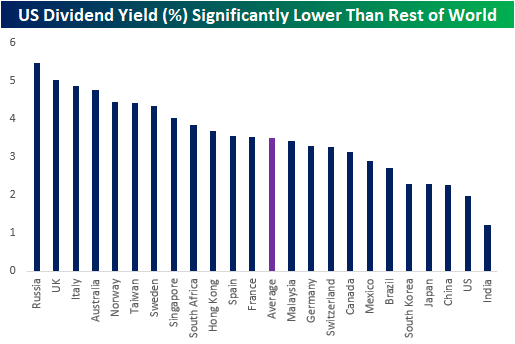
When it comes to dividends, the US may not be the best country for investors to look for a higher yield. US equities currently have a dividend yield of only 1.98%, well below the average of 3.51% for the 22 other major global economies that we track in our Global Macro Dashboard. The only country with a lower dividend yield is India with a 1.21% yield. A potential reason for this comparatively low yield in these two countries is simply higher equity prices. India runs away with the highest valuation of their equities with a P/E of 28.56; the highest among the 23 countries in our Global Macro Dashboard. The US similarly is not cheap relative to the rest of the world as it possesses the fourth highest valuation of 18.33x earnings. That compares to a world average of only 15.72.
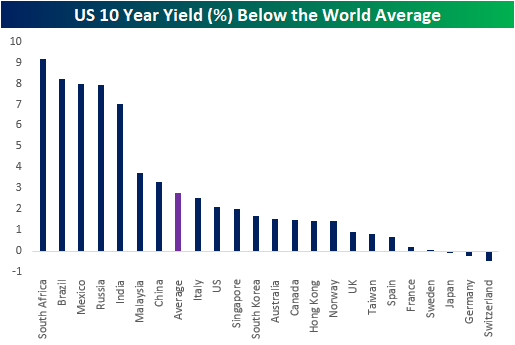
Over the past month, the yield on the 10 Year US Treasury Note fell considerably from over 2.5% at the beginning of May to 2.13% today. Unlike the dividend yield, the 10 year still holds up better than most of the world. The US has a higher yield than the comparable security for 14 other countries. Even with the yield coming down recently, it is still far more attractive than the negative yields on Japanese, German, and Swiss 10-years.
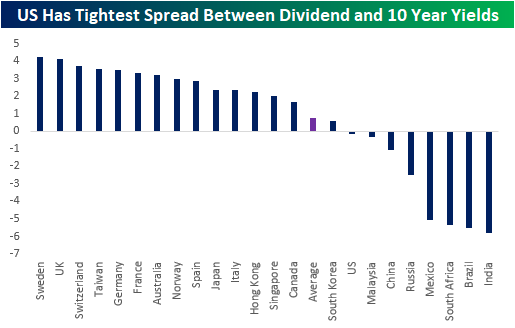
One more interesting dynamic of the US compared to the rest of the world is the very tight spread between the dividend yield and the 10 year. Currently, the dividend yield is only 15 bps lower than the 10-year yield for the US. Nine other countries similarly have a higher yield in their 10-year note. With such a low yield on dividends, India has the widest spread in favor of the country’s government debt, while on the other end of the spectrum, Sweden has the widest spread in favor of dividends. Start a two-week free trial to Bespoke Institutional to access our Global Macro Dashboard and much more.
Crunch Time For Semis
The next couple of days could prove to be very important for the semis. After falling just shy of 20% from its intraday high in mid-April to its intraday low at the end of May, the Philadelphia Semiconductor Index (SOX) rallied over 10% to yesterday’s intraday high before pulling back into the close. The fact that the SOX pulled back where it did is notable because it came right as the index had retraced 50% of the decline from the April highs. As shown in the chart below, the mid-point between April’s high and May’s low was 1,445.78, and yesterday’s high was less than five points lower at 1,440.8. Semis opened lower again this morning, so the longer the weakness persists, the more it will look like a failed rally. But if the group bounces from here or even marks time near current levels and then bounces, it would send a positive signal for the group and broader tech in general.

Using our Custom Portfolio tool that’s available to subscribers, we created the custom portfolio below of large-cap stocks in the SOX index to show where each semiconductor name stands relative to its normal trading range. If you’re a Bespoke Premium or Bespoke Institutional member, you can track this group going forward by clicking here to add it as a new custom portfolio. For each stock listed, we show the most recent closing price, how the stock has performed YTD and over the last five trading days, and where the stock is trading relative to its 50-DMA. On the right side of the table, we also include our proprietary Trend and Timing Scores along with where each stock is with respect to its trading range.
Looking through the list, the majority of stocks are up over 4% in the last week, so they’ve definitely had a nice few days. Despite the gains, though, just two stocks listed are trading at overbought levels, and only four are above their 50-DMA. Given they aren’t even close to overbought, the group clearly has more room to run. At the same time, though, if the rally fails to hold before the majority of members could even get back above their 50-DMAs, that wouldn’t say much for the group’s prospects. To use our Custom Portfolio and Trend Analyzer tools, start a two-week free trial to Bespoke Premium.

Trend Analyzer – 6/12/19 – Health Care (XLV) Coming Back
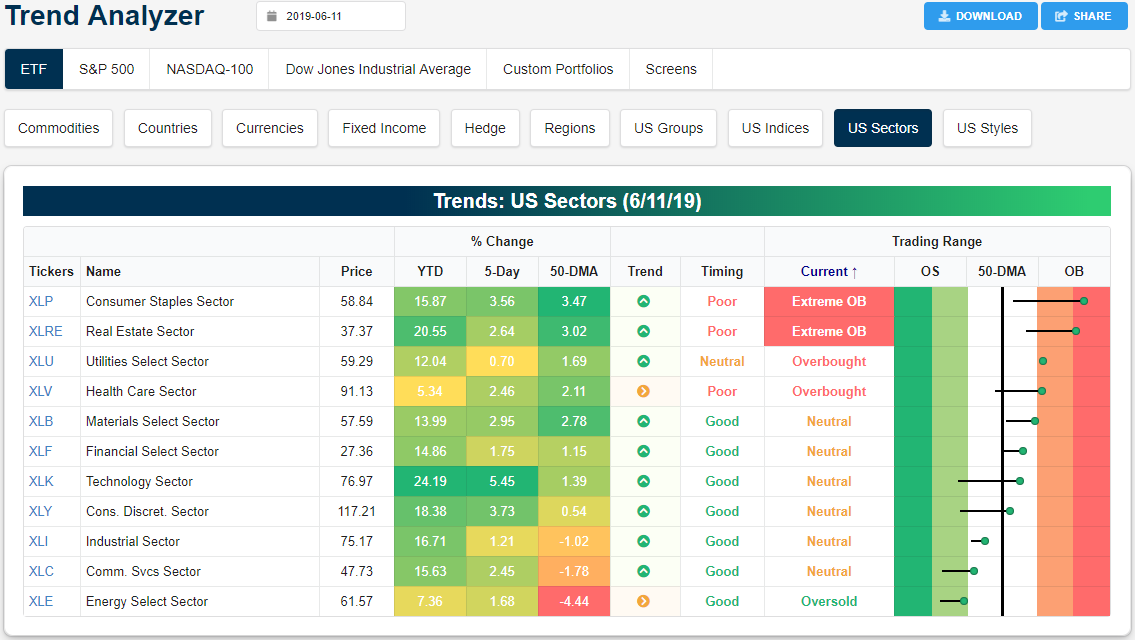
Even with declines yesterday, most of the major index ETFs have managed to hold above their 50-DMAs. Six of the fourteen currently sit under this moving average including the Nasdaq (QQQ), Russell 2000 (IWM), and Micro-Cap (IWC). This comes despite QQQ having the largest gains over the past week (4.85%) while IWC actually has seen the worst performance as the only one of these ETFs to sit in the red. Additionally, IWC is the only major index ETF that is oversold. Perhaps not to the same degree, but this weakness is being shared with other small caps as IWM and the Core S&P Small-Cap ETF (IJR) are teetering on oversold levels and both have seen less than a 1% gain over the past five sessions.

Moving over to the individual sectors, defensives remain broadly overbought with Consumer Staples (XLP) and Real Estate (XLRE) sitting at extreme levels even as they have not necessarily been the best performing sectors in the past week. XLP has been strong with the third best gains of all eleven sectors, but XLRE’s performance has been more middling and Utilities (XLU) has actually moved the least in the past week. Meanwhile, Technology (XLK) has rocketed out of oversold territory, rising 5.45%. While the move hasn’t been as rapid, Health Care (XLV), a sector which we have repeatedly highlighted the underperformance of this year, has begun to press higher. XLV has just entered overbought territory and is at an interesting spot from a technical perspective.
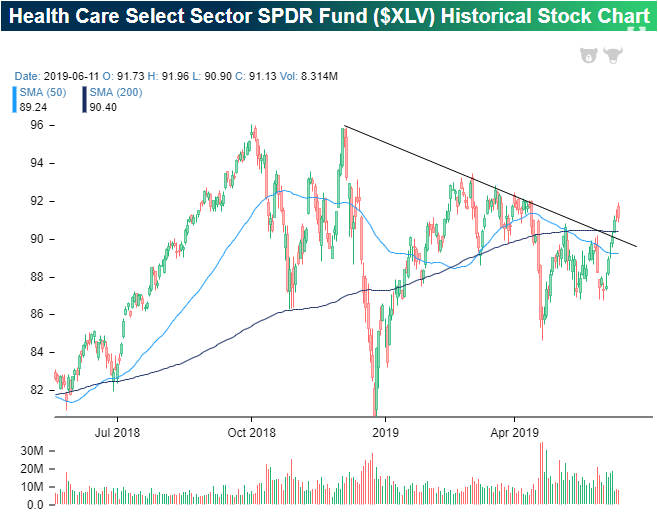
In the past several weeks, XLV has made a few higher lows and more recently has begun to break out to the upside. XLV has moved above both its moving averages as well as its downtrend line originating in the fall of last year, although this week it has paused at resistance from early April. While the past few days’ price action seems like the sector can move lower again, possibly retesting support at the 200-DMA and a recent high around $90, this sort of breakout can be a promising sign for the future of this year’s worst sector. Start a two-week free trial to Bespoke Institutional to access our Trend Analyzer and much more.