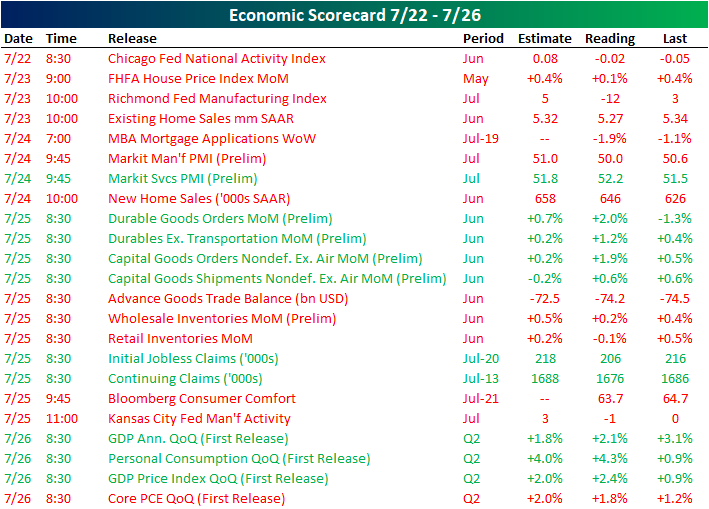
Next Week’s Economic Indicators – 7/26/19
The Chicago Fed’s National Activity Index kicked off this week’s busy macroeconomic data slate on a disappointing note with a still negative reading that was below forecasts. Weak data continued to come in on Tuesday with FHFA home price growth slowing to 0.1% and the Richmond Fed Manufacturing index reaching a multi-year low. Existing Home Sales also came in weaker. Preliminary Markit PMIs released on Wednesday came in below estimates and weaker than the previous month while the services portion saw the opposite results. The release of preliminary Durable Goods and Capital Goods on Thursday came in much stronger than both expectations and the May release. Meanwhile, weekly labor data once again came in at a multi-month low. We ended the week with stronger than expected GDP data, but it still showed the economy slowed versus the first quarter. Overall, economic data didn’t have the greatest of weeks with over half of the indicators released weakening or coming in below estimates.
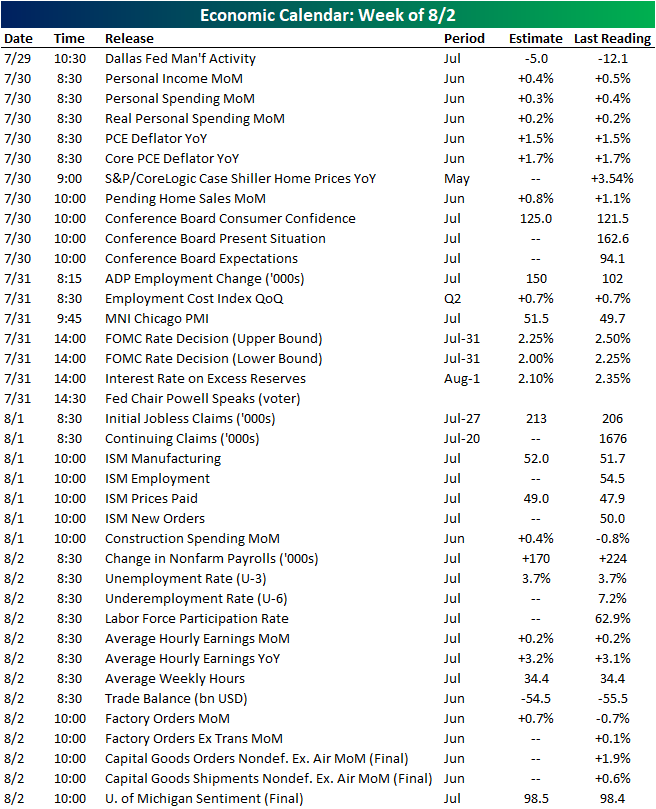
Next week is a busy one when it comes to macroeconomic developments. The week starts off quiet with only the Dallas Fed’s Manufacturing Activity Index out on Monday. It is expected to rebound to -5 off its multiyear low of -12.1 from its June release. Things pick up on Tuesday with the release of personal income and spending data which are forecast to fall 0.1%. PCE data, Pending Home Sales, and consumer confidence will also be out that day. Ahead of Friday’s Nonfarm Payrolls report, which is expected to show 170K added jobs in July, on Wednesday ADP will release their own employment data. Also on Wednesday, there will be an FOMC rate decision followed by a presser by Fed Chair Powell. Markets are anticipating a 25 bps cut in this meeting. After digesting the results of this meeting, on Thursday ISM will release their manufacturing report for July. In addition to the NFP report, the release of the June trade balance, factory orders, and the University of Michigan’s sentiment data will all round out the week on Friday. Start a two-week free trial to Bespoke Institutional to access our interactive economic indicators monitor and much more.
Bespoke’s Morning Lineup – Strong Earnings; GDP on Tap
Ahead of US GDP today earnings headlines are flying, rates are slightly lower, and commodities are mixed. With huge names in tech (GOOGL, INTC, TWTR), quick service food (SBUX, MCD) and health care (ABBV) reporting very good numbers since the close yesterday, the market is poised to gap up over a quarter percent despite relatively weak AMZNnumbers. European earnings are also relatively strong once again.
Continue reading in today’s Morning Lineup.
Bespoke Morning Lineup – 7/26/19

Start a two-week free trial to Bespoke Premium to see today’s full Morning Lineup report. You’ll receive it in your inbox each morning an hour before the open to get your trading day started.
The Closer – Inside Day Reversal, QE Dipsey-Doodle, Looking To GDP – 7/25/19
Log-in here if you’re a member with access to the Closer.
Looking for deeper insight on markets? In tonight’s Closer sent to Bespoke Institutional clients, Given today’s inside day reversal, we show performance following other times this pattern has been observed following all-time highs. We also review the market reaction to confusing policy news out of Europe. We follow up with a discussion of what tomorrow’s GDP release could look like given recent data like the Census Advance Economic Indicators and Durable Goods. We finish with an update of our Five Fed Manufacturing composite with the addition of the Kansas City Fed’s index.

See today’s post-market Closer and everything else Bespoke publishes by starting a 14-day free trial to Bespoke Institutional today!
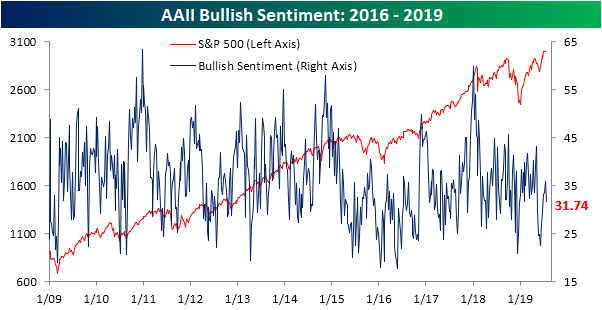
Sentiment Steps Back
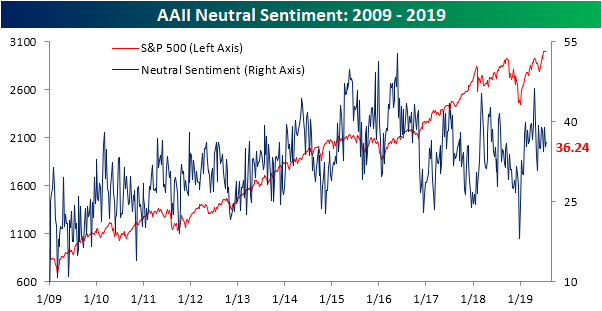
After collapsing below 25% at the start of June, bullish sentiment had rebounded for six consecutive weeks, but this week’s release of the AAII survey snapped that streak. The percentage of bullish investors dropped to 31.74% from 35.93% last week. This comes despite the major indices once again reaching all-time highs yesterday (which admittedly would have little effect on the survey due to timing) and earnings season kicking off to a solid start with rising beat rates and guidance spreads. While this was the biggest drop in bullish sentiment since May, it has not brought the indicator to any sort of extreme low, but it has now been below its historical average for 11 consecutive weeks. While that may sound like a long streak, in the history of the survey—going back to 1987—there have been 19 other such streaks; six of which continued on for twice as long.
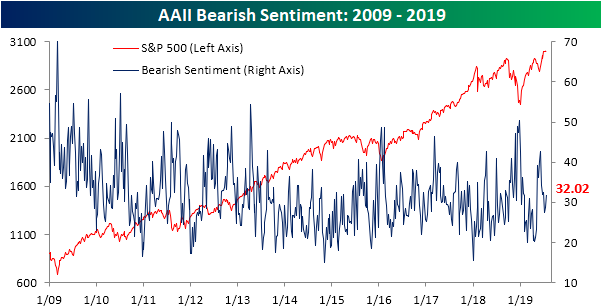
Whereas bullish sentiment fell, bearish sentiment picked up. Bears now outnumber bulls with 32.02% of investors reporting as bearish versus last week’s 28.64%. This is the first time that bears have outnumbered bulls since late June when a streak of nine straight weeks of this came to an end. Bearish sentiment has also now moved back above the historic average of 30.33% after staying below for two weeks. Before that, bearish sentiment was above average for 8 straight weeks.
Although bears outnumber bulls, neutral is still the predominant sentiment level at 36.24%. For a solid chunk of this year—16 of 30 weeks—those reporting as neutral have outnumbered both bulls and bears. That is already more than the entirety of 2018 (14 weeks) and is closing in on that count for 2017 (18 weeks). Neutral sentiment continues to stay in a fairly tight range as it has for most of the year. Start a two-week free trial to Bespoke Institutional to access our interactive economic indicators monitor and much more.
B.I.G. Tips – Checkup on Breadth at New Highs
Throughout the bull market and especially since early 2018 when volatility in the market started to pick up, one factor consistently working in the market’s favor has been breadth, specifically the S&P 500’s cumulative A/D line. Each time the S&P 500 has made a new high, breadth has confirmed the move, and in each of the rallies coming out of corrections, breadth has consistently lead price. With the S&P 500 making another new closing high yesterday, in our latest B.I.G. Tips report we looked at current breadth levels for not only the S&P 500 but also each of the major sectors.
To continue reading this report, start a two-week free trial to Bespoke Premium!
Claims Keep Moving Lower
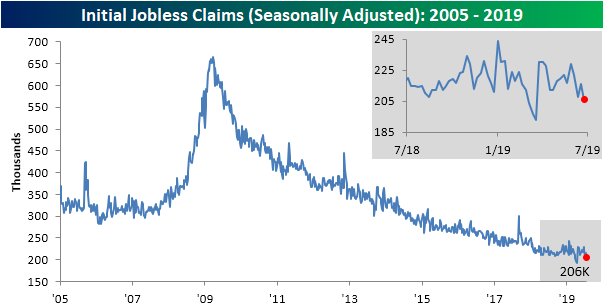
Two weeks after seasonally adjusted initial jobless claims came in at the lowest level in 3 months (208K), this week’s claims data continued to edge even lower dropping to 206K. This 206K number is now only 13K above the multi-decade low of 193K from the April 12th release. Expectations were actually calling for a small increase to 217K from last week’s 216K. This week’s drop also gave some headroom to the record streaks below 250K and 300K which grew to 94 and 229 weeks, respectively. Overall, this was a healthy print for claims as it held up near the lower end of the past year’s range and helped to reaffirm a trend lower of the past several weeks.
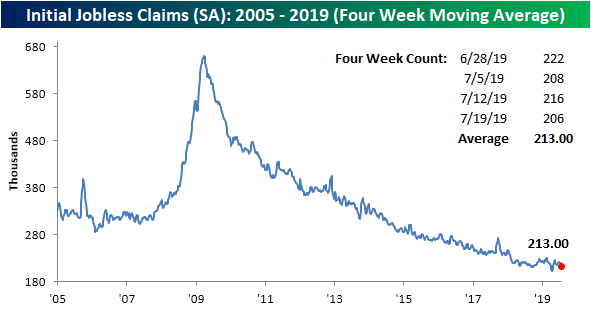
The four-week moving average, which helps to smooth out some of the week-to-week fluctuations, dropped to 213K from 218.75K last week. Similar to the seasonally adjusted weekly number, the moving average is also near the multi-decade lows from April (201.5K). Assuming next week sees another healthy print like we have over the past few weeks and with the recent high of 222K rolling off, the average could continue to grind lower.
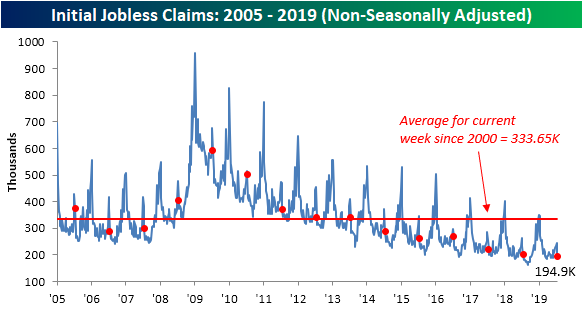
On a non-seasonally adjusted basis, claims came in at 194.9K. This was a sizeable drop of 48.7K from last week’s number. This could be expected though as last week has typically been a seasonal peak for this time of the year. Regardless of seasonality, this drop to 194.9K is still a healthy print as this week’s reading is well below the average for the current week since 2000 and the lowest for the current week of the year of this cycle. Start a two-week free trial to Bespoke Institutional to access our interactive economic indicators monitor and much more.
Trend Analyzer – 7/25/19 – Big Moves In Small Caps
Small and mid-caps’ recent lag has been turned on its head following strong gains in yesterday’s session. Whereas most of these have been at neutral over the past week, today only the Micro-Cap ETF (IWC) has not moved into overbought territory, although it has gotten close to doing so. Small and mid-caps have seen the largest gains over the past five days and have also seen significant moves within their trading ranges as shown through the long tails in the Trading Range section of our Trend Analyzer snapshot below.
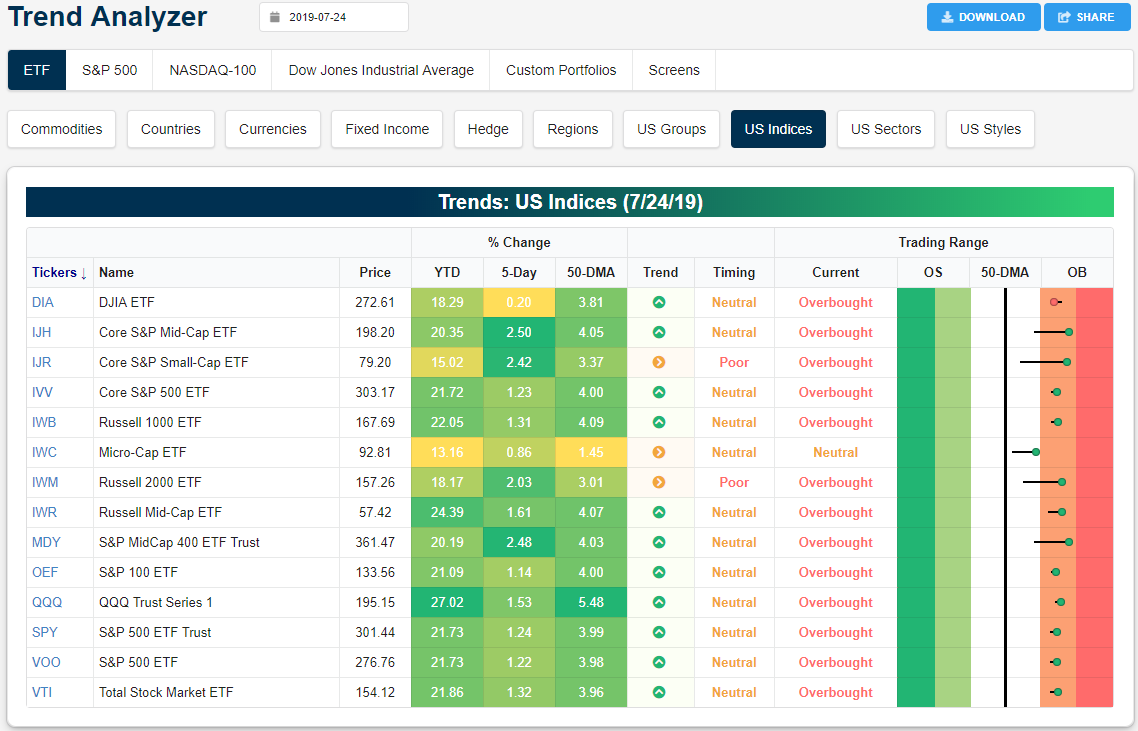
Looking at the charts, yesterday’s strong session for small and mid-caps is evident. Mid-cap ETFs like the Core S&P Mid-Cap ETF (IJH) have broken out above resistance to reach new highs. Meanwhile, small-caps like the Russell 2000 (IWM) and the Core S&P Small-Cap ETF (IJR) have broken out of their short term and a longer-term downtrends. IWC on the other hand still needs to push a bit higher to do the same. Large caps did not see as explosive of a move but the S&P 500 (SPY) and Nasdaq (QQQ) also managed to clear resistance to finish yesterday at new highs.
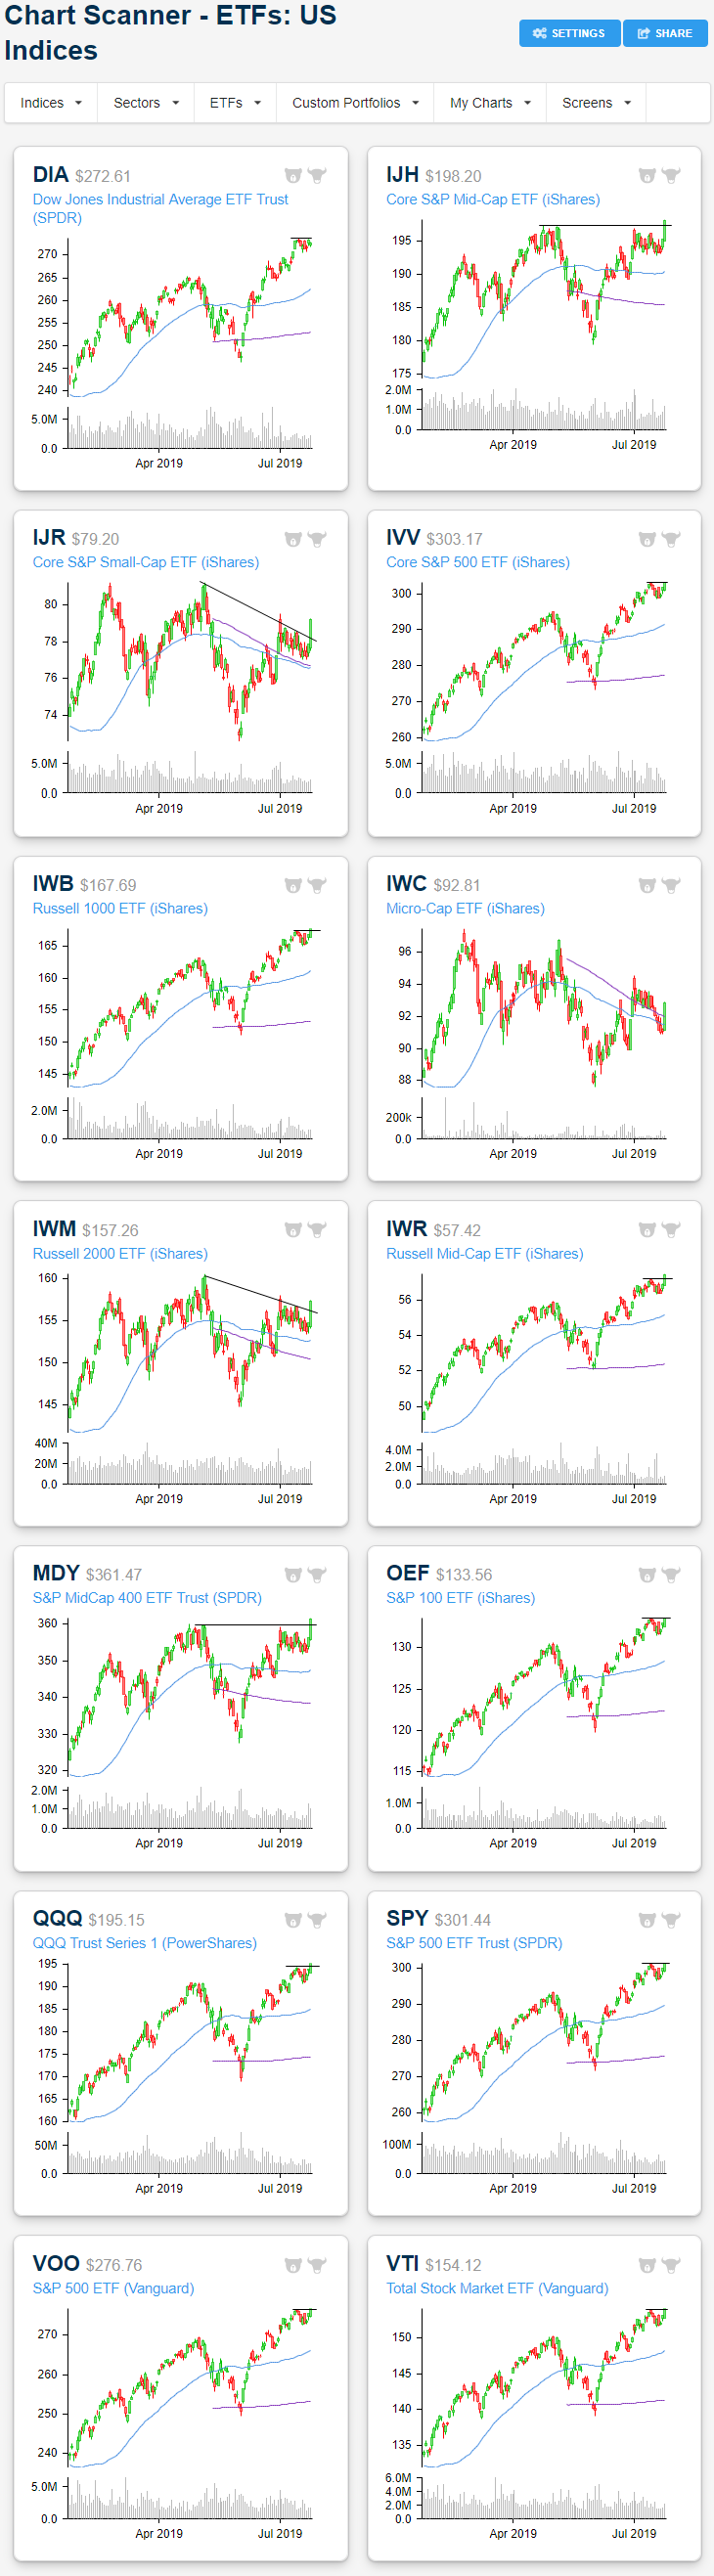
In the past week, it has mostly been more cyclical sectors that have led the way higher with Materials (XLB), Financials (XLF), Industrials (XLI), and Tech (XLK) all gaining well over 2%. On these moves, these ETFs have reached overbought levels. At the same time, defensives like Consumer Staples (XLP), Real Estate (XLRE), and Utilities (XLU) have fallen the most as they mean revert off of overbought levels. Start a two-week free trial to Bespoke Institutional to access our interactive Trend Analyzer, Chart Scanner, and much more.

Russell 2000 Gets in on the Act
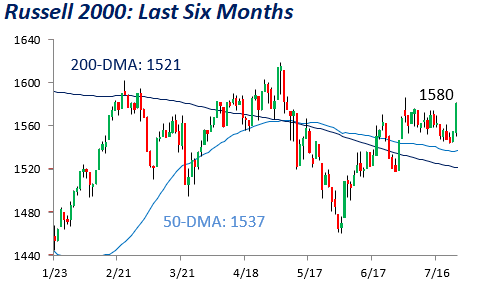
As the S&P 500 and Nasdaq have both been rallying and testing their record highs, small-caps had been lagging behind. In yesterday’s trading, though, even the Russell 2000 got in on the act and rallied. As shown in the intraday chart for the index over the last three weeks, yesterday’s 1.6% rally broke what had been a pretty consistent short-term funk for the sector.
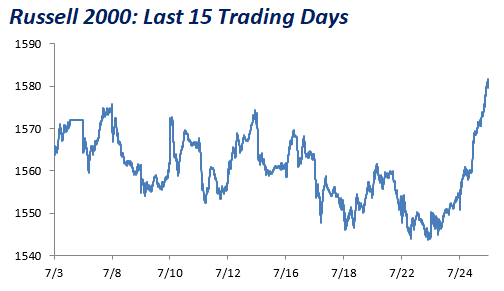
A fifteen-day high for the Russell 2000 is a start, but it still has a ways to go before getting anywhere close to catching up to the large-cap S&P 500 or Nasdaq. Not only is the index still well off its highs from earlier this year, but it’s also still more than 9% from its all-time high made back in August 2018. Start a two-week free trial to Bespoke Institutional for access to our full research suite.
Bespoke’s Morning Lineup – Peak Earnings
As noted in our earnings preview earlier this month, with 61 S&P 500 companies scheduled to report earnings, today marks the peak day for earnings among large-cap companies. With the S&P 500 up over 2.5% heading into today, so far investors apparently like what they hear.
Mario Draghi’s last ECB meeting is a dovish one, with European assets ripping in response to a new look at QE as well as the possibility of tiered deposits at the central bank. US equity index futures were pointing to a decline but now suggest a gain at the open as European credit markets rally. Earnings data last night was mixed but has been generally strong this morning. Yields are down, the dollar is up, and markets are at or near session highs.
Read today’s Morning Lineup to get caught up on news and stock-specific events ahead of the trading day.
Bespoke Morning Lineup – 7/25/19

Start a two-week free trial to Bespoke Premium to see today’s full Morning Lineup report. You’ll receive it in your inbox each morning an hour before the open to get your trading day started.
The Closer – Semis, Machinery, Banks Breaking Out, New Home Sales, EIA – 7/24/19
Log-in here if you’re a member with access to the Closer.
Looking for deeper insight on markets? In tonight’s Closer sent to Bespoke Institutional clients, we kick things off with a look at semiconductors as SMH has broken out to a new all-time high. We also look at the movements in the 3m10y yield curve while cyclical machinery and bank stocks begin to breakout. Turning to economic data, we review today’s New Home Sales release. We also show what staffing provider Robert Half’s (RHI) earnings report indicated on the labor market. We finish tonight with our weekly look at ICI fund flows—showing another week of equity outflows—and EIA data showing a massive drop in production.
See today’s post-market Closer and everything else Bespoke publishes by starting a 14-day free trial to Bespoke Institutional today!