Bespoke’s Morning Lineup – 11/26/19 – It’s Raining Records
See what’s driving market performance around the world in today’s Morning Lineup. Bespoke’s Morning Lineup is the best way to start your trading day. Read it now by starting a two-week free trial to Bespoke Premium. CLICK HERE to learn more and start your free trial.

The Closer – Get Ready for a Snoozer, Soy Sag, Energy Current Account, Trade – 11/25/19
Log-in here if you’re a member with access to the Closer.
Looking for deeper insight on markets? In tonight’s Closer sent to Bespoke Institutional clients, given the shortened week, we begin with a note on seasonality of volumes during the Thanksgiving week. Next, we review the recent damage done to soybean futures. Staying on the topic of commodities, we then take a look at the balance of payments for petroleum and petroleum products. We finish with global trade data and production data from the Netherlands; statistical agency.
See today’s post-market Closer and everything else Bespoke publishes by starting a 14-day free trial to Bespoke Institutional today!
The Most and Least Heavily Shorted Stocks
The average stock in the large-cap Russell 1,000 has 4.9% of its float sold short. As shown below, Communication Services is the most heavily shorted sector, followed by Consumer Discretionary and Energy. Utilities has the lowest short interest levels along with other relatively high yielding sectors like Financials and Real Estate. For the Financials, it has been a big change since the Credit Crisis when the sector was one of the most heavily shorted areas of the market.

Below is a list of the most heavily shorted individual stocks in the Russell 1,000. Each of the stocks listed in the table have at least 20% of their float sold short.
Investors don’t believe in love at first click as online dating company Match Group (MTCH) is at the top of the list with nearly 59% of its float sold short. Cloud “Customer Experience Management” company Medallia (MDLA) is the second most heavily shorted stock with 46.6% of its float sold short, while home and business security company ADT ranks third at 37.5%. Other notables on the list include retailers and other consumer discretionary names like Nordstrom (JWN), Dick’s (DKS), Macy’s (M), Mattel (MAT), Grubhub (GRUB), World Wrestling Entertainment (WWE) and of course, Tesla (TSLA).
Coincidentally, there are four single-letter stock tickers on the list of most heavily shorted stocks, and three of them are W, X, and Z. If only Alleghany (Y) had made it, we’d have the last four letters of the alphabet covered! That will be a long time coming, though, because Alleghany (Y) is actually the 18th least shorted stock in the Russell 1,000 with just 0.77% of its float sold short.

Brown-Forman (BF/A) is the least shorted stock in the Russell 1,000 with just 0.20% of its float sold short. Nike (NKE), Johnson & Johnson (JNJ), Philip Morris International (PM), PepsiCo (PEP), Altria (MO), Microsoft (MSFT), and Amazon (AMZN) are other notable names on the list of least shorted stocks. While tobacco companies like MO and PM certainly aren’t popular in the ESG space, their high dividend yields (which shorts have to pay) help keep the shorts away.
In terms of performance, the Russell 1,000 stocks with more than 20% of their float sold short have posted total returns of 14.81% so far in 2019. While that’s a solid gain, it’s less than the 25%+ that large-cap indices have returned, meaning the shorts have done okay on a relative basis. The 35 least shorted stocks are up 31.27% year-to-date, which is more than double the return of the most heavily shorted stocks. Want to see Bespoke’s most actionable insights in real-time? Start a two-week free trial to Bespoke Premium for immediate access.

Dividend Stock Spotlight: Last Dividends of 2019
Earnings season has come and gone as the number of companies reporting will continue to taper off through the end of the year. From the calendar in our Earnings Explorer tool, the highest number of reports we will see for any given day for the rest of the year is 42 reports on December 5th. With most companies having reported, a large number will now now trade ex-dividend in the coming weeks. In the S&P 500 alone, of the 424 stocks in the S&P 500 that pay a dividend, 149 are scheduled to trade ex-dividend between now and the end of the year. As shown in the chart below, this week will actually be one of the busiest with 49 companies trading ex-dividend. Two weeks from now (the week ending 12/13) will be the second busiest with 41 before the holidays bring things to a crawl.

Below we show the 25 highest yielding stocks that are scheduled to trade ex-dividend before the new year. Major, but beaten down, retailers like Macy’s (M), Kohl’s (KSS), and Nordstrom (JWN) make the list with M boasting the highest yield of 9.65%. Next down on the list is Occidental Petroleum (OXY) with a yield of 7.91%.
Remember, to capture a dividend, you have to own shares as of the last close prior to the ex-dividend date.
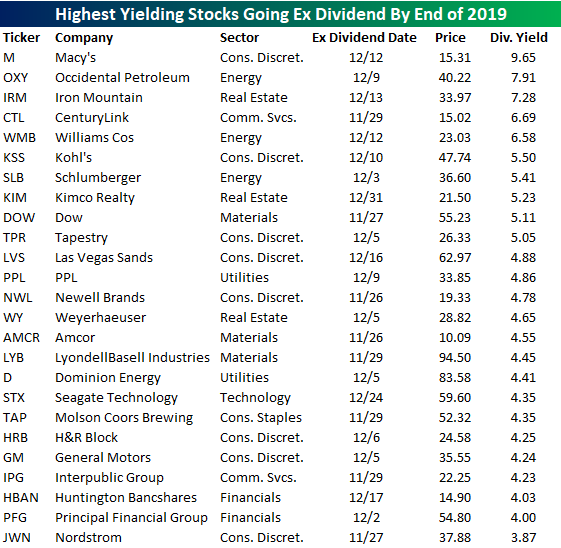
Although the high yields for some stocks like Macy’s (M) and Occidental (OXY) are high due to extended downtrends, a number of these high yielders actually posses fairly attractive charts. Below we highlight a handful that have all traded in uptrends over the past few months. For some, like CenturyLink (CTL), Iron Mountain (IRM), and Las Vegas Sands (LVS), these recent uptrends have allowed the stocks to either break out or at least get close to doing so. In the case of LVS, the past few sessions have even seen a successful retest of this downtrend. LyondellBasell (LYB) is another name that has also successfully held support while Kimco (KIM), Newell Brands (NWL), and Weyerhaeuser (WY) are each in uptrends and currently have “Good” timing scores in our Trend Analyzer. For clients with access, we have also created a custom portfolio of the 25 stocks listed above so that you can easily track them. Looking for access to our Trend Analyzer, Earnings Explorer, and all of our research? Start a two-week free trial to Bespoke Institutional today.

Huge Underperformance of Consumer Discretionary
In a post last week, we noted that despite headlines suggesting the strength of the consumer, Consumer Discretionary stocks have been lagging the market in a major way recently. Another way to illustrate underperfromance is in the rolling 20-day performance of the S&P 500 versus the Consumer Discretionary sector. As of last week, for example, the S&P 500 was up 4.1% over the trailing 20-trading days whereas the Consumer Discretionary sector was down over 1%. That wide of a performance gap over such a short period of time has been extremely uncommon in the last ten years. In fact, it has been non-existent.
The chart below shows the rolling 20-day performance spread between the S&P 500 Consumer Discretionary sector and the S&P 500. Last week’s nosedive in this reading took it below -5% for the first time since coming out of the recession in May 2009! Besides the fact that we haven’t seen a reading this low in so long, we would note that prior to 2009, these periods of short-term underperformance (and outperformance as well) were a lot more common, occurring every couple of years. During the last recession alone, for example, there were at least four periods to both the downside and upside where the spread was wider than +/-5%. These wide performance disparities don’t only happen during recessions either. During the 1990s, there were multiple occurrences to both the upside and downside. Want to see Bespoke’s most actionable insights in real-time? Start a two-week free trial to Bespoke Premium for immediate access.

Russell 2,000 (Small-Caps) Finally Breaking Higher
Small-caps have materially underperformed large-caps recently, but today the Russell 2,000 is having its day in the sun. The Russell is currently up 1.9% on the day versus a gain of just 0.60% for the large-cap S&P 500, and as shown below, a new 52-week high would be made on a closing basis were the index to finish the day at or above current levels. Want to see Bespoke’s most actionable insights in real time? Start a two-week free trial to Bespoke Premium for immediate access.

Expanding the chart above from one year to two years shows that the index still has a ways to go to reach a new all-time high — a further gain of 7.6% in fact.

Bespoke’s Morning Lineup – 11/25/19 – Holiday Cheer
See what’s driving market performance around the world in today’s Morning Lineup. Bespoke’s Morning Lineup is the best way to start your trading day. Read it now by starting a two-week free trial to Bespoke Premium. CLICK HERE to learn more and start your free trial.
Bespoke Chart-Fest
Below are some of our favorite charts published in our research notes and articles over the last week.
As shown below, if the consumer is so strong, why are consumer stocks falling so far behind the S&P 500 lately?


Fridays are “gold” for the yellow metal! Over the last 30 years, owning gold only on Fridays has resulted in a gain of 160.9%. The next closest weekday is Monday with a gain of just 32%.

Are valuations stretched for US stocks? They appear to be for a few sectors. Technology is most notable with a P/E ratio that’s currently in the 99th percentile of all readings over the last 10 years.

While valuations in the Tech sector are getting extended, that’s because Tech stocks have been performing so well. One sector whose stocks haven’t been performing well is Energy, where the average stock is 42% below its 52-week high! You certainly wouldn’t be “buying high” by entering this space.

As shown below, the list of S&P 1500 stocks farthest below their 52-week highs is littered with Energy names that are down more than 2/3rd from their one-year peaks.

If the stock market seems quiet these days, it’s because we haven’t experienced a significant down day in quite some time. As shown below, it has now been 33 trading days since we’ve seen just a 0.50%+ gap down at the open of trading for SPY.

When it comes to earnings estimates, note the big divergence lately between small-caps (Russell 2,000) and large-caps (S&P 500):

Monthly housing starts on a regional basis show a weakening Northeast region and a booming South.

After a rough year two, Trump’s market returns during the standard four-year Presidential Election Cycle have come roaring back in year three. Overall returns for Trump have now doubled the average at this point in the cycle.

Finally, below is a look at the year-to-date performance of the four main “factor” investment styles. Quality has been, well, quality, as this factor has outperformed value, momentum, and size. Want to see Bespoke’s most actionable insights in real time? Start a two-week free trial to Bespoke Premium for immediate access.

Bespoke Brunch Reads: 11/24/19
Welcome to Bespoke Brunch Reads — a linkfest of the favorite things we read over the past week. The links are mostly market related, but there are some other interesting subjects covered as well. We hope you enjoy the food for thought as a supplement to the research we provide you during the week.
While you’re here, join Bespoke Premium for 3 months for just $95 with our 2019 Annual Outlook special offer.
Foreign Affairs
Unequal and irate, Latin America is coming apart at the seams by Daniel Cancel (MSN/Bloomberg)
An uprising against inequality in Chile, the usurpation of a left-wing government in Bolivia, populist leaders in Mexico and Brazil: a catalogue of the volatile political events in Latin America. [Link]
The Iran Cables (The Intercept)
700 pages of Iranian intelligence reports shed light on some of the country’s clandestine dealings over the past few years, including its involvement in Iraqi politics that has led to utter chaos in that country. [Link]
Inconspicuous Consumption
The House Liquor Of The Muslim World by Shuja Haider (The Outline)
How does a liquor brand become ubiquitous in a culture of tee-totalers? What starts as an investigation of Johnny Walker Black reveals a fascinating investigation of alcohol in the Muslim world. [Link]
Two of the Same Ultra-Rare Cars in the Same Town? Almost Impossible by A.K. Baine (WSJ)
One of the most rare cars in the country had a production run of only about 130, and two of them have ended up in Durham, North Carolina together 68 years later. [Link; paywall]
The American Dream
Personal loans are ‘growing like a weed,’ a potential warning sign for the U.S. economy by Heather Long (mySA/WaPo)
The rapid expansion of fintech lenders has driven huge growth in unsecured personal loans, which are helping crowd out other forms of lending. [Link; auto-playing video]
Blackstone Moves Out of Rental-Home Wager With a Big Gain by Ryan Dezember (WSJ)
After making a massive bet on single-family housing rentals in the wake of the financial crisis, Blackstone is finally exiting the space via the final sale of shares in its Invitation Homes investment. [Link; paywall]
World’s Rich Are Rattled and Seeking Old-Fashioned Security by Ben Stupples (Yahoo!/Bloomberg)
The business of protecting other peoples’ valuables is very, very old and has been very, very profitable for a long time, and with extreme wealth driven by both inequality and aggregate economic growth creating a flood of the ultra-wealthy, business is booming. [Link]
Disinformation Studies
Thousands flock to Wikipedia founder’s ‘Facebook rival’ (BBC)
A crowd-sourced and donor-funded Facebook competitor that pledges to never sell user data is starting to gain traction, even though it costs users $100 per year. [Link]
A Former Fox News Executive Divides Americans Using Russian Tactics by Nicole Perlroth (NYT)
Ken LaCorte runs a network of Facebook pages and news sites designed to divide and inspire wide sharing of their stories based on political anger. [Link; soft paywall]
How to recognize AI snake oil by Arvind Narayanan (Princeton University CITP)
As most investors are now aware, buzzwords related to big data and “AI” usually hide basically meaningless processes under the hood. [Link; 21 pages]
Social Studies
Growing sense of social status threat and concomitant deaths of despair among whites by Arjumand Siddiqi, Odmaa Sod-Erdene, Darrick Hamilton, Tressie Mcmillan Cottom, and William Darity (ResearchGate)
The authors argue that rising prevalence of “deaths of despair” are being driven by loss of superior status, basing their argument on the fact that nonwhites are experiencing many of the same socioeconomic pressures but have not seen a higher mortality rate in response. [Link]
Women Desert Trading Floors as Bias Blocks Path to Management by Charlotte Ryan (Bloomberg)
There are few women in management roles within FX businesses run by large global investment banks, and it’s not particularly mysterious why. [Link; soft paywall]
Small Blessings
Coldplay to put touring on hold for environmental reasons by Rory Sullivan (CNN)
The band has decided to turn down tours in order to reduce its impact on the environment. A noble motivation, and one that carries the positive externality of savings thousands from experiencing the band’s “music”. [Link; paywall]
Profiles
What Joe Biden Can’t Bring Himself to Say by John Hendrickson (The Atlantic)
What looks at first glance like a political profile is in actual fact a much more nuanced piece of writing about the author’s experience as a stutterer, told through the lens of Joe Biden’s own experience with stuttering. A unique piece of writing that defies categorical assessment. . [Link; soft paywall]
Time
Days Gone By: Physics Offers Explanation To Why Time Flies As We Get Older by John Anderer (Study Finds)
A Duke University team discovered that increasingly complex nerve pathways really do slow down perceptions of time as humans age. [Link]
Read Bespoke’s most actionable market research by joining Bespoke Premium today! Get started here.
Have a great weekend!
The Bespoke Report Newsletter – 11/22/19 – Rally Gives it a Rest
This week’s Bespoke Report newsletter is now available for members.
US equity indices all broke multi-week winning streaks this week. However, given the fact that we came into the week at extreme overbought levels, the House began public impeachment inquiry hearings, and the possibility of a phase one trade deal with China was thrown in to doubt, we could just as easily argue that market should have been down a lot more. Consider the fact that even Kenneth Starr, the special prosecutor in the Whitewater investigation of President Clinton said that Ambassador Sondland’s testimony had “the potential to be a game-changer.”
In reaction to the ‘bombshell’ testimony, the S&P 500 was down 0.38%. Quick, somebody call the Fed! After this week’s modest declines, not a whole lot has changed in the market’s technical picture. The S&P 500 remains well above its breakout levels from October, and while it may no longer be at ‘extreme’ overbought levels, it remains overbought as it has for a month now.
In this week’s Bespoke Report, we provide our take on everything going on in the market this week, including the action in international markets and small caps, an important development in the semiconductor space, economic data, earnings, and a lot more. To read the report and access everything else Bespoke’s research platform has to offer, start a two-week free trial to one of our three membership levels. You won’t be disappointed!