The Closer – Earnings & Valuation, Quality Cruising, Israel, & Data Round-Up – 11/21/19
Log-in here if you’re a member with access to the Closer.
Looking for deeper insight on markets? In tonight’s Closer sent to Bespoke Institutional clients, after a look at where valuations stand, we delve into the market’s reaction to the political happenings in Israel. Then we show the continued sideways movement of the Leading/Coincident Index. Next, we give an update on Bloomberg’s Consumer Comfort Index which has seen a steady drop in Republican sentiment. Going off of this, we show some of the inconsistencies in consumer based data. After reviewing today’s existing home sales data, we finish with an update on our Five Fed Manufacturing Composite with the addition of the Philly Fed’s index.

See today’s post-market Closer and everything else Bespoke publishes by starting a 14-day free trial to Bespoke Institutional today!
What Does the Market Know About the Consumer That We Don’t?
In just about any economic discussion you read or listen to these days, there’s one recurring theme- the strong consumer is picking up the slack. Strong consumer sentiment and generational lows in the unemployment rate are just two of many examples. A search of the term “strong consumer” on Google Trends also illustrates the strength of the consumer. While there’s still another nine days left in the month, searches for the term “strong consumer” in November are on pace to be the highest in at least a year.

So, we all agree that the consumer is strong. Right? Well, recently the market begs to differ. The chart below shows the relative strength of the S&P 500 Consumer Discretionary sector versus the S&P 500 over the last year. When the line is rising, it indicates that the Consumer Discretionary sector is outperforming the S&P 500. However, when the line is falling it indicates that the Consumer Discretionary sector is underperforming, and underperforming is what the sector is doing now…in a big way. Even as the S&P 500 is up around 4% in the last month, the Consumer Discretionary sector is down 1%. While many traditional brick and mortar retailers that have fallen on hard times are in the sector because these stocks are already down so much, their weighting in the index has become very small. Meanwhile, stocks that have previously been big winners like Amazon.com (AMZN), Home Depot (HD), and McDonald’s (MCD) are the sector’s largest components. Does the market know something we don’t? Sign up for Bespoke’s “2020” special and get our upcoming Bespoke Report 2020 Market Outlook and Investor Toolkit.

Bulls No Longer in Charge
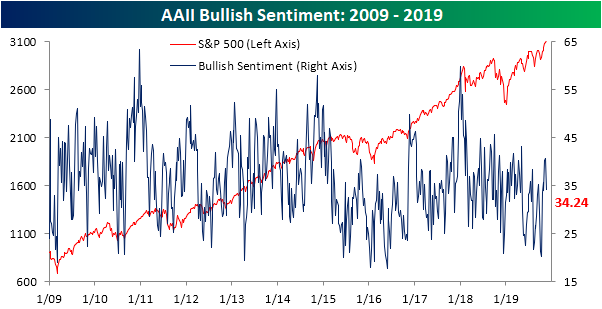
As the S&P 500 has pulled off of its record highs in the past week, investors have been more hesitant to label themselves as bulls. This week’s survey of individual investor sentiment from AAII saw 34.24% of investors responding as bullish compared to 40.72% last week. This was the biggest one week decline since an 8 percentage point drop in the first week of October. After spending two weeks above it, this decline has also brought bullish sentiment back below its historical average. Additionally, this is the first time in two weeks that bullish sentiment was not the predominant sentiment level. Despite this, the bull-bear spread is still in favor of bulls by 5.21 percentage points as has been the case for the past six weeks.
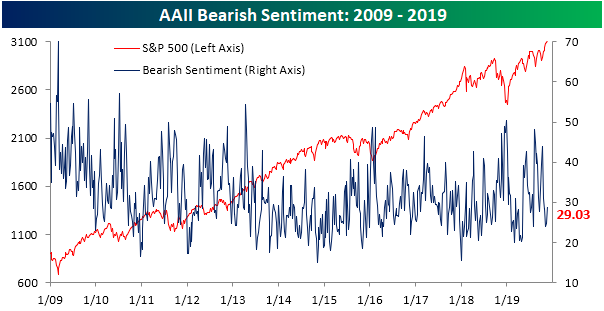
Although the bull-bear spread still leans positive, it has been narrowing over the past couple of weeks. This is on account of bullish sentiment pulling back with those losses going to the bears. Bearish sentiment is now at 29.03%, up from 24.82% last week. Bearish sentiment is still below (but now close) to its historical average of 30.36% as has been the case for the past five consecutive weeks. This is the longest such streak since a seven-week run ending on May 9th.
As mentioned before, bullish sentiment no longer takes the crown for being the predominant sentiment. Instead, the highest share of investors, 36.72%, now consider themselves neutral.
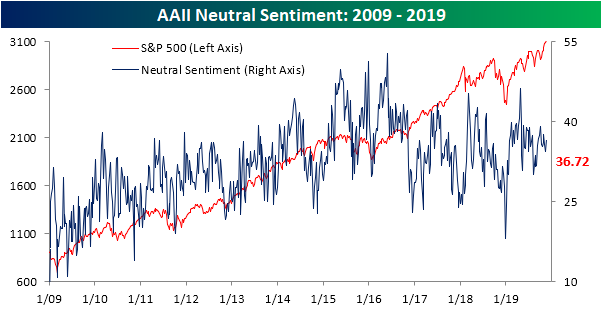
Neutral sentiment has been above its historical average for 15 consecutive weeks now. This is just the eighth time in the history of AAII’s survey where there has been a streak of 15 weeks or more. Most of these have actually occurred in the current bull market with at least one occurring in each of the past five years except for 2018. Even though the current run is long, previous streaks lasted much longer. The current streak is the longest streak since the one in 2017 that ultimately ended at 25 weeks long. Even that was not the longest streak on record though. That accolade belongs to the 41-week streak that lasted from 2015 through late 2016. In other words, there is a historical precedent for extended streaks of above-average neutral sentiment.

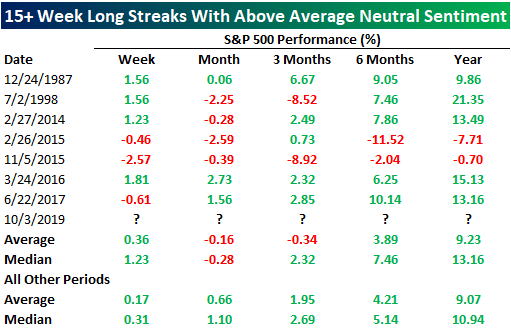
Performance following past streaks once they reach 15 weeks has leaned on the weaker side with underperformance one month, three months, and six months later. One and three months out the S&P 500 has actually averaged a decline. On the other hand, the next week has typically experienced outperformance as has the next year, albeit to a lesser extent on average. Sign up for Bespoke’s “2020” special and get our upcoming Bespoke Report 2020 Market Outlook and Investor Toolkit.
Claims Revised Higher and Stay Higher
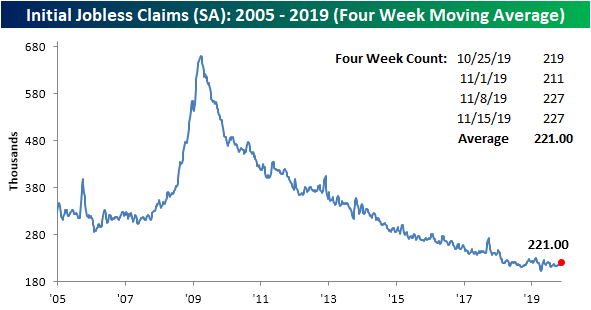
Initial jobless claims last week came in surprisingly high at 225K. That number has since been revised even higher to 227K. Despite expectations of a decline to 218K, this week’s print was unchanged from the previous week’s revised number. The past two weeks’ reports represent the highest level for jobless claims since June 21st’s reading of 229K. Given the lack of improvement this week, the indicator remains above the past few months range, although the record streaks at or below 250K and 300K are still going strong at 111 and 246 weeks, respectively.

Given the increase in the seasonally adjusted number over the past two weeks, the moving average has also begun to tick higher, especially given the narrow range it has remained in recently. Rising to 221K, the four-week moving average is also now at its highest level since June’s when it reached 222.5K. This was also a slight increase, 0.25K, from the same week last year.
Turning to the non-seasonally adjusted data, jobless claims actually fell to 226.4K from 239K last week. That is a bit of a break from the seasonal trend higher towards the year’s highs around this time of year. This week’s reading was down year over year as NSA claims sit well below the average of 335.1K for the current week of the year since 2000.

Continuing claims were also a disappointment in labor data today as they rose to 1695K compared to estimates predicting no change at 1683K. As with initial claims, last week’s number was also revised higher to 1693K. Yet another parallel with initial jobless claims, continuing claims have been fairly flat over the past year. As shown in the second chart below, the year-over-year change in continuing claims can no longer boast the same strength that it has since the start of the cycle. In the final week of September, continuing claims experienced their first year-over-year increase since 2010 when claims were still recovering from the last recession. Since then, claims have seen seven consecutive weeks rising versus last year. Start a two-week free trial to Bespoke Institutional to access our interactive economic indicators monitor and much more.

Bespoke’s Morning Lineup – 11/21/19 – Jobless Claims Stay Near Five Month High
See what’s driving market performance around the world in today’s Morning Lineup. Bespoke’s Morning Lineup is the best way to start your trading day. Read it now by starting a two-week free trial to Bespoke Premium. CLICK HERE to learn more and start your free trial.

Evolving Tastes Drive Changes In Housing Types
In addition to monthly statistics on residential construction released by the US Census earlier this week, there was also a quarterly update on attributes of newly started homes. The data tends to have pretty severe seasonality, so we have seasonally adjusted all of the series below.
Starting with who starts home construction, the vast majority of houses are built for sale by a builder. While there are some owner-built homes, contractors are about twice as common when it comes to single family houses. Multifamily starts are almost exclusively built for rental, with the number started for sale remaining near record lows.

Single family homes are almost always detached, free standing on all four sides. Homes that are attached to others but are still single family are less common. Note the massive drop-off in detached during the housing crash. We’re still not even back to average pre-housing bubble levels for detached single family starts at this point.
Among multifamily units, there used to be a respectable number of multifamily starts with less than 20 units, but over the last half decade or so virtually all starts of multifamily projects have involved projects with more than 20 units.

Finally, the Census also details the size of houses that have been started in the most recent quarter. As shown, from the 1990s to the mid-2010s, the median square footage of newly started homes rose by 20%. Since then, however, changes in taste and affordability have forced builders to economize: median square footage has dropped to the lowest levels since the 2010s and is still falling. Based on square footage trends, it looks like “McMansion Hell” peaked in 2013 and slowly but surely people are coming to their senses. More expensive land reducing footprints, less preference for space, and a desire to reduce sticker prices have all driven lower square footages.
For multifamily, the size of unit starts is a little bit more volatile and hasn’t tended to rise or fall consistently over time. Sign up for Bespoke’s “2020” special and get our upcoming Bespoke Report 2020 Market Outlook and Investor Toolkit.
The Closer – Bulls Bounce Back, Fed Minutes, EIA, Fund Flows – 11/20/19
Log-in here if you’re a member with access to the Closer.
Looking for deeper insight on markets? In tonight’s Closer sent to Bespoke Institutional clients, after looking at equities’ ability to shrug off negative trade headlines today, we recap the most recent Fed minutes. Given the surge in oil today, we then review one of the bullish catalysts: the weekly EIA stockpile data. We finish a read on investor positioning via ICI’s weekly fund flow data.
See today’s post-market Closer and everything else Bespoke publishes by starting a 14-day free trial to Bespoke Institutional today!
Target Nearly a Double With a Below Market Multiple
Even before today, 2019 had been a great year for Target (TGT). While many retailers have succumbed to the forces of gravity, TGT was up over 65% YTD through yesterday’s close. After this morning’s earnings report, though, TGT is up another 14%, taking its total YTD gain to over 95%, or nearly a double! Looking at the chart below, there have been a number of gaps higher in the stock this year, and that’s because much of the stock’s gains have come in reaction to earnings. For example, of the 60 points that the stock has added to its share price this year, 42 of those points have come on the four days that the stock reported earnings!

While TGT has been one of the top-performing stocks in the S&P 500 this year, you may be surprised to learn that it actually still has a slightly below-market multiple. That’s right, while the S&P 500 currently trades at about 20.6 times trailing earnings, TGT’s P/E ratio is slightly less at 20.13. While it may come as a surprise to hear that TGT still trades at a below-average multiple, there are actually three other stocks in the S&P 500 that are up by more on a YTD basis and also have lower P/E ratios than the S&P 500.
The table below lists the 23 stocks in the S&P 500 that are up by more than 50% YTD and still have below market multiples. Topping the list are two semiconductor stocks – Lam Research (LRCX) and KLA Corp (KLAC). Given their cyclicality, semiconductors often trade at below-market multiples, so the fact that they are trading at near-market multiples suggest that they aren’t cheap right now. Bulls would counter that the sector has become less cyclical as evidenced by the relatively shallow down cycle the sector saw last year.
Right above TGT, another notable name is Xerox (XRX). Even after the stock has essentially doubled this year following a takeover offer from HP, it still trades at less than 10 times earnings. Granted, it’s Xerox, but still, it’s not common to see a stock double and still trade at less than 10 times earnings. Looking through the rest of the list, there are a number of other semiconductor-related stocks (AMAT, STX, and QCOM), but another group that stands out is the homebuilders as DR Horton (DHI), PulteGroup (PHM), and Lennar (LEN) have all rallied more than 50% but still trade cheaper than the S&P 500. Sign up for Bespoke’s “2020” special and get our upcoming Bespoke Report 2020 Market Outlook and Investor Toolkit.

S&P 500 Streak Above the 10-Day Average in Jeopardy
As we highlighted in an earlier blog post and in last week’s Bespoke Report, the S&P 500 has pretty much been moving in a single direction over the past month, and that direction is up. Given this run, as of yesterday’s close, the S&P 500 has closed above its 10-day moving average for 29 consecutive trading days. The last time the S&P 500 closed below the 10-DMA was on October 9th. Even intraday, the index only briefly dipped below the 10-DMA once on November 14th. While it is on the ropes today as the S&P 500 has tipped below the average intraday, that 29-day streak is notable. In the past 20 years, there have only been a handful of longer streaks. One of these occurred earlier this year ending at 40 trading days in early March. The current streak would need to last for another two and a half weeks if it is to take out both this streak and the longest of the past 20 years from 2010. That lasted for 42 consecutive days.

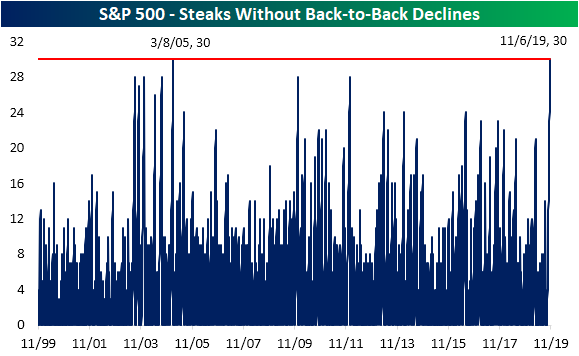
One more point on the S&P 500’s momentum: yesterday also marked just the third day where the S&P 500 fell this month. As the S&P 500 trades lower today, down about 0.77% as of this writing, the index is looking at its first back to back decline since October 8th. That is a streak of 30 consecutive trading days without a back to back decline. While the streak for days above the 10-DMA is impressive, this streak is even more impressive. The only other time in the past twenty years that ran as long was back in 2005; ending on the 30th day. The only longer streaks occurred way back in 1955 and 1950, and both were 37 trading days.
Combining these two criteria, the S&P 500 has spent 29 days above the 10-DMA without also experiencing back-to-back declines. Back in 2004, there was one streak nearly as long at 28 trading days, but in the history of the S&P 500, there has only been one other such run that was longer. That was in 1955, ending at 36 days. Start a two-week free trial to Bespoke Institutional to access the Bespoke Report and other research.

Fixed Income Weekly – 11/20/19
Searching for ways to better understand the fixed income space or looking for actionable ideas in this asset class? Bespoke’s Fixed Income Weekly provides an update on rates and credit every Wednesday. We start off with a fresh piece of analysis driven by what’s in the headlines or driving the market in a given week. We then provide charts of how US Treasury futures and rates are trading, before moving on to a summary of recent fixed income ETF performance, short-term interest rates including money market funds, and a trade idea. We summarize changes and recent developments for a variety of yield curves (UST, bund, Eurodollar, US breakeven inflation and Bespoke’s Global Yield Curve) before finishing with a review of recent UST yield curve changes, spread changes for major credit products and international bonds, and 1 year return profiles for a cross section of the fixed income world.
In this week’s report we take a look at what share of the market is comprised by each tier of ratings.

Our Fixed Income Weekly helps investors stay on top of fixed income markets and gain new perspective on the developments in interest rates. You can sign up for a Bespoke research trial below to see this week’s report and everything else Bespoke publishes free for the next two weeks!
Click here and start a 14-day free trial to Bespoke Institutional to see our newest Fixed Income Weekly now!