Give Thanks For The Big Drop In Claims
Initial jobless claims data of late has been all over the place. In early and mid-November, the indicator broke out of the range that had been in place over the prior several months topping out at 228K which was the highest level since June. Over the past two weeks, though, those higher prints have completely reversed themselves, and this week’s report came in at the lowest level since April’s multi-decade low of 193K.

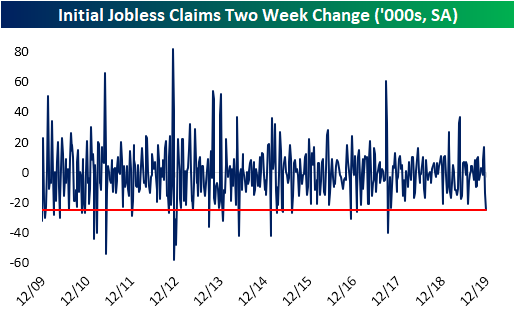
In recent history, it hasn’t been common to see this large of an improvement in claims in such a short period of time. Just two weeks ago, claims had risen by 17K over the prior two weeks. As shown in the chart below, that was the largest two-week increase since the 37K increase in April when claims were coming off of the aforementioned low of 193K. Now, the 25K drop in the past two weeks has been the largest two-week decline since September 2017 when it fell from 300K to 260K. Looking back over the past decade, there have only been a handful of other times where claims have fallen by 25K or more (red line) in the span of two weeks. In other words, claims data has become increasingly volatile in the past month.
Given the recent highs in early and mid-November and new lows in the past two weeks, the four-week moving average is only back to where it was at the start of November. Dropping to 217.75K from 219.75K last week, the 2K drop is only the largest decline since the first week of September. So while the past month has painted a conflicting picture, and seeing as one week does not make a trend, this week’s stronger reading has not had a major impact on longer-term trends. Looking ahead to next week, assuming no major revisions and a similarly strong print next week, the moving average does have the potential to continue to improve as one of 227K readings roll off the average.

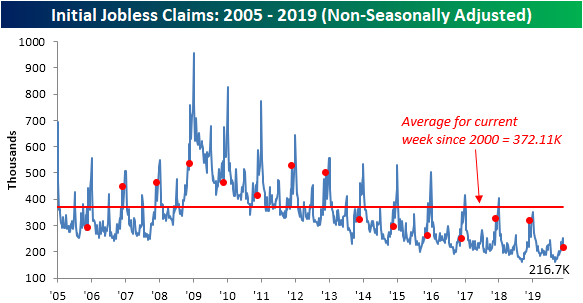
Non-seasonally adjusted data similarly had a strong showing this week with a decline to 216.7K from 252.4K last week. This week’s decline is in the seasonal context of claims rising to their yearly highs. This week’s non-seasonally adjusted claims also continued the trend of readings below the average for the current week of the year since 2000.
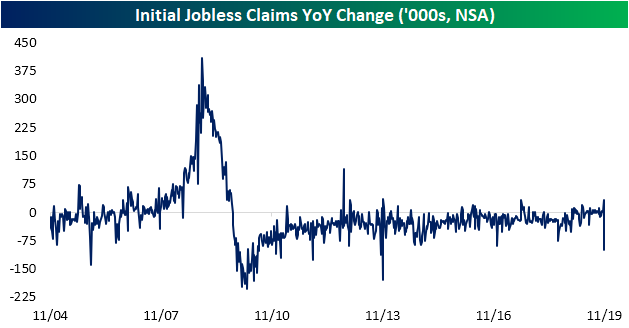
The 35.7K decline week-over-week for the non-seasonally adjusted number was the largest decline since July 19th of this year. Even more notable is the decline year over year which totaled more than 100K. While YoY changes like this were fairly common in the first years coming out of the last recession, there have been only a handful of other times in the past decade that NSA claims have fallen by such a large amount. The last time this happened was in 2013, similarly during a year when Thanksgiving week came one week later than the year before.
While this week’s data certainly showed improvement, due to seasonal factors—namely the timing of the Thanksgiving holiday coming on the 48th week of the year rather than the 47th like the past couple of years—we would be hesitant to take it entirely at face value and jump to the conclusion that labor data has dramatically and concretely improved to the degree that the data suggests. But, even if it should be taken with a grain of salt, an improvement is an improvement. Start a two-week free trial to Bespoke Institutional to access our interactive economic indicators monitor and much more.
Bespoke’s Morning Lineup – 12/5/19 – What Labor Market Weakness?
See what’s driving market performance around the world in today’s Morning Lineup. Bespoke’s Morning Lineup is the best way to start your trading day. Read it now by starting a two-week free trial to Bespoke Premium. CLICK HERE to learn more and start your free trial.

The Closer – The End of the US Energy Trade Deficit – 12/4/19
Log-in here if you’re a member with access to the Closer.
Looking for deeper insight on markets? In tonight’s Closer sent to Bespoke Institutional clients, we begin by showing a decile analysis of what stocks led today’s rally. We also show the relative performance of the equal weight S&P 500 and commodities. We then review Chinese PPI data and the outlook for commercial paper in the US. Next, we recap today’s Bank of Canada rate decision. We finish with a note on petroleum data including the end of the deficit in net exports.

See today’s post-market Closer and everything else Bespoke publishes by starting a 14-day free trial to Bespoke Institutional today!
Fixed Income Weekly – 12/4/19
Searching for ways to better understand the fixed income space or looking for actionable ideas in this asset class? Bespoke’s Fixed Income Weekly provides an update on rates and credit every Wednesday. We start off with a fresh piece of analysis driven by what’s in the headlines or driving the market in a given week. We then provide charts of how US Treasury futures and rates are trading, before moving on to a summary of recent fixed income ETF performance, short-term interest rates including money market funds, and a trade idea. We summarize changes and recent developments for a variety of yield curves (UST, bund, Eurodollar, US breakeven inflation and Bespoke’s Global Yield Curve) before finishing with a review of recent UST yield curve changes, spread changes for major credit products and international bonds, and 1 year return profiles for a cross section of the fixed income world.
In this week’s report we discuss the low cost of FX options.

Our Fixed Income Weekly helps investors stay on top of fixed income markets and gain new perspective on the developments in interest rates. You can sign up for a Bespoke research trial below to see this week’s report and everything else Bespoke publishes free for the next two weeks!
Click here and start a 14-day free trial to Bespoke Institutional to see our newest Fixed Income Weekly now!
ISM Services Weaker Than Expected
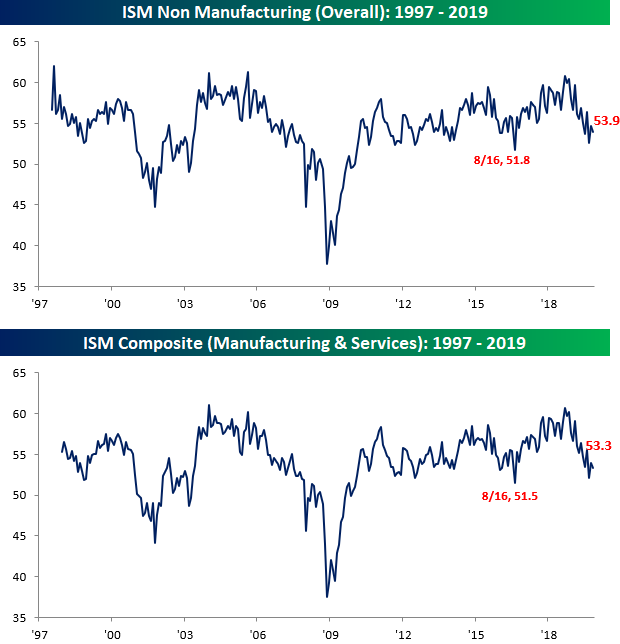
It hasn’t been a great day for US economic data. Less than two hours after the ADP Private Payrolls report missed expectations by around 75K, the November reading in the ISM Services index came in weaker than expected, falling from 54.7 down to 53.9 and below consensus forecasts for a reading of 54.5. Combining this morning’s report with the ISM Manufacturing report from Monday and accounting for each sector’s weight in the overall economy, the November ISM fell from 54.0 down to 53.3.
Looking at the internals of this month’s report, the m/m readings were mixed, while the y/y readings were all lower. Relative to October, more components actually saw increases (5) than declines (3), while two were unchanged. Furthermore, we didn’t see any increase in the number of components in contraction mode (below 50). On a y/y basis, not only is every component lower versus last year at this time, but they are down pretty significantly with an average decline of 6.2 points.
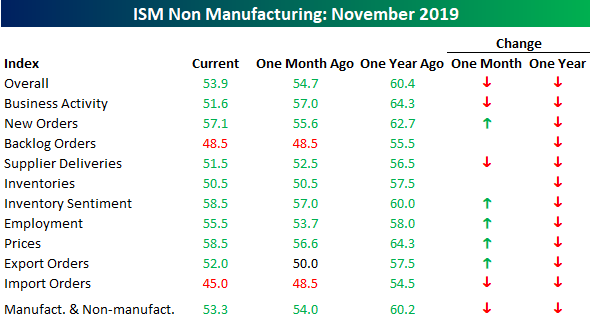
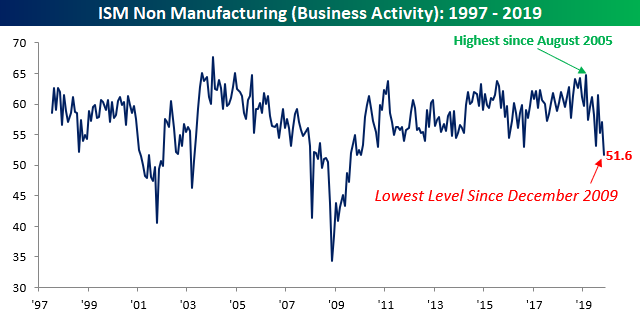
The biggest decliner of them all on a y/y basis is Business Activity. Back in February, this component climbed to its highest level since August 2005. Now, just nine months later, it’s down to its lowest level since December 2009. From a 14-year high to a 10-year low in just nine months. Pretty quick turnaround.
Behind Business Activity, the Imports component of the ISM Services report has also seen a large pullback. After falling from 48.5 down to 45.0, this component is now at its weakest reading since July 2012.

One bright spot in this month’s report, especially with the November Non-Farm Payrolls report coming up on Friday, was the Employment component. With an increase from 53.7 up to 55.5, it saw the largest two-month gain since January 2018. Start a two-week free trial to Bespoke Institutional to access our research reports, interactive tools, and more.

Bespoke’s Global Macro Dashboard — 12/4/19
Bespoke’s Global Macro Dashboard is a high-level summary of 22 major economies from around the world. For each country, we provide charts of local equity market prices, relative performance versus global equities, price to earnings ratios, dividend yields, economic growth, unemployment, retail sales and industrial production growth, inflation, money supply, spot FX performance versus the dollar, policy rate, and ten year local government bond yield interest rates. The report is intended as a tool for both reference and idea generation. It’s clients’ first stop for basic background info on how a given economy is performing, and what issues are driving the narrative for that economy. The dashboard helps you get up to speed on and keep track of the basics for the most important economies around the world, informing starting points for further research and risk management. It’s published weekly every Wednesday at the Bespoke Institutional membership level.
You can access our Global Macro Dashboard by starting a 14-day free trial to Bespoke Institutional now!

Bespoke’s Morning Lineup – 12/4/19 – Attempting a Bounce
See what’s driving market performance around the world in today’s Morning Lineup. Bespoke’s Morning Lineup is the best way to start your trading day. Read it now by starting a two-week free trial to Bespoke Premium. CLICK HERE to learn more and start your free trial.
The Closer – Repo Represent, European Auto Sales, Mexican PMIs, Biotech Excess – 12/3/19
Log-in here if you’re a member with access to the Closer.
Looking for deeper insight on markets? In tonight’s Closer sent to Bespoke Institutional clients, we begin with a review of the current repo market environment. Given the light day for US data, we then take a look at European autos data. We finish with Mexico’s very negative PMI data and the surge that biotech has experienced recently.
See today’s post-market Closer and everything else Bespoke publishes by starting a 14-day free trial to Bespoke Institutional today!
Bespoke Market Calendar — December 2019
Please click the image below to view our December 2019 market calendar. This calendar includes the S&P 500’s average percentage change and average intraday chart pattern for each trading day during the upcoming month. It also includes market holidays and options expiration dates plus the dates of key economic indicator releases. Start a two-week free trial to one of Bespoke’s three research levels.

Bespoke’s Morning Lineup – 12/3/19 – Turnaround (of a Turnaround) Tuesday
US equities are poised to open down over a half percent this morning, and equity index futures are at session lows thanks to fresh trade tape-bombs from the President. His comments, which suggested that he doesn’t think a trade deal is necessary before the election, quickly turned what was a positive picture for equity futures negative (see chart below).
There’s little in the way of economic data on the calendar today, so it looks like another day of China-trade related back and forth. Keep in mind too, that even after yesterday’s pullback, the S&P 500 is over 2.5% above its 50-day moving average and nearly 6% above its 200-day moving average. In other words, we have been overdue for a pause at the very least.
See what’s driving market performance around the world in today’s Morning Lineup. Bespoke’s Morning Lineup is the best way to start your trading day. Read it now by starting a two-week free trial to Bespoke Premium. CLICK HERE to learn more and start your free trial.
