2020 Outlook – Market Cycles
Our 2020 Bespoke Report market outlook is the most important piece of research that Bespoke publishes each year. We’ve been publishing our annual outlook piece since the formation of Bespoke in 2007, and it gets better every year! In this year’s edition, we’ll be covering every important topic you can think of that will impact financial markets in 2020.
The 2020 Bespoke Report contains sections like Washington and Markets, Economic Cycles, The Fed, Sector Technicals and Weightings, Stock Market Sentiment, Stock Market Seasonality, Housing, Commodities, and more. We’ll also be publishing a list of our favorite stocks and asset classes for 2020 and beyond.
We’ll be releasing individual sections of the report to subscribers until the full publication is completed by year-end. Today we have published the “Market Cycles” section of the 2020 Bespoke Report, which focuses on market performance during the late stages of bull markets and bear markets.
To view this section immediately and all other sections, become a member with our 2020 Annual Outlook Special!

2020 Outlook – Economic Cycles
Our 2020 Bespoke Report market outlook is the most important piece of research that Bespoke publishes each year. We’ve been publishing our annual outlook piece since the formation of Bespoke in 2007, and it gets better every year! In this year’s edition, we’ll be covering every important topic you can think of that will impact financial markets in 2020.
The 2020 Bespoke Report contains sections like Washington and Markets, Market Cycles, The Fed, Sector Technicals and Weightings, Stock Market Sentiment, Stock Market Seasonality, Housing, Commodities, and more. We’ll also be publishing a list of our favorite stocks and asset classes for 2020 and beyond.
We’ll be releasing individual sections of the report to subscribers until the full publication is completed by year-end. Today we have published the “Economic Cycles” section of the 2020 Bespoke Report, which takes an in-depth look at historical expansions and recessions and how the current expansion stacks up.
To view this section immediately and all other sections, become a member with our 2020 Annual Outlook Special!
The Closer: End of Week Charts — 12/6/19
Looking for deeper insight on global markets and economics? In tonight’s Closer sent to Bespoke clients, we recap weekly price action in major asset classes, update economic surprise index data for major economies, chart the weekly Commitment of Traders report from the CFTC, and provide our normal nightly update on ETF performance, volume and price movers, and the Bespoke Market Timing Model. We also take a look at the trend in various developed market FX markets.

The Closer is one of our most popular reports, and you can sign up for a free trial below to see it!
See tonight’s Closer by starting a two-week free trial to Bespoke Institutional now!
Earnings Give Ulta (ULTA) The Chance To Fill The Gap
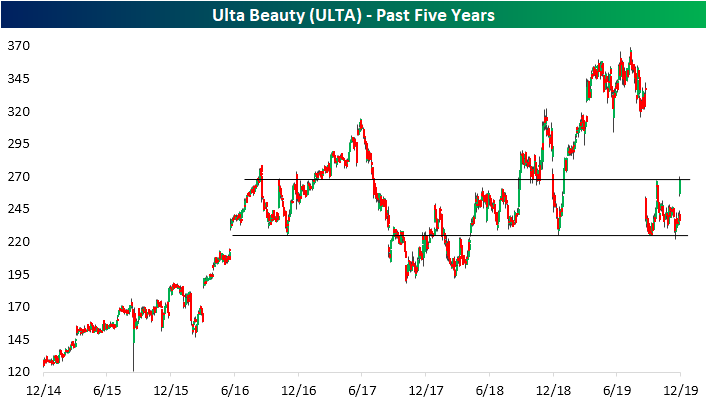
In August, Ulta Beauty (ULTA) missed EPS and sales estimates while also lowering guidance. The stock experienced its worst decline on earnings since it began trading in 2009 with a gap down of over 25% and further downside throughout the day. Ultimately, the stock closed 29.55% lower. ULTA reported third-quarter earnings last night after the close, and the stock has seen quite the turnaround. Although it once again missed revenue estimates, the company beat EPS estimates by 12 cents and guidance was inline. In response today, Ulta is having its single best day since March 11th, 2016 (another reaction to earnings), rising over 12.5%.
Earnings are not the only catalyst for ULTA as the stock has traded around multiple significant support and resistance levels. The massive drop in August brought ULTA down to support in the mid-$220s range. This can be traced back to multiple points throughout the past few years including last December’s lows. Given just how oversold the stock had gotten in August, ULTA experienced a brief run higher before successfully retesting these levels again in the past several days. The jump on earnings today has marked a considerable rebound off of that support and has brought the stock up to resistance in the mid-$260s range. This is another interesting level as it marked the October 1st high following the last earnings report, support in the fall of 2018, and the highs in October of 2016. Assuming the stock manages to break above this resistance, it has the ability to fill the massive August gap. Start a two-week free trial to Bespoke Institutional to access our interactive Earnings Explorers and much more.
Gaps Higher On Jobs Gains Tend To Run
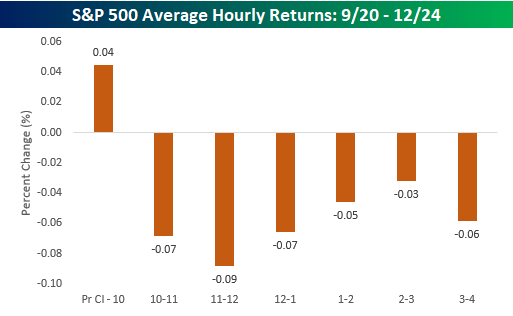
When the monthly Employment Situation Report delivers positive news, equities tend to keep moving higher in the aftermath. The chart below shows the S&P 500’s average intraday performance for the 21 days since 2009 when the S&P 500 gapped up at least 50 bps at the open on NFP days, as it did today. As shown, the morning usually sees a lot of back and forth after the initial gap up, but then we see a major ramp higher from noon to 1 PM ET. From 1 PM to 3:30 PM, the S&P tends to trend lower, and then we see a final batch of buying in the final 30 minutes of trading. Sign up for Bespoke’s “2020” special and get our upcoming Bespoke Report 2020 Market Outlook and Investor Toolkit.
Bespoke’s Consumer Pulse Report — 12/6/19
Bespoke’s Consumer Pulse Report is an analysis of a huge consumer survey that we run each month. Our goal with this survey is to track trends across the economic and financial landscape in the US. Using the results from our proprietary monthly survey, we dissect and analyze all of the data and publish the Consumer Pulse Report, which we sell access to on a subscription basis. Sign up for a 30-day free trial to our Bespoke Consumer Pulse subscription service. With a trial, you’ll get coverage of consumer electronics, social media, streaming media, retail, autos, and much more. The report also has numerous proprietary US economic data points that are extremely timely and useful for investors.
We’ve just released our most recent monthly report to Pulse subscribers, and it’s definitely worth the read if you’re curious about the health of the consumer in the current market environment. Start a 30-day free trial for a full breakdown of all of our proprietary Pulse economic indicators.

Bespoke’s Morning Lineup – 12/6/19 – A Neglected Jobs Report
See what’s driving market performance around the world in today’s Morning Lineup. Bespoke’s Morning Lineup is the best way to start your trading day. Read it now by starting a two-week free trial to Bespoke Premium. CLICK HERE to learn more and start your free trial.

The Closer – Gaps Got Filled, Trade Tumult, Ivey Surge – 12/5/19
Log-in here if you’re a member with access to the Closer.
Looking for deeper insight on markets? In tonight’s Closer sent to Bespoke Institutional clients, we show the gaps that have gotten filled for banks, technology, and quality factor ETFs before delving into today’s trade balance data which was much narrower than forecast. We take a look at the major drivers of this narrowing in terms of products and countries. We finish with a look at October new orders, sales, and inventories data and the turnaround in Canada’s Ivey PMI.

See today’s post-market Closer and everything else Bespoke publishes by starting a 14-day free trial to Bespoke Institutional today!
Less Optimistic But Not Pessimistic
As equities have pulled off of their highs, so too has sentiment which has continued to shift more negative in the three weeks since its recent peak of 40.7%. This week marked a third consecutive week with a decline for AAII’s bullish sentiment reading. Now at 31.72%, it is the lowest level since October 10th when it had fallen to a much lower level of 20.31%. For reference, that was the lowest bullish sentiment reading since May of 2016. This week also marked the seventeenth week in a row that bullish sentiment has been below its historical average. That is the longest such streak since the one ending at 25 weeks in October of 2017. While bullish sentiment has been restrained, levels haven’t been extreme as we’re still within one standard deviation of the historical average.

Another survey determining investor optimism, the Investors Intelligence survey also showed a decline in bullish sentiment this week with 54.8% of respondents reporting as bullish. That is down from the 13-month high of 58.1% from last week. Meanwhile, the survey’s reading on bearish sentiment ticked up to 17.3% and the percentage of respondents looking for a correction rose to 27.9%. Although higher, both of these are only the highest since late October/early November.

While investors have been less bullish, they are not becoming increasingly bearish either. Unlike the Investors Intelligence survey’s slight increase, the percentage of respondents reporting as bearish in AAII’s survey actually fell this week down to 29.13% from 30.28% the prior week. That is the first decline after three consecutive increases, brining it right around the historical average of 30.36%.
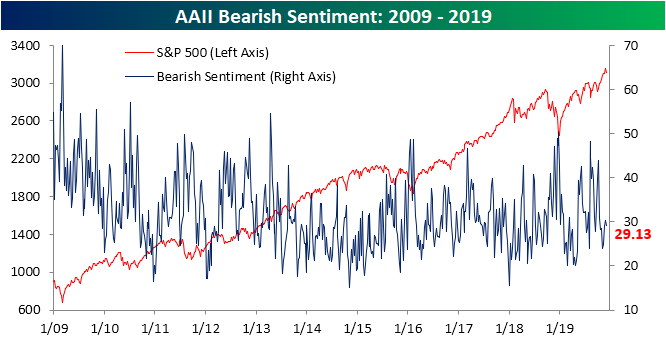
As investors failed to take a bullish or bearish stance, neutral sentiment was the major mover this week rising to 39.16%. The 3.07 percentage point increase was the largest since mid-September as the indicator is back near the upper end of the past year’s range. Start a two-week free trial to Bespoke Institutional to access our interactive economic indicators monitor and much more.

November Employment Report Preview
There’s been quite a bit of conflicting signals in the US labor market recently. After some elevated readings in weekly jobless claims earlier this month, the last two weeks have seen claims come back in with the latest print of 203K marking the lowest weekly print in over six months. While jobless claims have moved back down towards the low end of their range, the latest ADP Private Payrolls report missed expectations by more than 70K. If that’s not confusing enough, the latest ISM data has shown big divergences with the employment component of the manufacturing report falling in four of the last five months while the employment component of the services report has risen for two months straight.
Heading into tomorrow’s Non-Farm Payrolls report, economists are expecting an increase in payrolls of 185K, which would be a 57K increase from October’s reading of 128K. In the private sector, economists are expecting a similar increase from 131K up to 179K. Job growth in the Manufacturing sector is expected to rebound from –36K up to 40K. Even with the expected big increase in Non-Farm Payrolls, the Unemployment Rate is expected to stay unchanged at 3.6% while average hourly earnings are forecast to increase 0.3% compared to October’s reading of 0.2%.

Ahead of the report, we just published our eleven-page preview of the November jobs report. This report contains a ton of analysis related to how the equity market has historically reacted to the monthly jobs report, as well as how secondary employment-related indicators we track looked in November. We also include a breakdown of how the initial reading for November typically comes in relative to expectations and how that ranks versus other months.
For anyone with more than a passing interest in how equities are impacted by economic data, this November employment report preview is a must-read. To see the report, sign up for a monthly Bespoke Premium membership now!