Q3 2025 Earnings Conference Call Recaps: Tesla (TSLA)
Bespoke’s Conference Call Recaps use AI to summarize lengthy earnings calls. The commentary below is AI-generated and then edited by Bespoke for quality control. As always, none of these summaries should be construed as recommendations to buy or sell any securities, and investors should do their own research and/or consult with a financial professional before making any investment decisions.
Our latest recap available to Bespoke subscribers covers Tesla’s (TSLA) Q3 2025 earnings call.
![]()
Tesla (TSLA) designs and manufactures electric vehicles, battery energy storage systems, and AI technologies that extend beyond the auto industry. The company serves consumers, businesses, and utilities through products like its Model Y, Powerwall, and Megapack, while advancing autonomous driving and humanoid robotics through its AI and hardware. Tesla’s deep vertical integration, custom chip design, and manufacturing scale make it a bellwether for the intersection of mobility, energy, and artificial intelligence. Elon Musk called this quarter a turning point as Tesla accelerates real-world AI deployment. The company confirmed plans to remove safety drivers in parts of Austin by year-end and expand Robotaxi service to 8–10 metro areas. Tesla unveiled its AI5 chip (40× more powerful than AI4), manufactured by both TSMC (in Arizona) and Samsung (in Texas). Energy storage reached record deployments, with strong hyperscaler demand offsetting $400M in tariff impacts. The Optimus humanoid robot remains a central focus, with a production-intent prototype coming in Q1 2026. Musk reaffirmed a path to 3M vehicle capacity within two years, driven by Cybercab and AI integration across products. TSLA missed EPS estimates on stronger revenue as the stock opened 4.4% lower on 10/23, though shares rallied back into positive territory intraday…
Continue reading our Conference Call Recap for TSLA by becoming a Bespoke Institutional subscriber. You can sign up for Bespoke Institutional now and receive a 14-day trial to read our newest Conference Call Recap. To sign up, choose either the monthly or annual checkout link below:
Bespoke’s Morning Lineup – 10/23/25 – Stuck in the Middle
See what’s driving market performance around the world in today’s Morning Lineup. Bespoke’s Morning Lineup is the best way to start your trading day. Read it now by starting a two-week trial to Bespoke Premium. CLICK HERE to learn more and start your trial.
“If you want to increase your success rate, double your failure rate.” – Thomas J. Watson, Sr

Below is a snippet of commentary from today’s Morning Lineup. Start a two-week trial to Bespoke Premium to view the full report.
We may be starting to sound like a broken record, but once again this morning, futures are little changed with a downside bias, and the government is still closed. With the Fed in blackout ahead of next week’s rate decision, the only data the market has to focus on domestically is earnings. Overall, the pace of reports continues to come in positively with EPS and sales beat rates in excess of 70%. Also on the subject of broken records, it’s now been eight trading days where the S&P 500 has been stuck within the range it traded in on 10/10.
While the government may be closed, Washington is far from quiet, with the latest news being reports that the Trump Administration is in talks to acquire stakes of up to $10 million in various quantum computing stocks, including IonQ, Rigetti Computing, and D-Wave Quantum. Obviously, these stocks are surging in reaction to the news, and as a result have mostly erased yesterday’s declines. It’s worth pointing out, however, that after the gains these stocks have seen in the last couple of years, their market caps are all at or above $10 billion; a $10 million investment works out to less than 0.1%.
Outside of equities, crude oil is surging 5% and back above $60 per barrel after yesterday’s latest round of sanctions against Russian oil companies. Gold is also trying to regroup after the sell-off from the last couple of days, rallying 1.5% and back above $4,100 per ounce, while silver and platinum are both up at least 2.5%. Even Bitcoin and Ethereum have managed to rally more than 1%.
In international markets, Asian stocks were mixed overnight, with the Nikkei falling 1.4% and the Kospi dropping a percent. Hong Kong (0.7%), China (0.2%), India (0.2%), and Australia (0.1%) all managed to finish higher. The tone in Europe this morning is skewed more positive, with the STOXX 600 rallying 0.3% with little in the way of catalysts besides earnings driving the action.
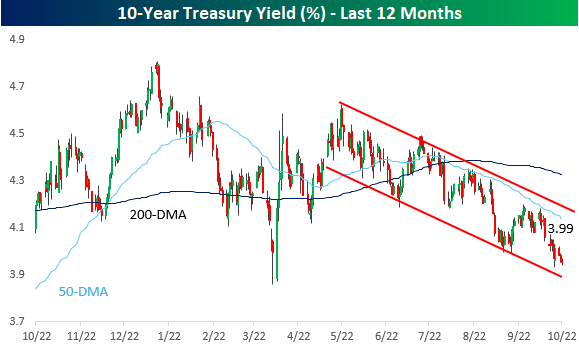
The 10-year yield remains below 4% this morning after trading yesterday at its lowest level since the tariff-tantrum in April. While it wasn’t enough for a 52-week low on an intraday basis, on a closing basis, it was the lowest level since early October of last year. Since peaking at just under 4.6% in May, the 10-year yield has been stuck in a very consistent downtrend channel, and has been moving towards the lower end of that range all month.
The Closer – Rotation, Earnings, Treasury Allotment – 10/22/25
Log-in here if you’re a member with access to the Closer.
Looking for deeper insight into markets? In tonight’s Closer sent to Bespoke Institutional clients, we kick off with a look at the market’s rotation (page 1) followed by a rundown of all the latest earnings including results from Tesla (TSLA), IBM (IBM), and more (pages 2 and 3). We cap off with a look into the latest Treasury auctions (page 4).
See today’s full post-market Closer and everything else Bespoke publishes by starting a 14-day trial to Bespoke Institutional today!
Q3 2025 Earnings Conference Call Recaps: PulteGroup (PHM)
Bespoke’s Conference Call Recaps use AI to summarize lengthy earnings calls. The commentary below is AI-generated and then edited by Bespoke for quality control. As always, none of these summaries should be construed as recommendations to buy or sell any securities, and investors should do their own research and/or consult with a financial professional before making any investment decisions.
Our latest recap available to Bespoke subscribers covers PulteGroup’s (PHM) Q3 2025 earnings call.
![]()
PulteGroup (PHM) is a leading US homebuilder that operates under well-known brands like Pulte Homes, Centex, and Del Webb, delivering thousands of single-family homes annually across 45+ markets. They serve first-time buyers, move-up buyers, and active-adult (55+) communities, offering insight into how large homebuilders navigate affordability, macroeconomic strain, and regional migration. In Q3, the company closed roughly 7,500 homes with home-sale revenue of about $4.2 billion and delivered a 16.8% home-building margin while managing an ROE of about 21%. They noted that buyer demand remains “good, albeit competitive,” but is challenged by weak consumer confidence and stretched affordability, even as interest rates decline. Their active-adult segment grew about 7% in orders, while first-time buyers fell about 14%. They started roughly 6,557 homes and reduced their build cycle to 106 days to manage inventory; spec homes remain near 50% of production, above their 40-45% target, but they’re comfortable with that in the near term. Regionally, Florida and the Southeast showed relative strength, while Texas and the West lagged. On the policy front, they reiterated the US housing shortage (about 3-4 million homes) and flagged a potential $1,500 build-cost headwind per home from tariffs in 2026. They moderated 2025 land spend ($5 billion) but maintain control of about 240,000 lots and noted that easing horizontal development costs (earth-moving/underground) should benefit future lot inflation. On better-than-expected results, PHM shares opened more than 6% lower on 10/21, but recovered the declines by around mid-day…
Continue reading our Conference Call Recap for PHM by becoming a Bespoke Institutional subscriber. You can sign up for Bespoke Institutional now and receive a 14-day trial to read our newest Conference Call Recap. To sign up, choose either the monthly or annual checkout link below:
Q3 2025 Earnings Conference Call Recaps: RTX (RTX)
Bespoke’s Conference Call Recaps use AI to summarize lengthy earnings calls. The commentary below is AI-generated and then edited by Bespoke for quality control. As always, none of these summaries should be construed as recommendations to buy or sell any securities, and investors should do their own research and/or consult with a financial professional before making any investment decisions.
Our latest recap available to Bespoke subscribers covers RTX’s (RTX) Q3 2025 earnings call.
![]()
RTX (RTX), formerly Raytheon Technologies, is one of the world’s largest aerospace and defense companies, formed by the merger of Raytheon and United Technologies. Its three segments (Collins Aerospace, Pratt & Whitney, and Raytheon) span everything from jet engines and avionics to precision missiles and integrated air defense systems. RTX’s technologies power both the world’s most advanced commercial aircraft and critical defense programs like Patriot, AMRAAM, and Stinger. The company serves global airlines, aircraft OEMs, and defense agencies across the US and allied nations, offering an unusually comprehensive view into commercial aviation trends and global defense spending priorities. RTX delivered a strong quarter, with sales up 13% organically. Defense bookings surged as Raytheon’s record $16 billion in new orders drove backlog to $72 billion, 44% international. Commercial aerospace also stayed hot, as resilient global air travel and low aircraft retirements boosted Collins and Pratt & Whitney’s aftermarket sales. Supply chain pressures are easing, with key material output up double digits, while RTX is investing over $600 million in new capacity and deploying AI tools to double missile output. Tariff headwinds (about $90 million per segment) weighed on margins but were offset by pricing strength. Shares were up as much as 11% on 10/21 after reporting the triple play…
Continue reading our Conference Call Recap for RTX by becoming a Bespoke Institutional subscriber. You can sign up for Bespoke Institutional now and receive a 14-day trial to read our newest Conference Call Recap. To sign up, choose either the monthly or annual checkout link below:
Bespoke’s Morning Lineup – 10/22/25 – Mixed Picture
See what’s driving market performance around the world in today’s Morning Lineup. Bespoke’s Morning Lineup is the best way to start your trading day. Read it now by starting a two-week trial to Bespoke Premium. CLICK HERE to learn more and start your trial.
“Women who seek to be equal with men lack ambition” – Timothy Leary
Below is a snippet of commentary from today’s Morning Lineup. Start a two-week trial to Bespoke Premium to view the full report.
The post 10/8 range-bound slog looks set to continue for the S&P 500 today as it enters its eighth day in a row of trading within its intraday range from 10/10. S&P 500 futures are essentially unchanged, while Nasdaq futures point to a modest decline. Yesterday’s weakness in gold and other precious metals has continued this morning, with gold down more than 1%, and while the crypto markets had a positive reversal yesterday, they’re giving it all back today as volatility in that space continues.
Overnight in Asia, most indices saw modest declines, although South Korea managed to buck the trend as it seems nothing can keep the Kospi down. European shares are mixed. The STOXX 600 is trading modestly higher on the session, led higher by the FTSE 100 and Spain’s Ibex 35, while Italy is down 0.5%. This morning’s strength in the UK was catalyzed by a much weaker than expected September CPI report, which showed no change in consumer prices relative to forecasts for an increase of 0.2%.
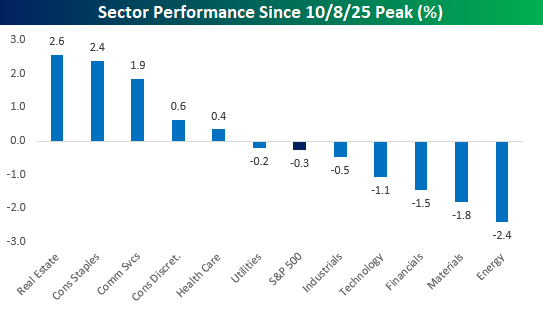
It’s now been two weeks since the S&P 500’s last record high, and while the S&P 500 has seen just marginal declines, some of the moves within sectors have been much larger. As shown in the chart below, Real Estate and Consumer Staples have both rallied over 2% and join Communication Services as the three sectors with gains of over 1%. To the downside, five sectors have declined since the 10/8 high, but four of them are down over 1%, including Energy (-2.4%) and Materials (-1.8%). Technology has also slumped 1.1%, which has acted as the main driver of the index’s decline.
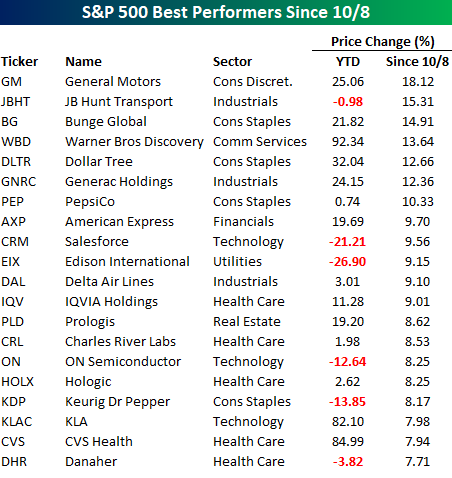
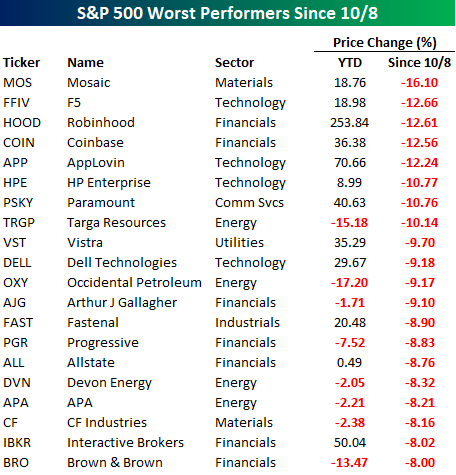
At the individual stock level, it’s been an eclectic mix of winners and losers. Starting with the winners, General Motors (GM) tops the list after yesterday’s post-earnings surge, and it’s one of seven stocks in the S&P 500 that have rallied over 10% since the 10/8 peak. While many of the 20 best-performing stocks in the S&P 500 are handily up YTD, they aren’t exactly the typical winners investors have been used to seeing throughout most of the year. The sector breakdown of these winners further illustrates that trend, as nearly half of the names listed are either from the Health Care (5) or Consumer Staples (4) sectors.
Shifting to the biggest losers, eight stocks in the S&P 500 have seen double-digit percentage declines since the 10/8 peak. Leading the way to the downside, Mosaic (MOS) has declined more than 16%. While many stocks listed have underperformed this year, for stocks like Robinhood (HOOD), Paramount (PSKY), Vistra (VST), Dell (DELL), and Interactive Brokers (IBKR), it has been a pause to potentially refresh.
At the sector level, Financials has been most heavily represented, with over a third of the names listed as concerns in the credit markets have hit some of the names in the sector hard. After Financials, the next most heavily represented sectors are Energy and Technology, with four each.
The Closer – Earnings Review, Gold Gutted, NBFI, 10/21/25
Log-in here if you’re a member with access to the Closer.
Looking for deeper insight into markets? In tonight’s Closer sent to Bespoke Institutional clients, we begin with a recap of all the latest earnings including results from Netflix (NFLX), Capital One (COF), and more (pages 1 and 2). We then dive into the historic decline in gold prices (pages 3 and 4) before turning over to a look into non-bank financial institutions (page 5) and CPI North of the border (page 6).
See today’s full post-market Closer and everything else Bespoke publishes by starting a 14-day trial to Bespoke Institutional today!
200-Day Check-In
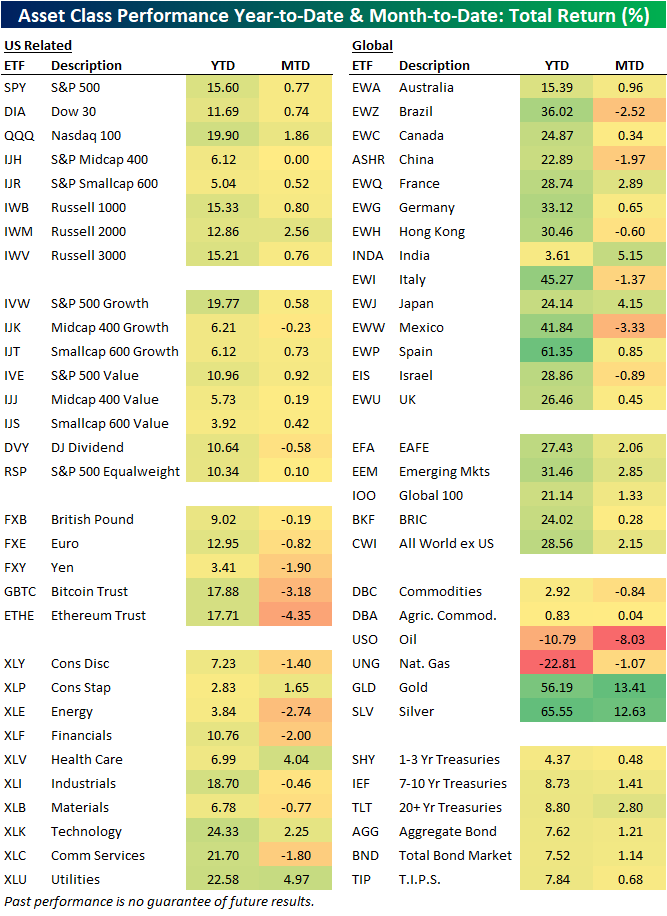
Yesterday marked the 200th trading day of the year. With tariff troubles, new policy implementations, geopolitical tensions, there’s already been a ton for markets to contend with in 2025. However, assets have broadly rallied anyways. In the table below, we show year to date returns through yesterday’s close across a range of ETFs covering a variety of assets both year-to-date through the first 200 trading days in addition to month-to-date for a look at more recent performance.
US equities are up double digits this year with the S&P 500 (SPY) gaining 15.6%, whereas the Nasdaq 100 (QQQ) is nearly up 20%. Small and mid-caps have some variation depending on how you look at them. The broader look at small caps, the Russell 2,000 (IWM), is only slightly underperforming the likes of SPY year-to-date. Meanwhile, the more selective S&P 600 (IJR), which is constructed only using companies that have reported positive earnings, is up a more modest 5% YTD. The midcap S&P 400 (IJH) is also up in the mid single digits. In other words, it has been the more speculative small caps gaining the most. Additionally, growth has outperformed value with the same small and mid-cap weakness relative to large caps.
On a sector level, the single best performer should come as no surprise: Tech (XLK) which has risen 24.3% YTD. The runner up may be more surprising: the historically defensive Utilities sector (XLU), which has gained 22.58%. The only other sector up over 20% is Communication Services (XLC), and two others, Financials (XLF) and Industrials (XLI), are up double digits. All other sectors have risen mid-to-low single digits with declines more recently MTD.
International stock markets using domestically-traded ETFs have handily outperformed the US this year. In fact, of those shown below, only two have underperformed the US (SPY) YTD, and those are Australia (EWA) and India (INDA). Finally, we would note that the single largest rallies haven’t come from the equity space this year as gold (GLD) and silver (SLV) are both up 50%+. In fact, GLD’s 13.4% MTD gain is only a couple percentage points less than what the S&P 500 has gained YTD.
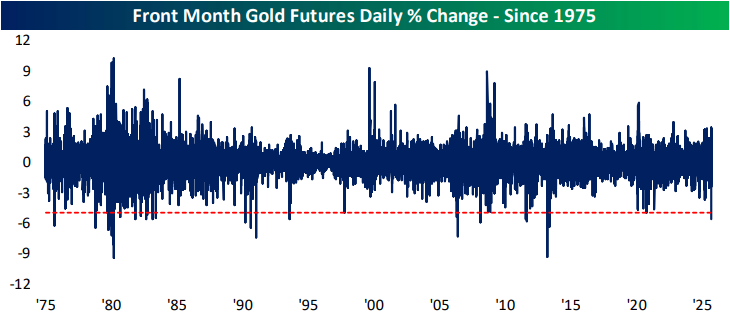
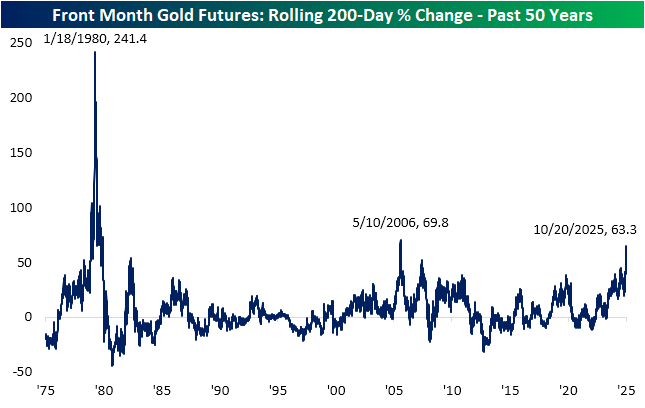
We have frequently noted this year’s strength in gold, although the yellow metal and its cohorts are reverting sharply lower today. We discussed that drop in an earlier B.I.G. Tip in addition to the Morning Lineup. With those declines in mind, that has not stolen from what has been a historic rally for gold prices. As shown below, over a 200-trading day span, gold’s over 60% gain is the largest since 2006; one factor of the rally back then was the emergence of gold ETFs like GLD. Prior to that, the only larger 200-day rally of the past half century came during 1979/1980 when there was a surge from catalysts including high inflation, geopolitical instability, and a speculative frenzy in silver.

Bespoke’s Morning Lineup – 10/21/25 – Strong Run of Earnings Continues
See what’s driving market performance around the world in today’s Morning Lineup. Bespoke’s Morning Lineup is the best way to start your trading day. Read it now by starting a two-week trial to Bespoke Premium. CLICK HERE to learn more and start your trial.
“In hindsight, I slid into arrogance based upon past success.” – Reed Hastings
Below is a snippet of commentary from today’s Morning Lineup. Start a two-week trial to Bespoke Premium to view the full report.
After a strong start to the week yesterday, US stocks are starting Tuesday on a modestly negative note with S&P 500 and Nasdaq futures both down less than 0.10%. The pace of earnings reports is finally starting to pick up, and what has been a strong reporting period so far in terms of results has remained that way this morning. As we type this, of the 14 companies reporting so far this morning, they have all exceeded EPS forecasts, and only one (NOC) missed top-line estimates. You can’t ask for much better than that!
With futures modestly lower, there’s still a lot of time left, but it’s pretty amazing to see that the S&P 500 still hasn’t traded outside of its intraday range from 10/10, which would make it seven straight days of trading inside a prior day’s range. Already, the current period ranks as just the 12th time in the last 40 years, and if the streak extends to seven, it would be just one of eight. For more on the topic, check out today’s Chart of the Day.
Outside of equities this morning, the 10-year yield is still below 4%, crude oil and natural gas are both up 1%, but precious metals are all uncharacteristically getting hit hard. Gold is down over 2%, while silver, platinum, and palladium are all down over 4%. Crypto prices also remain weak as Bitcoin trades back down below $110K and Ethereum is firmly below $4K with a decline of over 2.5%. Neither has been able to get back on track in the last couple of weeks.
Japanese stocks finished off their intraday highs overnight, but, along with other major indices in the region, finished higher on the session. Sanae Takaichi was officially elected PM, but there was a bit of sell-the-news reaction; Chinese stocks were the strongest in the region, finishing up more than 1% on optimism over US trade talks.
Europe is much like Asia this morning, with modest gains across the board. The STOXX 600 is up 0.1%, with Italy leading things higher, rallying by 1%.
Netflix (NFLX) will report earnings after the close today, which reminded us of an earnings report from the company in July 2011, when then CEO Reed Hastings announced that the company would be splitting off its DVD business from streaming, raising prices in the process. For consumers who wanted to continue with both services, the changes resulted in a 60% price hike from $10.00 to $15.98 per month. News of the price hikes and launch of the Qwikster DVD service were received poorly by the company’s customers and investors alike.
Right before the plan was announced, NFLX was trading at record highs, having just rallied 180% in the prior year. Within months, though, it gave up all of those gains, falling more than 70%. While there were other macro-related factors behind that drop, NFLX’s poorly communicated pricing plans and new strategy contributed to the weakness.
Following that decline in the wake of the Qwikster announcement, Hastings issued a public apology regarding how the changes were communicated, which included the quote above. Another month after his apology, Netflix reversed plans to separate the units (but kept the price hikes), relegating Qwikster to the waste bin of other disastrous product launches like New Coke, and more recently, the Cracker Barrel restaurant rebrand. Also, how can we ever forget the Apple Newton, rocking out with the Microsoft Zune, snacking on Olestra-infused WOW! Potato chips, and then the McDonald’s Arch Deluxe for dinner? The story of Qwikster and its demise before ever even launching serves as a reminder that the how of a message’s delivery can take on just as much importance as the message itself. It’s also a lesson that people and companies often become most vulnerable after a long string of successes, just as the feeling of invincibility starts to set in.
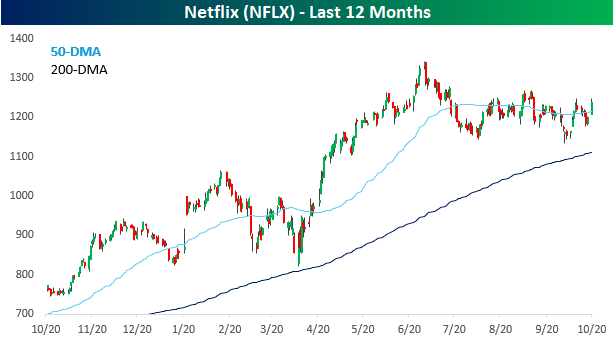
Hopefully, Netflix has no Qwiksters up its sleeve for today’s earnings report. Even after rallying 3% yesterday, the stock heads into the report short on momentum. While up over 60% in the last year and 25% in six months, the stock is down about 8% from its highs in the summer, forming a trend of lower highs. Looking on the bright side, the lack of a meaningful rally leading up to today’s report means that expectations likely aren’t too high.
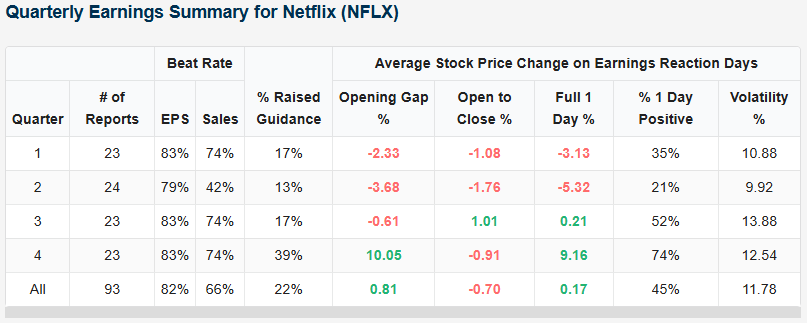
Looking at prior earnings reports from our Earnings Explorer, NFLX also has history slightly on its side. Over the last 23 years, its Q3 report has been the second-best of the four quarters in terms of stock price reaction. As shown in the table below, like Q4, NFLX has exceeded EPS forecasts 83% of the time in Q3 and topped sales forecasts 74% of the time. On its earnings reaction day, the stock averaged a gain of 0.21% with gains 52% of the time. That’s peanuts compared to the average gain of 9.2% following Q4 reports, but it beats the sharp declines that tend to follow Q1 and Q2 reports.
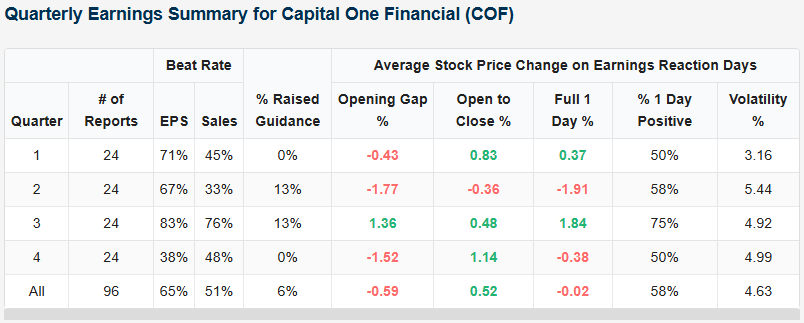
While NFLX will get most of the investor attention after the close today, another stock with a strong track record heading its report today is Capital One Financial (COF). Given its business, it will also give us a good read on the health of the consumer.
As shown in the snapshot below, COF has exceeded EPS and sales forecasts more in Q3 than in any other quarter. As a result, its average earnings reaction day performance has been a gain of 1.84% with positive returns 75% of the time. That’s also better than any other quarter.
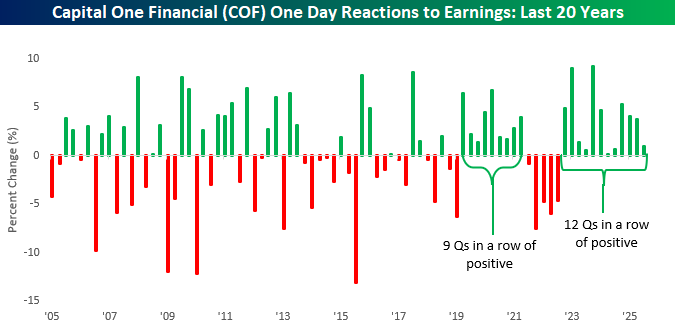
Even more notable for COF is that the company has reacted positively to earnings for an incredible 12 straight quarters! Looking at COF’s one-day reactions to earnings over the last 20 years shows an interesting pattern. Whereas there was no streaky trend in terms of stock price reactions from 2005 through 2019, since then, it has been the opposite. COF has gone nine straight quarters with positive one-day reactions, then five straight quarters with negative reactions, followed by 12 quarters in a row of positive reactions. Talk about streaky!
The Closer – The Long Run, Apple (AAPL) Records, BoC – 10/20/25
Log-in here if you’re a member with access to the Closer.
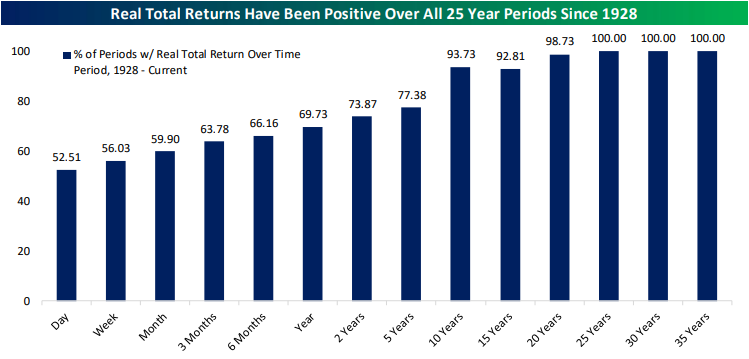
Looking for deeper insight into markets? In tonight’s Closer sent to Bespoke Institutional clients, we kick off with a look at how often real returns are positive over the long run (page 1) in addition to Apple (AAPL) breaking out to a new record (page 2). After that, we dive into the latest earnings reports (page 3) including results from Zion Bancorp (ZION) and Steel Dynamics (STLD). We then finish with a dive into the Q3 release of the Bank of Canada’s business and consumer surveys (page 4).
See today’s full post-market Closer and everything else Bespoke publishes by starting a 14-day trial to Bespoke Institutional today!