Bespoke’s Consumer Pulse Report — June 2022
Bespoke’s Morning Lineup – 6/3/22 – Jobs Day
See what’s driving market performance around the world in today’s Morning Lineup. Bespoke’s Morning Lineup is the best way to start your trading day. Read it now by starting a two-week trial to Bespoke Premium. CLICK HERE to learn more and start your trial.
“Work takes on new meaning when you feel you are pointed in the right direction. Otherwise, it’s just a job, and life is too short for that.” – Tim Cook

Below is a snippet of content from today’s Morning Lineup for Bespoke Premium members. Start a two-week trial to Bespoke Premium now to access the full report.
In the middle of the night, it was looking like it was going to be a positive start to the last trading day of the week, but then news of the Musk ‘super bad’ memo filtered out where the CEO said he wants the company to cut 10% of its workforce citing concerns over the economy. Ever since then futures have been moving steadily lower and are currently indicating a 0.65% decline at the open. Obviously, that could change considerably with the release of the May employment report. Overseas in Europe and Asia, we haven’t seen nearly the degree of negative sentiment in those equity markets as Asia was higher, and Europe is pretty much flat. Treasury yields are little changed across the curve, and crude oil is down modestly.
The May Non-Farm Payrolls report was just released and the headline number was modestly stronger than expected 390K vs 325K. The Unemployment Rate was unchanged at 3.6% versus expectations for a decline to 3.5%. The average workweek was in line with forecasts (34.6) and average hourly earnings rose slightly less than expected (0.3% vs 0.4%).
In today’s Morning Lineup, we discuss Musk’s memo (pg 4), activity in Asian and European markets (pg 4), and selected economic data from Asia and Europe (pg 5).
Don’t call it a comeback, but if (pretty big if at this point following the TSLA news) the S&P 500 can manage to drop less than 0.45% today, it will mark the second straight week of positive returns for that index. The chart below shows the rolling six-month total number of positive weeks for the S&P 500. Just two weeks ago, after a streak of seven weekly declines, the rolling number of positive weeks dropped below ten for the first time since 2011. What’s also notable to highlight is that in early May, the S&P 500 ended a ten-year run where the six-month average never dropped as low as ten, and that was the longest streak without a reading that low in the entire post-WWII period. The prior record was ten years from early 1991 through early 2001.

Start a two-week trial to Bespoke Premium to read today’s full Morning Lineup.
Seasonal Shifts For Jobless Claims
It was a mixed morning for labor market data. What could be a bad omen for tomorrow’s Nonfarm Payrolls number, ADP’s monthly payroll report showed the weakest month of job creation since the start of the pandemic. On the bright side, this week’s initial jobless claims number continued to reverse off of recent highs dropping back down to 200K. While the levels from February through April were even stronger, this week’s reading remains impressive nonetheless with the only comparable levels being during the two years leading up to the pandemic as well as all the way back in the late 1960s.
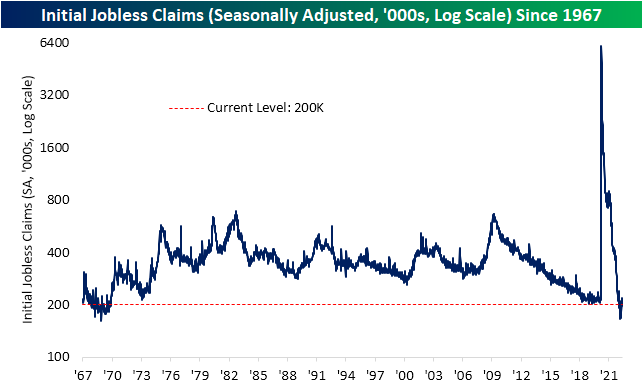
From a seasonal perspective, tailwinds are likely to become headwinds over the next couple of months. As shown in the second chart below, the current week of the year has historically been when unadjusted jobless claims have put in a seasonal low. That is typically followed by several weeks of consistent weekly increases that lead to a short-term peak usually in mid-July. In other words, it should not be surprising to see claims move higher in the weeks ahead, but regardless of any seasonal moves, this week did mark the lowest reading for the comparable week of the year since 1973. That reaffirms the seasonally adjusted reading in that claims are at impressively low levels.

Although initial claims have come off the lows and are likely to keep doing so as seasonal trends shift, continuing claims keep hitting new lows. This week’s reading fell all the way down to 1.309 million from 1.343 million last week. That is now the lowest level since the last week of 1969. Click here to learn more about Bespoke’s premium stock market research service.

Sentiment Swings Back to Optimism
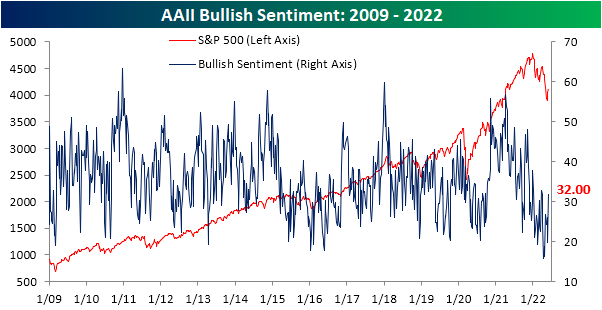
Sentiment has taken a big swing higher across surveys this week as the S&P 500 has experienced some upside mean reversion. The weekly AAII sentiment survey has seen bullish sentiment rebound from a sub-20% reading all the way back up to 32%. Relative to the historical average of 37.84%, that reading continues to show a depressed level of optimism for individual investors, but it is the strongest reading since the week of March 24th. As for the 12.2 percentage point jump in bullish sentiment week over week, it was the largest one week gain since the week of October 14th of last year when it rose 12.4 percentage points.
As bullish sentiment surged, there was a massive 16.4 percentage point drop in bearish sentiment. That was the largest one week decline in the reading on pessimism since July 15, 2010 when it fell 19.27 percentage points. Now at 37.1%, bearish sentiment is at the lowest level since the end of March.
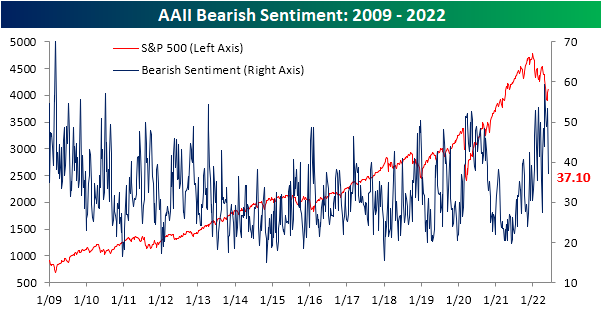
Such a large decline in bearish sentiment in only one week has pretty much been unheard of in the post Financial Crisis years. Again, July 2010 was the last time bears fell by at least 15 percentage points and before that there are only about two dozen other occurrences without another instance in the previous three months. While it was a big decline, bearish sentiment remains fairly elevated at 37.1%, but that is inline with most other occurrences since the mid 2000s whereas bearish sentiment was generally lower from the occurrences before 2005.
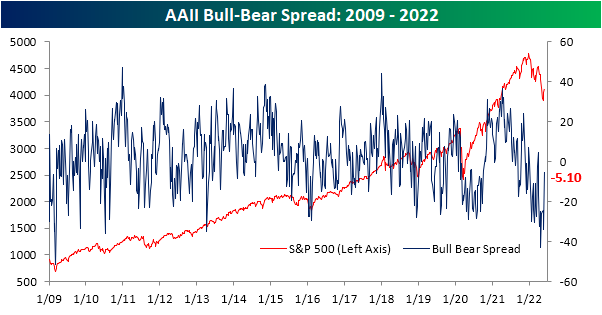
As for how the S&P 500 has tended to do following these massive bearish sentiment shifts, the S&P 500 has generally tended to move higher with outperformance versus the norm on a median basis one week and one month out. Although again performance is consistently positive, the size of gains have tended to be below or more inline with the norm three, six, and twelve months out from these occurrences.

After the large moves in bulls and bears this week, sentiment continues to favor pessimism but to a much smaller degree than recent weeks as the bull bear spread narrowed to -5.1 points. Click here to learn more about Bespoke’s premium stock market research service.
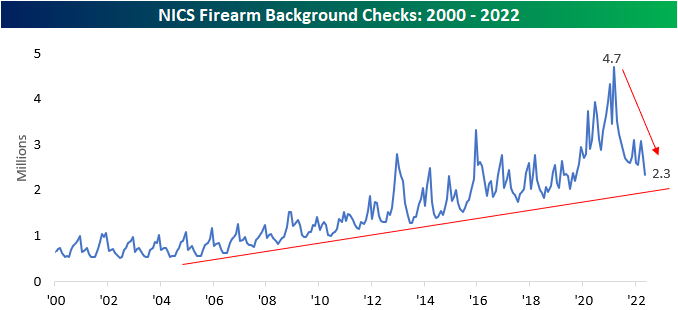
Gun Background Checks Fall
Although not a widely accepted indicator, we like to look at the number of NICS firearm background checks as a barometer for fear and geopolitical volatility for the United States. In uncertain times (like the beginning of government-imposed COVID lockdowns), background checks tend to spike. Inversely, when times are good, background checks tend to decline. An additional causal factor of background check spikes is the outlook on gun policy. When the public feels as if gun policies are going to become stricter, Americans tend to rush to purchase firearms, which is evidenced by the record y/y increase after President Obama was reelected. Recently, several mass shootings have brought gun control regulations back into the news cycle, so one would expect to see background checks tick higher. Granted, much of this rhetoric really picked up towards the end of the month, so any effects will likely be seen in June (or later) numbers. Nonetheless, background checks declined for the second consecutive month after briefly spiking earlier this year. In May, checks declined by 27.4% y/y to just 2.3 million.

On a YTD basis, background checks have fallen by 30.7%, the largest first five-month decline since at least 2000.

Although the decline is certainly significant, monthly background checks are still comfortably above their longer-term trend line. To summarize, although checks are down significantly y/y, the long-term uptrend that was in place prior to the COVID surge is still largely intact.
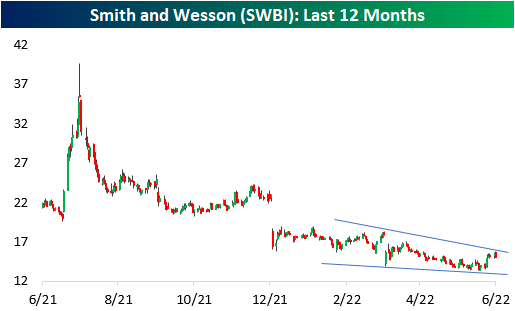
Although we like to think that the market is forward-looking, the price action of gun manufacturer Sturm Ruger (RGR) tends to be highly correlated with the number of background checks over the prior twelve months. Since the start of 2000, RGR’s end-of-month close and the trailing twelve-month background check figure has held a correlation coefficient of 0.90, a near-perfect positive relationship. Therefore, a reversal in the downside momentum of background checks as Americans step up purchases in advance of perceived or actual new regulations in gun ownership would leave room for upside in RGR.

Looking at the last twelve-month price charts of two firearm manufacturers, a relatively similar pattern emerges. RGR and Smith and Wesson (SWBI) are both in sustained downtrends. However, both have seen consolidation as of late, and SWBI is even testing its trendline. The decline has been warranted due to the significant decrease in background checks (and in turn firearm purchases), but a reversal higher in checks would likely provide a tailwind for both companies. Click here to become a Bespoke premium member today!

Bespoke’s Morning Lineup – 6/2/22 – Rebound?
See what’s driving market performance around the world in today’s Morning Lineup. Bespoke’s Morning Lineup is the best way to start your trading day. Read it now by starting a two-week trial to Bespoke Premium. CLICK HERE to learn more and start your trial.
“We should take comfort that while we may have more still to endure, better days will return.” – Queen Elizabeth II
Below is a snippet of content from today’s Morning Lineup for Bespoke Premium members. Start a two-week trial to Bespoke Premium now to access the full report.
The quote above from Queen Elizabeth was from a speech in the early days of COVID, and with life getting back to ‘normal’ in most western economies, she was definitely right. The Queen’s comments from two years ago can also be attributable to the current market environment. 2022 hasn’t been enjoyable, and it’s more likely than not that investors will still have further volatility and losses to endure, but better days will come, even if – like COVID – those better days take longer than expected to return.
It’s been a busy morning of economic data today with ADP Employment missing expectations and showing the smallest level of job growth since April 2020. Unit Labor Costs were also revised more than a full percentage point higher, while the revision of Non-Farm Productivity showed a slightly less negative number. Jobless Claims were also just released, and on both an initial and continuing basis, the reported readings were lower than expected.
Heading into this morning’s data, futures were already higher, but they’ve given up some of those gains as interest rates ticked higher following the releases.
In today’s Morning Lineup, we discuss recent trends in the oil market (pg 4), activity in Asian and European markets (pg 4), and selected economic data from Asia and Europe, and the US (pg 5).
When it comes to semiconductors, we typically focus on the group’s relative strength versus the S&P 500 as a leading indicator for the broader market. This morning, however, we wanted to highlight the actual price chart of the Philadelphia Semiconductor Index (SOX). The group has been a steady outperformer in recent weeks, and unlike the major averages which are nowhere near their 50-day moving averages (DMA), the SOX has actually traded above that level in each of the last three trading days. The only problem is that it also closed below that level all three times. In market downtrends, declining moving averages often act as resistance, so the failed rallies of the last three days leave the bulls somewhat discouraged.

We were curious to see how common it is for the SOX to repeatedly run into resistance at its 50-DMA, so the chart below shows streaks where the index traded above its 50-DMA intraday but finished the day below that level. The current streak of three trading days is the longest streak since August 2018, and to find a longer streak you have to go all the way back to August 2007. While the current period has often been compared to the early 2000s, bulls can take some solace in the fact that there was never a similar streak in the years from 2000 through 2003.

Start a two-week trial to Bespoke Premium to read today’s full Morning Lineup.
Beach, Pool, Boat, and Grill Season
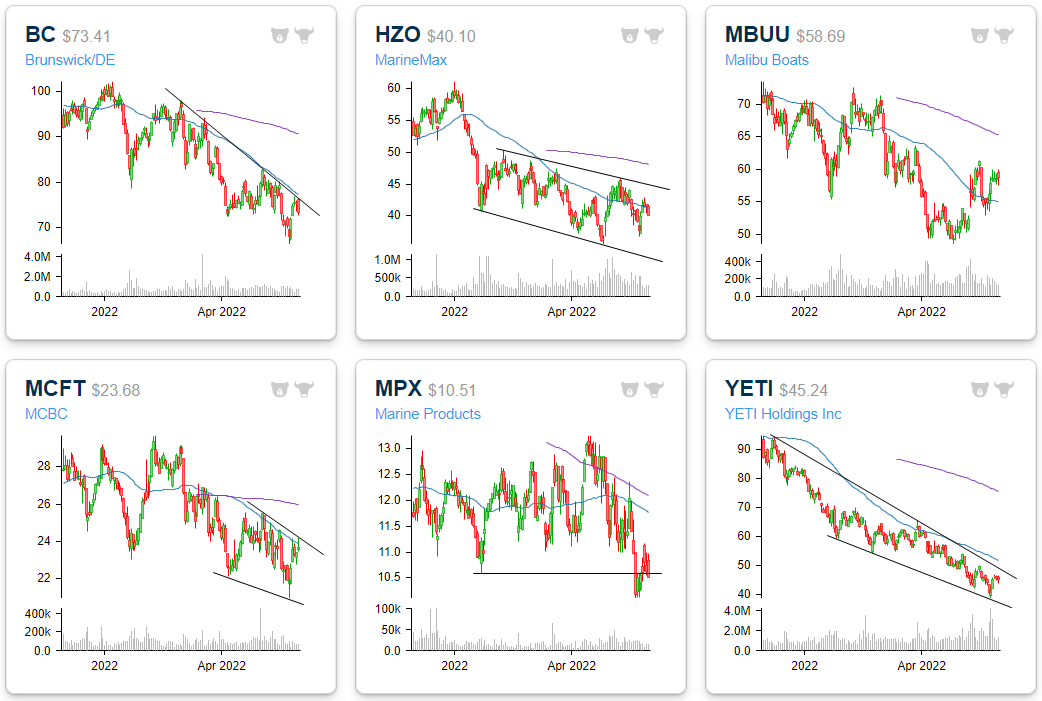
With summer underway, we figured that it was an appropriate time to take a look at some of the stocks associated with beach & pool season. As shown below, Google searches for “beach”, “pool”, “boat” and “grill” are all actually elevated relative to historical levels during the week of May 31st, with each hitting a five year high. We’re actually seeing consumers searching for these popular summer activities at record rates, and they usually don’t peak until right around July 4th. This suggests “hot” activity as we roll into the summer months when consumers get outdoors. From an economic standpoint, it’s good to see searches at these levels especially with gas prices continuing to surge.

Although searches and interest in these activities are hitting a multi-year high, the prices of stocks with exposure to these industries have gone in the other direction. Starting with beaches and boats, six stocks with direct exposure include Brunswick (BC), Yeti (YETI), MarineMax (HZO), MasterCraft Boats (MCFT), Malibu Boats (MBUU), and Marine Products (MPX). On average, these stocks are down 24.9% year to date (median: -21.6%) and trade 1.2 times last twelve-month sales (median: 1.0). Although these stocks trade just 10.2 times LTM earnings per share (median: 8.5), they saw EPS rise by an average of 15.5% y/y in the most recent quarter (median: 13.4%). In the latest quarter, sales also improved by an average of 17.3% (median: 18.5%). Despite the relatively strong fundamental trends, investors appear to be looking forward anticipating weaker levels of growth once the pent up demand wanes.
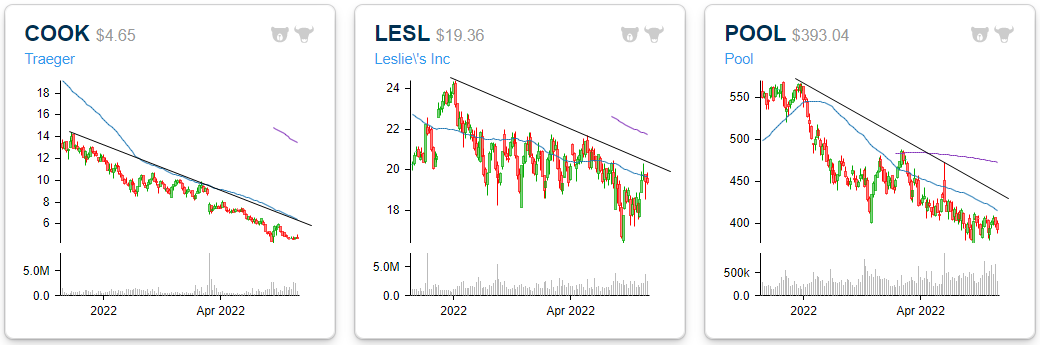
Within the pool and grill space, we were able to identify four near-pure plays: Pool Corp (POOL), Leslie’s (LESL), Traeger (COOK), and Weber (WEBR) which is not shown. On average, these stocks are down 37.8% (median: 36.0%) year to date compared to the S&P 500’s decline of just over 14%. These companies saw sales grow by 15.6% y/y on average (median: 18.5%) in the most recent quarter. The average price to sales multiple for this group is 1.6 (median: 1.6). Granted, the weak YTD performance can be largely attributed to WEBR and COOK, as the market has punished recent IPOs. Nonetheless, the underperformance is still notable given the assumed hike in demand.
Over the last twelve months, beach, pool, boat, and grill stocks (on an equal-weighted basis) have underperformed the S&P 500. This underperformance has been consistent. Granted, not all of the names on the list are pure plays, but all of the stocks have exposure to the space in one way or another. As you attend outdoor events at the bool, beach, or on the water in the coming weeks, keep these stocks in mind! Click here to become a Bespoke premium member today!

Energy Surge Relative to Industrials
Each day in our Sector Snapshot, we provide an update on each sector’s weighting within the S&P 500. Given the astounding rally in Energy stocks, the sector has gone from a record low weighting of only 1.9% in November 2020 up to a high of 4.9% last week. That is back to levels seen in the summer of 2019, and it’s also a level consistent with what we saw in the late 1990s through the first few years of the 2000s. Of course, the larger a sector’s weighting, the more impact its moves have on the broader S&P 500.
Meanwhile, another traditionally cyclical group, the Industrials, has seen its weighting steadily decline. At only 7.76%, the current reading is only about 0.3 percentage points above the pandemic low in weight which also marked a record low going back to at least 1990. Historically, Industrials have had less dramatic fluctuations in weight than Energy, but it has seen a consistent grind lower over the decades, reflecting the broader shift in the US economy from predominately goods to service-based.

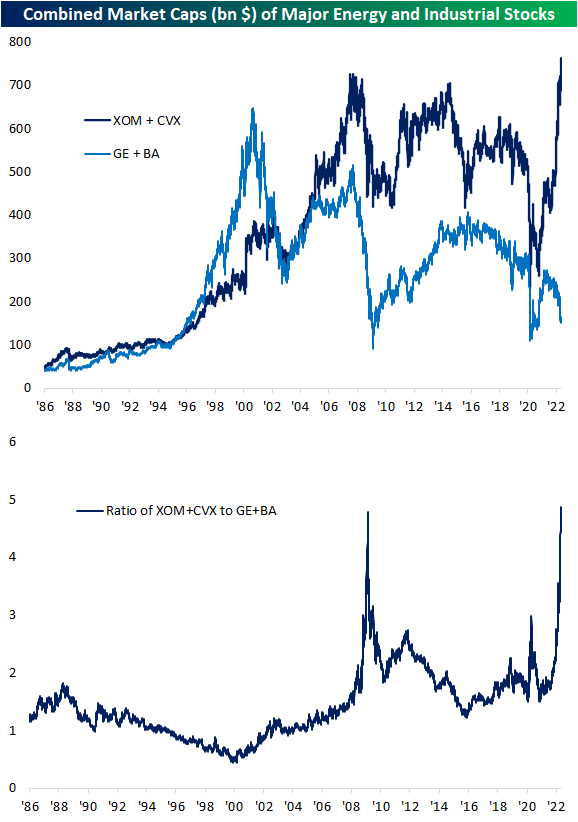
In an earlier post, we noted how two of the biggest stocks in the Energy sector by market cap, Exxon Mobil (XOM) and Chevron (CVX), have seen explosive and unprecedentedly large moves higher over the past couple of years. This is the first time these stocks have seen their market caps rise in any sort of a significant manner since the mid-2000s. As shown below, the two now account for nearly three-quarters of a trillion dollars in market cap, surpassing the previous peak in late 2007. That accounts for roughly 44% of the total size of the S&P 500 Energy sector as well.
Below we compare the combined market caps of XOM and CVX to what have historically been two of the most prominent stocks in the Industrials sector: Boeing (BA) and General Electric (GE). Right around 2000, these two stocks had a combined market cap of ~$650 billion. Over the two decades since then, these two stocks have fallen from grace with their current market caps now totaling just $163.9 billion! Relative to the market cap gains of Exxon Mobil and Chevron, the recent move has been nothing short of exponential as shown in the second chart below. The only comparable period was in 2009 when both groups fell, but the Industrial names were hit much harder.
As we discussed in regards to Tech stocks now versus the Dot Com Peak in March of 2000 in last week’s Bespoke Report (pages 20 & 21), the big declines in the size of GE and BA as XOM and CVX rocket higher are yet more examples of the ebb and flow of market leadership. Click here to learn more about Bespoke’s premium stock market research service.
Bespoke Market Calendar — June 2022
Please click the image below to view our June 2022 market calendar. This calendar includes the S&P 500’s average percentage change and average intraday chart pattern for each trading day during the upcoming month. It also includes market holidays and options expiration dates plus the dates of key economic indicator releases. Click here to view Bespoke’s premium membership options.

Q1 Earnings Season Conference Call Recaps
Bespoke’s Conference Call Recaps provide helpful summaries of corporate conference calls throughout earnings season. We go through the conference calls of some of the most important companies in the market and summarize key topics covered by management. These recaps include information regarding each company’s financial results, growth by segment, as well as some aspects of the business that management expects to impact future results. We also identify trends emerging for the broader economy in these recaps.
Bespoke’s Conference Call Recaps are available at the Bespoke Institutional level only. You can sign up for Bespoke Institutional now and receive a 14-day trial to read our newest Conference Call recaps. To sign up, choose either the monthly or annual checkout link below:
Bespoke Institutional – Monthly Payment Plan
Bespoke Institutional – Annual Payment Plan
Below is a list of the Conference Call Recaps published during the Q1 2022 and Q4 2021 earnings reporting period.
Q1 2022 Recaps:
Salesforce — Q1 2023

NVIDIA — Q1 2023

Best Buy — Q1 2023

Zoom — Q1 2023

Deere — Q2 2022

Palo Alto Networks — Q3 2022

Target — Q1 2022

Q1 Previously Published Recaps
Home Depot Q1 Conference Call — 5/17/22
Walmart Q1 Conference Call — 5/17/22
Disney Q2 Conference Call — 5/11/22
Roblox Q1 Conference Call — 5/11/22
Simon Property Q1 Conference Call — 5/9/22
Tyson Foods Q2 Conference Call — 5/9/22
Block Q1 Conference Call — 5/5/22
Albemarle Q1 Conference Call — 5/5/22
Cheniere Energy Q1 Conference Call — 5/4/22
Uber Q1 Conference Call — 5/4/22
Starbucks Q1 Conference Call — 5/3/22
Advanced Micro Devices Q1 Conference Call — 5/3/22
Hilton Hotels Q1 Conference Call — 5/3/22
Amazon Q1 Conference Call — 4/28/22
Apple Q2 Conference Call — 4/28/22
United Rentals Q1 Conference Call — 4/28/22
McDonald’s Q1 Conference Call — 4/28/22
Meta Platforms Q1 Conference Call — 4/27/22
Automatic Data Processing Q3 Conference Call — 4/27/22
Chipotle Q1 Conference Call — 4/26/22
Microsoft Q3 Conference Call — 4/26/22
Alphabet Q1 Conference Call — 4/26/22
United Parcel Service Q1 Conference Call — 4/26/22
Whirlpool Q1 Conference Call — 4/25/22
Coca-Cola Q1 Conference Call — 4/25/22
American Express Q1 Conference Call — 04/22/22
Snap Q1 Conference Call — 04/21/22
Pool Corp Q1 Conference Call — 04/21/22
Alcoa Q1 Conference Call — 04/20/22
Tesla Q1 Conference Call — 04/20/22
IBM Q1 Conference Call — 04/19/22
Johnson & Johnson Q1 Conference Call — 04/19/22
JB Hunt Conference Call — 04/18/22
Citigroup Q1 Conference Call — 04/14/22
UnitedHealth Group Q1 Conference Call — 04/14/22
Taiwan Semiconductor Q1 Conference Call — 04/14/22
BlackRock Q1 Conference Call — 04/13/22
Delta Q1 Conference Call — 04/13/22
JP Morgan Q1 Conference Call — 04/13/22
CarMax Q4 Conference Call — 04/12/22
Constellation Brands Q4 Conference Call — 4/7/22
Walgreens Q2 Conference Call — 3/31/22
Micron Q2 Conference Call — 3/29/22
Lululemon Q4 Conference Call — 3/29/22
KB Home Q1 Conference Call — 3/23/22
Adobe Q1 Conference Call — 3/22/22
Nike Q3 Conference Call — 3/21/22
Recaps published during Q4 2021 are available with a Bespoke Institutional subscription:
Salesforce Q4 Conference Call — 3/1/22
Target Q4 Conference Call — 3/1/22
Zoom Q4 Conference Call — 2/28/22
Moderna Q4 Conference Call — 2/24/22
Home Depot Q4 Conference Call — 2/22/22
Deere Q1 Conference Call — 2/18/22
Walmart Q4 Conference Call — 2/17/22
NVIDIA Q4 Conference Call — 2/16/22
Airbnb Q4 Conference Call — 2/15/22
Marriott Q4 Conference Call — 2/15/22
Advance Auto Parts Q4 Conference Call — 2/14/22
Uber Q4 Conference Call — 2/9/22
Disney Q1 Conference Call — 2/9/22
Chipotle Q4 Conference Call — 2/8/22
Simon Property Q1 Conference Call — 2/7/22
Tyson Foods Q1 Conference Call — 2/7/22
Snap Q4 Conference Call — 2/3/22
Amazon Q4 Conference Call — 2/3/22
Estée Lauder Q2 Conference Call — 2/3/22
Meta Q4 Conference Call — 2/2/22
Ferrari Q4 Conference Call — 2/2/22
Match Group Q4 Conference Call — 2/2/22
Advanced Micro Devices Q4 Conference Call — 2/1/22
PayPal Q4 Conference Call — 2/1/22
Starbucks Q1 Conference Call — 2/1/22
Alphabet Q4 Conference Call — 2/1/22
United Parcel Service Q4 Conference Call — 2/1/22
Visa Q1 Conference Call — 1/27/22
Apple Q1 Conference Call — 1/27/22
McDonald’s Q4 Conference Call — 1/27/22
Intel Q4 Conference Call — 1/26/22
Tesla Q4 Conference Call — 1/26/22
Boeing Q4 Conference Call — 1/26/22
Automatic Data Process Q4 Conference Call — 1/26/22
Microsoft Q2 Conference Call — 1/26/22
Johnson & Johnson Q4 Conference Call — 1/25/22
3M Q4 Conference Call — 1/25/22
Lockheed Martin Q4 Conference Call — 1/25/22
American Express Q4 Conference Call — 1/25/22
Netflix Q4 Conference Call — 1/20/22
Intuitive Surgical Q4 Conference Call — 1/20/22
Union Pacific Q4 Conference Call — 1/20/22
Baker Hughes Q4 Conference Call — 1/20/22
UnitedHealth Q4 Conference Call — 1/19/21
Fastenal Q4 Conference Call — 1/19/22
Procter & Gamble Q2 Conference Call — 1/19/22
Silvergate Capital Q4 Conference Call — 1/18/22
Charles Schwab Q4 Conference Call — 1/18/22
BlackRock Q4 Conference Call — 1/14/22
JP Morgan Q4 Conference Call — 1/14/22
KB Home Q4 Conference Call — 1/12/22
Delta Airlines Q4 Conference Call — 1/13/22
Constellation Brands Q3 Conference Call — 1/6/22
Nike Q2 Conference Call — 12/20/21