The Closer – Meaningless Minutes, Openings, Housing, Ag – 7/6/22
Log-in here if you’re a member with access to the Closer.
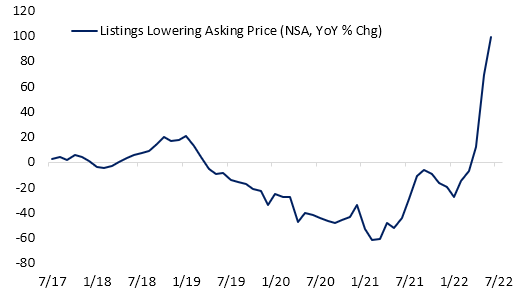
Looking for deeper insight into markets? In tonight’s Closer sent to Bespoke Institutional clients, we begin with a rundown of the minutes from the June FOMC meeting (page 1) followed by a look at job openings through today’s JOLTS report (page 2) and Indeed data (pages 3 and 4). We then pivot to housing data with the latest delinquency readings out of the Mortgage Monitor report from Black Knight (page 5) and realtor.com data covering inventories and prices (page 6). We then shift into the latest PMIs (page 7) before closing with a look into the declines in agriculture commodities (page 8).
See today’s full post-market Closer and everything else Bespoke publishes by starting a 14-day trial to Bespoke Institutional today!
Gold Weakness
Investors often turn to Gold as a safe asset in tumultuous times, as the asset tends to hold its value during market downturns. For example, when the S&P 500 sold off by 34.1% during the COVID Crash, the SPDR Gold Trust (GLD) declined just 3.6%. In 2022, GLD initially acted as a strong hedge to the equity market, gaining 1.0% on a YTD basis on June 16th as SPY entered bear market territory. However, GLD topped out in early March and is now trading 14.0% off of its closing 2022 high. GLD has even underperformed SPY since March 8th, declining 14.0% versus SPY’s drop of 8.2%. Click here to learn more about Bespoke’s premium stock market research service.
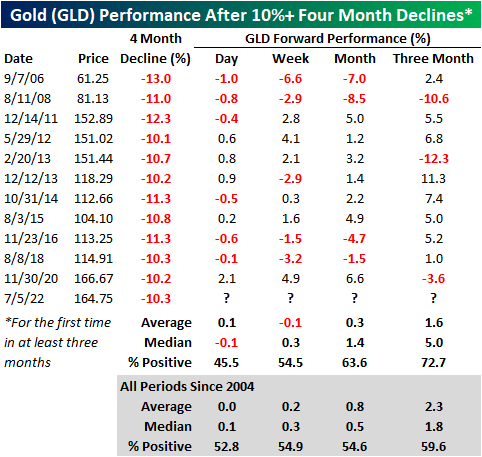
Over the last four months, GLD has declined by 10.3%, which is elevated for a relatively stable asset during a bear market. Since its inception in 2004, GLD has declined 10% or more over a four-month period (with no occurrences in the prior three months) twelve times with each occurrence shown in the chart below.

The forward performance following four-month declines of 10%+ has been mixed depending on the time frame. The next day (which would be today), GLD has booked a median loss of 10 basis points, gaining just 45.5% of the time. However, the median return and positivity rate in the next week is inline with historical averages. Over the one and three months, performance tends to pick back up, registering gains 63.6% and 72.7% of the time, respectively. Over the next three months, GLD has had a median gain of 5.0%, which is more than two and a half times the median of all periods. Click here to learn more about Bespoke’s premium stock market research service.
What Happened to Energy?
Up until June 8th, the Energy sector was the only thing working in the market. However, the sector has reversed dramatically, falling close to 25% since. This comes as the price of oil pulls back and the White House targets the entire vertical with accusations of profiteering. As any investor knows, the price of oil is not set by individual energy companies, but rather by the forces of the market. Interestingly, the same administration that is pressuring oil companies to increase supply campaigned on the fact that they would not allow for drilling permits to be renewed on federal land, so the current rhetoric is… interesting to say the least. To quote Biden himself: “Number one, no more subsidies for the fossil fuel industry. No more drilling on federal lands. No more drilling, including offshore. No ability for the oil industry to continue to drill, period.” Rhetoric like this can logically cause a reduction in domestic energy investments, as CFO’s adjust capital expenditures based on added legislative risk.
Nonetheless, the price of oil has pulled back significantly, which causes a compression in gross margins for suppliers. Oil is currently trading at about $100 per barrel. Although oil is still up over 33% YoY, it has pulled back by 23.3% relative to highs. Most industries will breath a sigh of relief, but energy companies will be in the other camp. Notably, crude recently broke its uptrend, and seven of the last 15 trading days have seen declines of 3% or more.

Below is a chart showing the rolling % of 3%+ daily declines over all 15-day periods. As you can see, this is an extremely elevated reading, surpassed by just The Great Recession and the COVID Crash. Following the high reading in 2008, XLE rebounded 8.9% in the next week and 7.8% over the next month. In March of 2020, XLE fell by an additional 13.1% over the next week, but rebounded 14.7% over the following month after the peak reading.

Below are snapshots of S&P 500 Energy stocks as they currently stand versus where they stood on June 8th when XLE peaked. All but one of the stocks have entered an oversold range after every single one was overbought as of 6/8. What a difference a month can make! On average, these stocks were up 66% YTD (median: 64.8%) on June 8th, but are now up an average of just 22.3% on a YTD basis (median: 18.0%). Between the close on 6/8 and 7/5, the average stock on this list fell by 26.1% (median: -26.7%), delivering pain to investors who bought the rip. Click here to learn more about Bespoke’s premium stock market research service.


Tough Day For Commodities
So far in 2022, sky-high commodity prices have plagued equity markets. As input prices have surged for corporations, consumers have faced record-high gas prices, and families are forced to spend A LOT more on food. This has led to a compression in discretionary budgets among consumers, record-low consumer confidence readings, and multi-decade lows in investor sentiment. Yesterday, commodity prices fell sharply as speculators feared demand destruction due to rising recessionary risks. Although the reasoning for the selloff is certainly not positive for the broader economy, investors breathed a sigh of relief as one of the major economic/market headwinds eased. Click here to learn more about Bespoke’s premium stock market research service.
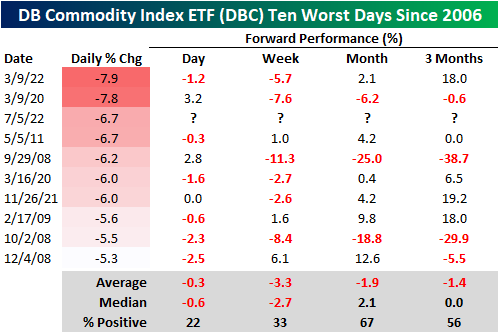
Yesterday’s move was the third-largest downside move in the Invesco DB Commodity Index ETF (DBC) since its inception in 2006, falling short of just two occurrences in March 2020 and March 2022. Following yesterday’s decline, DBC is now down over 18% from its June 9th high and up ‘just’ 20.2% YTD. Over the last 12 months, though, DBC is still up 73.6%.


Following the other nine worst days in DBC’s history, the median forward performance has been relatively weak, which by itself, is a positive for corporations and all other commodity consumers. In the next week, DBC has only performed positively one-third of the time, booking a median loss of 2.7 percentage points. Over the following three months, DBC has appreciated 56% of the time and has tended to remain flat on a median basis. In three of the nine prior occurrences, DBC rallied 18% or more over the next three months, while it declined 29% or more twice. Click here to learn more about Bespoke’s premium stock market research service.
International Check-Up
The S&P 500 is down 20.8% on a YTD basis, which is worse than all of the international indices we looked at apart from the DAX (German stock market index) and ITLMS (Italy stock market index). Although the YTD performance is weak relative to other countries, performance relative to pre-COVID levels is still elevated, so long-term investors have been rewarded by investing in the US. Relative to mid February of 2020 just before COVID hit the West, the S&P 500 ranks third out of the 12 indices we looked at, falling short of just Argentina (Merval) and Chile (IGPA). Click here to learn more about Bespoke’s premium stock market research service.
Of the 12 international indices, eight are down relative to pre-COVID levels. The biggest decliners have been Hong Kong (Hang Seng), Spain (IBEX 35) and Italy (ITLMS). The charts below show the five year performance of each international index that we looked at (and the S&P 500). As you can see, five year returns are now negative for the DAX, the Hang Seng, the FTSE Italia, the IBEX 35 and the FTSE 100. So much for the benefits of international diversification!


The table below summarizes each index’s performance over the last five years, relative to pre-COVID levels, and on a YTD basis. Much of the differentiation in performance can be attributed to the means of each respective economy. For example, Argentina and Chile largely export materials, making the economies highly correlated to price moves in commodities. On the other hand, Western nations tend to have a healthy mix of industrial products, commodities and services. Click here to learn more about Bespoke’s premium stock market research service.

Firearm Background Checks
We track the number of NICS firearm background checks on a regular basis as it often provides interesting insights on the mood of Americans or the direction of political winds regarding gun control legislation. In times of higher volatility, uncertainty, or concerns that lawmakers in Washington will enact stricter legislation for firearms, purchases tend to rise. On the other hand, in periods of stability, background checks tend to fall. Ever since June of last year, background checks have been declining on a y/y basis, but the y/y decline moderated in June. Although still down 15.8% compared to last year, purchases moved higher sequentially for the first time in three months. Click here to learn more about Bespoke’s premium stock market research service.
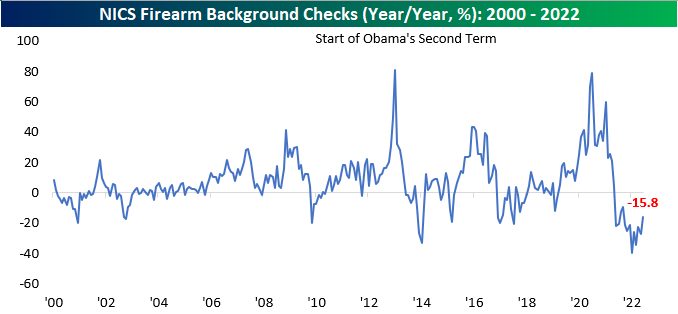
Although checks moved higher month over month, they are likely to rise even further in July due to the Supreme Court’s recent ruling against the state of New York. This case expands the right to carry, and will likely increase firearm purchases in some of the most restrictive cities, such as New York and Los Angeles. In June, background checks rose by over 230K to reach 2.6 million. Although checks are in a near-term down-trend following the COVID spike, the longer-term uptrend is still very much intact.

On a YTD basis, background checks have declined at the fastest rate on record. This is largely due to elevated comps, as 2021 saw background checks near record levels due to a growing political divide, COVID lockdowns, and fears over legislation with Democrats in full control of Washington D.C.

Although background checks moved higher month over month, Sturm Ruger (RGR) and Smith and Wesson (SWBI) hit 52-week lows in June. All-in-all, RGR traded 6.3% lower in June, and SWBI declined 15.2%. The stocks have been weighed down by slowing sales over the last couple of quarters, increased legal risk associated with firearm manufacturer liability, and the pull of the overall market tide. Both these stocks are still in sustained downtrends, and even after initially moving higher following the Supreme Court decision, both stocks have essentially come full circle. Click here to learn more about Bespoke’s premium stock market research service.


Was It the Stock Price?
We’ve all seen the impact that falling stock prices have had on investor sentiment in the last few months. The weekly poll that the American Association of Individual Investors (AAII) takes of its members recently showed the lowest level of bullish sentiment since 1992. You read that right. Even during the depths of the Dot Com crash, the Financial Crisis, or the COVID crash, bullish sentiment bottomed out at higher levels than it has in the COVID unwind.
General consumer surveys have also cratered. Despite what we’re told is a strong labor market (for now) and the world moving on from COVID (even if parts of the world and some groups would prefer that people remain in lockdown indefinitely), we have raging inflation, rising crime, geopolitical uncertainty, gas prices at record highs, and a more politically divided populace than we’ve seen in decades. Consumers are among the most downbeat they’ve ever been. The monthly poll from the University of Michigan has even dropped to levels not seen in the entire 40+ year history of the survey.
The shift in sentiment extends beyond the sphere of investors and consumers and into the C-suite as well, most notably in the former high-flying tech/growth sector. Traditionally, these companies have looked like a utopian oasis with amenities, perks, and employee accommodations that the average American could only dream of. Just google the term “google headquarters inside” and you’ll see what we mean. From an outsider’s perspective, it seems like an employee can take a day off (or days off) simply for reasons like they aren’t feeling it or if their favorite team lost a game the night before.
It’s probably not that extreme. There’s a reason these companies became among the most valuable in the world, and it wasn’t because everybody just has fun and does nothing. But in terms of their ‘images’, they made it seem like working at their companies was like going to summer camp. When a company’s stock price shoots higher, showering perks on its employees and advertising them for the press to see is just a way of showing how much better the company is than all the ‘old’ economy stocks.
This year, we’ve started to see a shift in the attitude of companies towards their employees, and the two most notable were recent comments from Netflix’s Reed Hastings and Meta’s Mark Zuckerberg. Over the last year, there has been well-covered discontent among Netflix employees regarding some of the streamer’s programming and it not fitting in with their personal views. In early May, Hastings responded to these concerns with a long memo that included the suggestion “If you’d find it hard to support our content breadth, Netflix may not be the best place for you.”
Up north in Palo Alto, a similar shift has played out at Meta Platforms (META), formerly known as Facebook. In a Q&A session last week, Zuckerberg warned employees that the company was facing one of the steepest downturns in its history, and just after rebranding employees of the firm as his ‘metamates,’ he continued by saying “there are probably a bunch of people at the company who shouldn’t be here.” Ouch, mate!
So what explains the shift in tone among these CEOs from ‘kumbaya’ to ‘don’t let the door hit you on the way out’? Could it be the stock prices? As shown in the charts below, in the cases of both Netflix and Meta Platforms, the shift in tone has come after major declines in each company’s stock where prices have been more than cut in half. Just like many of us common folk, it looks as though stock prices can also have a big impact on the mood of CEOs. Click here to learn more about Bespoke’s premium stock market research service.

Bespoke Brunch Reads: 7/3/22
Welcome to Bespoke Brunch Reads — a linkfest of the favorite things we read over the past week. The links are mostly market related, but there are some other interesting subjects covered as well. We hope you enjoy the food for thought as a supplement to the research we provide you during the week.
While you’re here, join Bespoke Premium with a 30-day free trial!
Institutional Investors
Hedge funds braced for further stock market turmoil by Laurence Fletcher (FT)
Amidst high volatility and falling prices, fast leveraged money is slashing its exposure to the equity market, with the lowest net exposure since at least 2010 amidst reduced bets on higher stock prices. [Link; soft paywall]
Pension Funds Plunge Into Riskier Bets—Just as Markets Are Struggling by Dion Rabouin and Heather Gillers (WSJ)
Pension funds are starting to lever their portfolios in order to hit return targets that may prove unrealistic, just in time for a historic collapse in asset prices to hit in 2022. [Link; paywall]
Space
Inside SpinLaunch, the Space Industry’s Best Kept Secret by Daniel Oberhaus (Wired)
A new company is testing a frankly wild launch system: spinning a small payload on a centrifuge in a vacuum before releasing it in a massive parabolic arc that lofts the craft near to orbit. [Link; soft paywall]
‘No Aliens, No Spaceships, No Invasion of Earth’: An oral history of Contact, the sci-fi movie that defied Hollywood norms and made it big anyway. by Rachel Handler (NYMag)
A recollection of the unique vision that one of the largest-scale sci-fi movies ever attempted brought to Hollywood, and why it remains a breath of creative fresh air. [Link]
Sports
Thwack. Pop. Whack. Pickleball Noises Turn Neighbors Into Activists. by James Fanelli (WSJ)
Low-impact paddle ball sport pickleball may be easy on the knees and frankly quite a bit of fun, but it’s creating a major conflict for residents near courts: the perforated balls and wooden paddles make for low-speed volleys but make a huge and very annoying amount of noise. [Link]
Manny, Pedro and Papi’s kids are on the same team?! Meet ‘The Sons’ of the Brockton Rox by Joon Lee (ESPN)
The sons of some of Major League Baseball’s best players are sharing uniforms in a murderer’s row of genetic diamond talent about an hour from Fenway Park. [Link]
Energy
For the First Time, US Is Sending More Gas to Europe Than Russia by Anna Shiryaevskaya (Bloomberg)
Huge flows of liquid natural gas from the US to Europe amidst the fall-out of Russia’s invasion of Ukraine have led the United States to supplant Russia as the biggest source of natural gas for the continent. [Link; soft paywall]
The Supreme Court’s EPA Ruling Is Going to Be Very, Very Expensive by Robinson Meyer (The Atlantic)
Analysis of the SCOTUS ruling, which taken at face value means that preserved EPA authority to regulate greenhouse gas emissions could be much more expensive for industry than what the agency had sought to do. [Link; soft paywall]
Driving
Apple eyes fuel purchases from dashboard as it revs up car software by Stephen Nellis (Reuters)
Updates to Apple’s CarPlay software suite could mean consumers buy their gas through an app before they ever reach a gas station rather than paying at the pump. [Link; auto-playing video]
Uber, Lyft Drivers Switch to Teslas as High Gas Prices Squeeze Profit by Jackie Davalos (Bloomberg)
With fuel prices still near record levels, operating costs of relatively up-scale electric vehicles are so much lower than traditional ICE cars that they more than justify the upfront cost almost immediately. [Link; soft paywall]
Whoops
Japanese Man Lost a USB Drive With Entire City’s Personal Data After a Night Out by Hanako Montgomery (Vice)
The personal data of 465,177 residents of Amagasaki, Japan has been stolen after a contractor put the data on the flash drive then got so drunk he fell asleep on the street. [Link]
Social Media
TikTok Turns On the Money Machine by Zheping Huang (Yahoo!/Bloomberg)
Revenues at algorithmic video short network TikTok are exploding with top line likely to exceed Twitter (TWTR) and Snap (SNAP) combined by the end of the year. [Link]
Education
The Impact of School Facility Investments on Students and Homeowners: Evidence from Los Angeles by Julien Lafortune and David Schönholzer (American Economic Journal: Applied Economics)
Construction of school facilities in Los Angeles over the last few decades generated $1.62 for every $1 spent, with about a quarter of the benefit coming from higher test scores and the rest from other amenities. [Link]
Read Bespoke’s most actionable market research by joining Bespoke Premium today! Get started here.
Have a great weekend!
The Bespoke Report – 7/1/22 – Dazed and Confused
This week’s Bespoke Report newsletter is now available for members.
“Been dazed and confused for so long, it’s not true…Lotsa people talkin’, few of them know…Don’t know where you’re going, only know just where you’ve been…” – Dazed and Confused, Led Zeppelin
We can’t think of many songs that better encapsulate 2022, but if you can, let us know. Confusing has been an understatement as investors are faced with a barrage of back-and-forth moves and policy decisions that would make most fair-minded people scratch their heads. Despite the cross-currents, we hear a lot of confidence from both sides about what will go down in the second half, but even in normal times, let alone one of the trickiest economic backdrops any of us have ever experienced, few of them know.
There’s a lot to cover in this week’s Bespoke Report, including the horrible first half and what it might mean for the second half, the state of the economy and inflation, a preview of earnings season and the midterm elections, a look at consumer sentiment, and much more. To read this week’s full Bespoke Report newsletter and access everything else Bespoke’s research platform offers, start a two-week trial to one of our three membership levels.


Bespoke Market Calendar — July 2022
Please click the image below to view our July 2022 market calendar. This calendar includes the S&P 500’s average percentage change and average intraday chart pattern for each trading day during the upcoming month. It also includes market holidays and options expiration dates plus the dates of key economic indicator releases. Click here to view Bespoke’s premium membership options.
