Bespoke’s Morning Lineup — 4/22/22
See what’s driving market performance around the world in today’s Morning Lineup. Bespoke’s Morning Lineup is the best way to start your trading day. Read it now by starting a two-week trial to Bespoke Premium. CLICK HERE to learn more and start your trial.
Bespoke’s Quote of the Day: “Interest rates are like gravity on valuations. If interest rates are nothing, values can be almost infinite. If interest rates are extremely high, that’s a huge gravitational pull on values.” – Warren Buffett

Below is a snippet of content from today’s Morning Lineup for Bespoke Premium members. Start a two-week trial to Bespoke Premium now to access the full report.
Yesterday’s market sell-off coincided with expectations for an even tighter Fed. As fed fund futures priced in a higher likelihood of tighter policy over the next year, equity prices fell. Below is a chart showing the expected path for the Fed Funds Rate (lower bound) through the March 2023 meeting. Pricing is now suggesting a 50 basis point hike at the May meeting, a 75 basis point hike at the June meeting, and another 50 basis point hike at the July meeting. That would take the Fed Funds Rate up to 2-2.25% (remember, it’s at just 0.25-0.50% now) by mid-July. Talk about a tight summer!
After the estimated 175 basis points of tightening through July, markets are pricing in five more consecutive 25 basis point hikes through March 2023, which would leave the lower bound of the Fed Funds Rate at 3.25%.
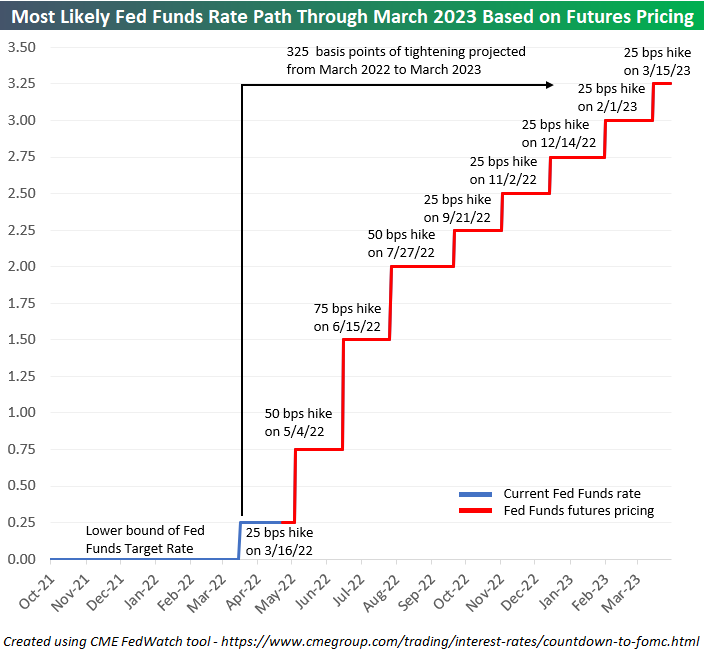
If we do see a Fed Funds Rate of 3.25-3.50% by next March, it will be tied for the steepest one-year of tightening since 1989:

Start a two-week trial to Bespoke Premium to read today’s full Morning Lineup.
Philly Fed Flips the Script
Today’s release of the Philadelphia Fed’s Business Outlook survey essentially saw the opposite results of last Friday’s Empire Fed release. Whereas the New York Fed’s headline number surged, the Philly Fed reading dropped from 27.4 to 17.6, well below expectations of 21.4.
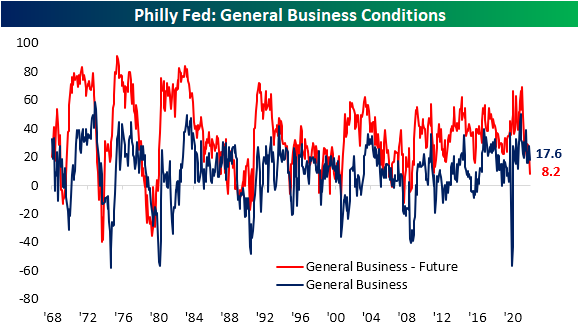
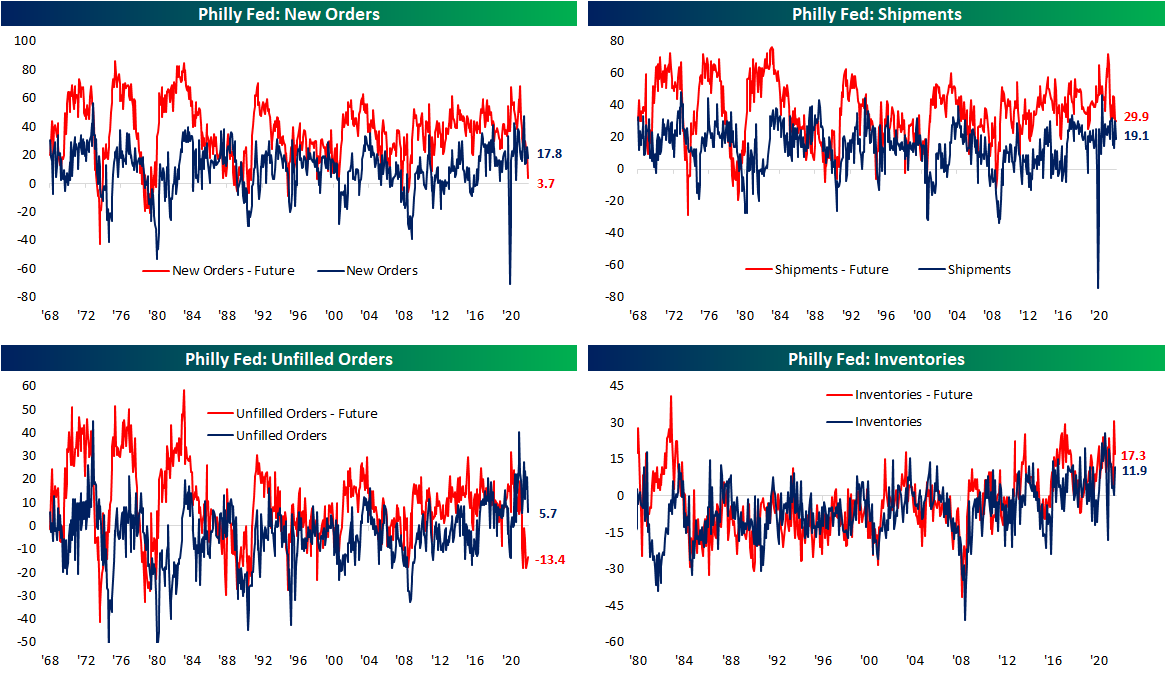
Even though current conditions indices of the two regional Fed surveys released so far this month mirrored one another, both were on the same page for future expectations. Like the Empire Fed, the Philly Fed saw broad declines across expectations indices. In fact, the only index that rose month over month was Unfilled Orders.

The April report showed a notable slowing of demand as New Orders fell 8 points, and that was the best of any demand-related index. Shipments and Unfilled Orders both dropped double digits. While still indicative of growth, just at a slower rate, these indices have fallen from upper quintile readings down to the 60th percentile range. Expectations indices are far more depressed. New Orders and Unfilled Orders are only in the 5th and 6th percentiles of their historical ranges, respectively. Ironically, Unfilled Orders was also the only expectations index to move higher in April. Inventories remain more elevated for both indices for current and future conditions. The former rose back into the upper decile of its range as the latter moderated from a 99th percentile reading last month.
As we noted earlier this week, one hopeful sign for supply chains from the Empire Fed survey was a dramatic improvement in Delivery Times. That was echoed in today’s release. The index sat just off record highs last month but after its third-largest month over month decline on record, the index has fallen all the way back down to 17.9 which is the lowest level since last February. Responding firms also report that they expect delivery times to decline in the future meaning more improvements in supply chains are expected.

Even though supply chains might not be as constrained, that does not mean firms are not paying less. The index for Prices Paid hit a new high for the pandemic with the index rising to 84.6. That is now the highest reading since June 1979. As for how those increases are being passed to consumers, Prices Paid remain off the peak from this past November with only a slightly higher reading month over month in April.

While Prices Paid came close, it was not able to set a record high this month. The index for Number of Employees however did. Moving higher for the third month in a row, this index hit a new record high of 41.4. That means Philly area manufacturers are taking on the highest number of new workers since the beginning of this survey in 1968! The average workweek remains historically elevated and off of recent lows, but that is also well below the highs earlier in the pandemic. Expectations however saw the first negative reading since February 2016. In other words, with a larger number of new hires coming on board, the average workweek is expected to shorten in the near future. Click here to view Bespoke’s premium membership options.

Sentiment Staying Pessimistic
The S&P 500 is once again fighting to gain back some lost ground in the past week. That move higher has been able to lift sentiment slightly, but overall tones remain historically pessimistic. The American Association of Individual Investors weekly sentiment survey showed bulls crawl back up to 18.9% from a historic low of 15.8% reached last week. With less than a fifth of respondents bullish, this remains in the bottom 2% of all weeks on record.
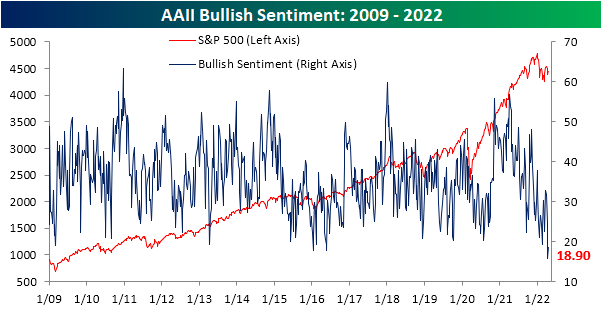
Of course, with bullish sentiment historically depressed, bearish sentiment is historically elevated at 43.9%. That is down from much higher readings of the past year that eclipsed 50% but remains just off the upper decile of its historical range.

As such, bears continue to outnumber bulls by 25 full percentage points. Given the contrarian nature of sentiment indicators, that would still be taken as a positive sign for forward performance of equities as we highlighted on page 6 of last week’s Bespoke Report.

Taking into account other sentiment indicators shows a similar picture. The NAAIM Exposure Index currently sits at 74.05 which is off of the low of 30 from early March while the Investors Intelligence survey saw the first negative bull-bear spread reading in a month this week. Combining these readings, our Sentiment Composite has come off the lows but is still at one of the weaker readings of the past decade. Click here to view Bespoke’s premium membership options.

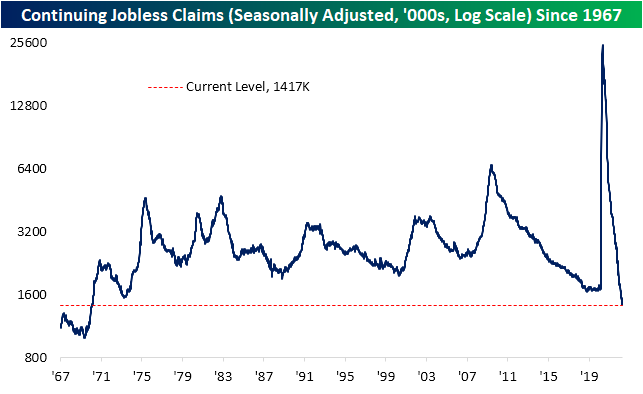
Claims Still Strong
Seasonally adjusted initial jobless claims remain off of the low from one month ago, but this week did see a sequential improvement. Claims dropped by 2K to 184K from last week’s slightly upwardly revised level of 186K. That is the ninth week in a row with sub-200K prints as claims sit at some of the lowest levels on record.

Before seasonal adjustment, claims were also impressive falling from 224.1K to 196.9K as the brief seasonal uptick at this point of the year unwinds. As shown in the second chart below, the current week of the year has only seen claims rise week over week 12% of the time historically. Claims will likely continue to see seasonal tailwinds through the next several weeks before a seasonal increase in the late spring and summer.

Lagged one week to initial claims, continuing claims came in below expectations of 1.459 million, reaching a new low of 1.417 million. That sets the lowest level since February 1970. Click here to view Bespoke’s premium membership options.
The Bespoke 50 Growth Stocks — 4/21/22
The “Bespoke 50” is a basket of noteworthy growth stocks in the Russell 3,000. To make the list, a stock must have strong earnings growth prospects along with an attractive price chart based on Bespoke’s analysis. The Bespoke 50 is updated weekly on Thursday unless otherwise noted. There were no changes to the list this week.
The Bespoke 50 is available with a Bespoke Premium subscription or a Bespoke Institutional subscription. You can learn more about our subscription offerings at our Membership Options page, or simply start a two-week trial at our sign-up page.

The Bespoke 50 performance chart shown does not represent actual investment results. The Bespoke 50 is updated weekly on Thursday. Performance is based on equally weighting each of the 50 stocks (2% each) and is calculated using each stock’s opening price as of Friday morning each week. Entry prices and exit prices used for stocks that are added or removed from the Bespoke 50 are based on Friday’s opening price. Any potential commissions, brokerage fees, or dividends are not included in the Bespoke 50 performance calculation, but the performance shown is net of a hypothetical annual advisory fee of 0.85%. Performance tracking for the Bespoke 50 and the Russell 3,000 total return index begins on March 5th, 2012 when the Bespoke 50 was first published. Past performance is not a guarantee of future results. The Bespoke 50 is meant to be an idea generator for investors and not a recommendation to buy or sell any specific securities. It is not personalized advice because it in no way takes into account an investor’s individual needs. As always, investors should conduct their own research when buying or selling individual securities. Click here to read our full disclosure on hypothetical performance tracking. Bespoke representatives or wealth management clients may have positions in securities discussed or mentioned in its published content.
Bespoke’s Morning Lineup — 4/21/22
See what’s driving market performance around the world in today’s Morning Lineup. Bespoke’s Morning Lineup is the best way to start your trading day. Read it now by starting a two-week trial to Bespoke Premium. CLICK HERE to learn more and start your trial.
Bespoke’s Quote of the Day: “In trading, you have to be defensive and aggressive at the same time. If you are not aggressive, you are not going to make money, and if you are not defensive, you are not going to keep the money.” – Ray Dalio
Below is a snippet of content from today’s Morning Lineup for Bespoke Premium members. Start a two-week trial to Bespoke Premium now to access the full report.
As shown below, the 8 largest US stocks are all in the red so far this month for an average decline of 8.2%. The rest of the stocks in the large-cap Russell 1,000 are only down an average of 8 basis points.

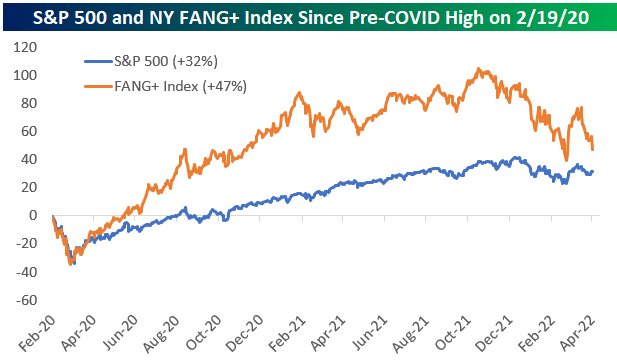
The FANG+ Index is made up of 7 of the 8 largest stocks listed above (excluding BRK/B), but it also includes Netflix (NFLX), Alibaba (BABA), and Baidu (BIDU). Since April 4th, the FANG+ index is down 17%, and it’s down 28% from its highs.
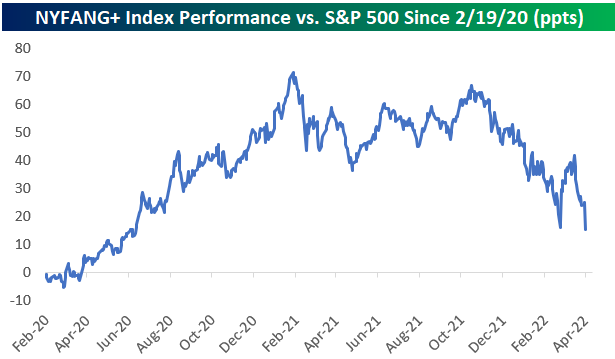
Below we show how the FANG+ index has performed versus the S&P 500 since 2/19/20 – the peak day for the US stock market before the COVID pandemic hit. FANG+ stocks exploded higher in late 2020 and peaked versus the S&P in early 2021 with an outperformance spread of more than 70 percentage points. That outperformance has been eroding rapidly since last November and the spread is only +15 percentage points now.
Start a two-week trial to Bespoke Premium to read today’s full Morning Lineup.
Are The Best Days Behind for Mortgage Activity?
US Treasury yields have continued to move higher with mortgage rates rising in tow (we explained some key distinguishing characteristics of mortgages versus Treasuries in last night’s Closer). Bankrate.com’s national average for a 30-year fixed rate mortgage has now eclipsed 5.25% in the past week which is an over 2 percentage point increase year over year. Since the start of this series on mortgage rates going back to the late 1990s, that is by far the largest year-over-year increase on record.

Higher rates mean less attractive affordability so purchase applications have continued to fall per the latest Mortgage Bankers Association data. Seasonally adjusted purchase applications dropped 3% this week and are hovering just above the February lows.

The spring is often the hottest time of the year for housing activity. As shown below, the few weeks surrounding the current one have often marked the annual high (blue dots in chart below) in non-seasonally adjusted purchase applications over the past decade. This year that might not be the case. Activity has been running below that of the prior year and has plateaued more recently as mortgage rates have taken off. At the moment, this year’s high was set a little over a month ago in the second week of March. While a new high for the year is still within tangible reach from current levels—meaning upcoming weeks could still very well experience an uptick to a new high—this year has the potential to see a much earlier than usual high in mortgage purchases.

Refinance applications meanwhile are far weaker with unrelenting declines recently. This week marked the sixth week over week decline in a row leaving the MBA’s refinance index at the lowest level since February 2019. Click here to learn more about Bespoke’s premium stock market research service.

Bespoke’s Morning Lineup — 4/20/22
See what’s driving market performance around the world in today’s Morning Lineup. Bespoke’s Morning Lineup is the best way to start your trading day. Read it now by starting a two-week trial to Bespoke Premium. CLICK HERE to learn more and start your trial.
Bespoke’s Quote of the Day: “Companies rarely die from moving too fast, and they frequently die from moving too slow.” – Reed Hastings
Below is a snippet of content from today’s Morning Lineup for Bespoke Premium members. Start a two-week trial to Bespoke Premium now to access the full report.
We certainly aren’t going to see rotation into the Communication Services sector at the open this morning with Netflix (NFLX) trading down 25% on earnings. Based on where NFLX shares are trading pre-market, the stock will be in a 63% drawdown from its high just last November. As shown below, this is the fourth time since going public in 2002 that NFLX will have experienced a drawdown of at least 60%.

Start a two-week trial to Bespoke Premium to read today’s full Morning Lineup.
Triple Play Comedown
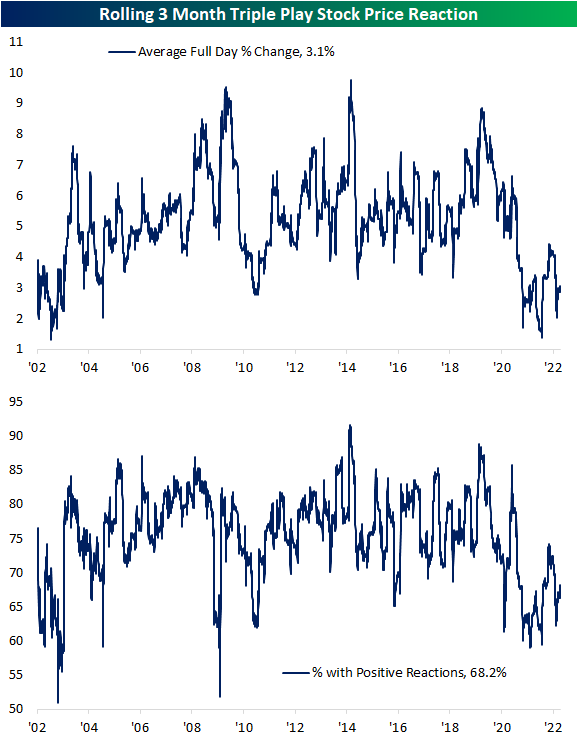
An earnings triple play is when a company beats analyst earnings estimates, beats analyst sales estimates, and also raises guidance. We consider these the gold standard for earnings as these type of results show fundamental strength and are often met with higher share prices. Using data from our Earnings Explorer database, the pandemic years have seen an explosion of triple plays as analyst estimates were too pessimistic/companies rebounded more solidly than expected. As shown below, at the highs last fall, a record of more than 18% of companies reporting earnings (on a rolling 3 month basis) reported a triple play. Over the past several months, though, that reading has pulled back considerably and today is only at 10.5%. While down from its highs, a reading of 10.5% is still elevated relative to history.

As we have noted in the past, when triple plays have been more commonplace, the market response to individual stocks reporting triple plays has been less cheerful. When the rate at which triple plays exploded earlier in the pandemic, the average full-day change on earnings days tanked to some of the weakest in the history of our data. At the low last July, the average stock that reported a triple play over the prior three months only gained ~1.5% on its earnings reaction day. For all earnings triple plays since 2002, the average one-day share price response has been roughly +5%. Recently, stock price reactions to triple plays have been improving with an average gain of 3.1% over the past three months and a little better than two-thirds of triple plays moving higher. As with the triple play rate, that is not fully back to pre-pandemic levels, but it is trending in that direction. With the number of triple plays expected to be light this season, the stocks that do manage to report them should start to be rewarded again. Click here to learn more about Bespoke’s premium stock market research service.
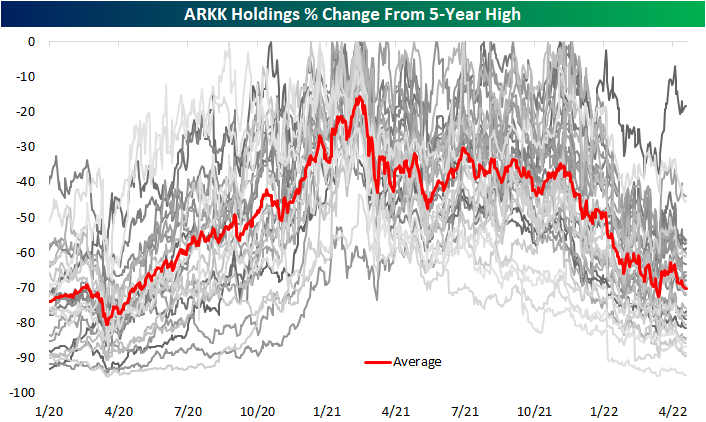
Average ARK Innovation (ARKK) Stock Down 70% From 5-Year High
While it is seeing a large bounce today currently up 5% as of this writing, Cathie Wood’s flagship fund, the ARK Innovation ETF (ARK), has had a rough go of it over the past year and change. The ETF peaked in February of last year and has fallen over 60% in the months since then, erasing the entirety of the post-pandemic rally. As for the current holdings making up the ETF, everything has pulled back from post-pandemic highs which were mostly set either in early 2021 or late 2021. To highlight this, in the chart below we show each current holding’s change (in percentage terms) from its respective 5-year high. The average holding is currently down over 70% from its high. (ARKK holdings are released daily at ARK’s website.)
Below is a snapshot of current ARKK holdings and where they’re trading relative to 5-year highs. Year to date, only one stock in the ARKK ETF, Signify Health (SGFY), has managed a positive move as the average YTD decline currently stands at 40.8%. That being said, SGFY is still down over 60% versus its February 2021 high. As previously mentioned, most other holdings similarly peaked in the first quarter of last year while many others peaked more recently last fall. As shown in the table, the average peak date for all ARKK holdings was 3/11/21.
One of the stocks that hit a high last fall is the mega-cap EV giant Tesla (TSLA). Since its November 4th, 2021 high, TSLA has fallen only 18.41%, and it is only down 5% year to date. Even though hardly anyone would wish to see an investment lose nearly a fifth of its value, that is a substantially better result than most other ARKK holdings. For example, Berkley Lights (BLI) down 94% from its 5-year high, while 43% of the ETF’s holdings have fallen by at least 75%. Given that TSLA is by far the largest ARKK holding with a 10.55% weight, its smaller decline relative to the rest of the ETF’s holdings has helped ARKK from falling even more.
With the average ARKK stock down 70% from its 5-year high, it’s going to take a huge rally in the “growth” space to get back to prior levels. As shown at the bottom of the table, the average stock in the ETF now needs to rally 348% to get back to prior highs! Click here to learn more about Bespoke’s premium stock market research service.

Bespoke Investment Group, LLC believes all information contained in this report to be accurate, but we do not guarantee its accuracy. None of the information in this report or any opinions expressed constitutes a solicitation of the purchase or sale of any securities or commodities. This is not personalized advice. Investors should do their own research and/or work with an investment professional when making portfolio decisions. As always, past performance of any investment is not a guarantee of future results. Bespoke representatives or clients may have positions in securities discussed or mentioned in its published content.