Bespoke’s Morning Lineup – 8/9/22 – Small Improvement in Small Business Sentiment
See what’s driving market performance around the world in today’s Morning Lineup. Bespoke’s Morning Lineup is the best way to start your trading day. Read it now by starting a two-week trial to Bespoke Premium. CLICK HERE to learn more and start your trial.
“Somebody needs to do something — it’s just incredibly pathetic that it has to be us.” – Jerry Garcia

Below is a snippet of content from today’s Morning Lineup for Bespoke Premium members. Start a two-week trial to Bespoke Premium now to access the full report.
Yesterday it was NVIDIA (NVDA), and today it’s Micron’s (MU) turn as the company lowered revenue guidance citing a challenging market in which customers were working down inventories. Today’s revenue warning is the second in just over a month. The last time MU lowered guidance on June 30th, it said sales for Q4 would come in at a range of $6.8 billion to $7.6 billion compared to analysts’ forecasts of $9.1 billion. This morning, MU is saying that revenues will come in at or below the low end of its guidance from June 30th. In other words, in the span of a month and ten days, MU has lowered sales forecasts by at least 25%!
Given the warning from MU, the negative tone in the futures market this morning has been most pronounced in the Nasdaq where futures are down more than half of one percent. Along with the weakness in equity futures, bond yields are modestly higher and crude oil is up over 1%. In economic data, Small Business Sentiment came in modestly better than expected, rising slightly from last month’s level, while Non-Farm Productivity was roughly in line with expectations and Unit Labor Costs were higher than forecast.
Today’s Morning Lineup discusses earnings and market news out of Europe and the Americas, overnight economic data, yesterday’s raid on Mar-a-Lago, and much more.
As the S&P 500 looks to make a higher high and break its downtrend from its high over six months ago, the cumulative advance/decline (A/D) line has already crossed both milestones. As shown in the chart below, in addition to breaking the downtrend from its high right around the turn of the year, the S&P 500’s cumulative A/D line also just recently made a higher high. Even during Monday’s trading, while the S&P 500 traded fractionally lower, the A/D line was actually firmly in positive territory at more than +100.

Start a two-week trial to Bespoke Premium to read today’s full Morning Lineup.
Monster Moves Among Russell 3,000 Stocks
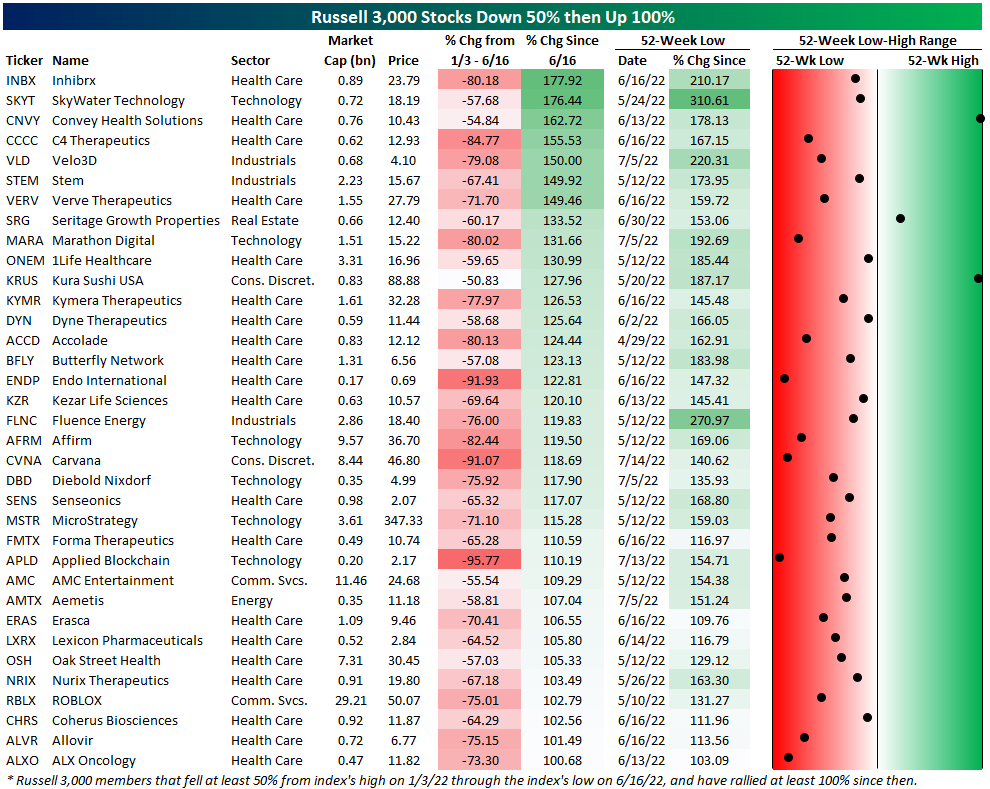
Even though equities have hit the pause button on the rally off of the late spring lows over the past few days, there have been some monster moves across a number of Russell 3,000 stocks. In the table below, we show the Russell 3,000 members that had at least been cut in half from the time of the index’s high on January 3rd through the low on June 16th followed by a rally of at least 100% since that June 16th low through today. In total, there are 35 stocks that have seen such moves, the majority of which are small cap and Health Care names (many of those being in the biotech sector which we exclude in the second table below). The two largest names to have experienced such a move have been Roblox (RBLX) with a market cap of $29 billion and AMC Entertainment (AMC) with a market cap of $11.5 billion.
As for where those rallies have left these stocks, only two are within reach of 52-week highs: Convey Health Solutions (CNVY) and Kura Sushi (KRUS). The former is only near a 52-week high due to the stock being an acquisition target recently while KRUS has more honestly been reaching 52-week highs. Aside from those two, the only other stock above the median price of the past year is Seritage Growth Properties (SRG) and that is even with each one of these stocks more than doubling since their 52-week lows. The largest rally has been a 310% run from SkyWater Technology (SKYT). Given the size of these moves and the fact that some of these stocks have at times in the past year fallen near or into the penny stock category, the range between 52-week highs (many of which occurred in the fall of last year or earlier) and 52-week lows (most of which were set in the late spring) are enormous with readings upwards of almost 4,000%. Click here to learn more about Bespoke’s premium stock market research service.

TAN Reacts to the IRA
Over the weekend, the Senate passed the Inflation Reduction Act after negotiations with Senator Manchin (D-WV) and Senator Sinema (D-AZ) concluded. The bill is nowhere near as wide-spanning, large, or impactful as the Biden administration had hoped for, but there are a few notable measures in the bill that will have significant impacts on certain parts of the economy. The name of the bill is also likely a misnomer, but the bill will reduce the deficit, establish a minimum tax rate for corporations, increase IRS funding (which should boost receivables), tax stock buybacks at 1%, incentivize electric vehicle and household appliance purchases through tax credits, encourage domestic investment in energy production, aim to reduce carbon emissions, and give the Medicare program the ability to negotiate drug prices in some situations.
As we noted in our Morning Lineup from last Friday, this is not a transformative piece of fiscal policy, as its size is less than 0.5% of GDP per annum. Although most companies will be unhappy with the buyback tax or the minimum corporate tax rate, the clean energy industry is celebrating the likely passage of this bill. As the odds of passage have become increasingly likely, the Invesco Solar ETF (TAN) has been moving higher alongside the broader market over the last few weeks. Notably, TAN has now broken its downtrend that had been in place since early 2021, depicted below, and has rallied more than 50% above its May low. Click here to learn more about Bespoke’s premium stock market research service.

Below are the US-listed components of the TAN ETF. As you can see, most are in the overbought range, led by SunPower (SNWR) and Sunnova Energy (NOVA) while only two JinkoSolar Holdings (JKS) and Azure Power (AZRE). The reason these two stocks have underperformed likely stems from the fact that both are headquartered outside of the US while the bill favors domestic producers. Overall, the clean energy space is technically overbought, but TAN is still 27.7% off its early 2021 highs. If you are a client with access, you can view a custom portfolio of these stocks by clicking here. Click here to learn more about Bespoke’s premium stock market research service.

SPY 420: Higher High or Burnout
After a gap down Friday in the wake of the much stronger than expected July Employment report, equities rallied throughout the trading session and finished near the highs of the day. Friday’s bounce sets the stage for a critical week where the S&P 500 has its eyes set on breaking above resistance just below $420. Beginning in early March, that level acted as support multiple times and eventually set the stage for a strong rally to close out the quarter. Then, once that rally ran out of gas, $420 was only able to provide brief support in the next leg lower.
In mid-May, when US stocks were back at new lows for the year, bulls were able to scrounge together enough energy to get off the couch and rally again, but it was short-lived as $420 loomed above and the buzz-kill of much stronger than expected inflation and hawkish FOMC commentary focused on the concerning increase in gas prices quickly took stocks back to new lows again. By the time July 4th came around, though, bulls must have been feeling patriotic again. That, or the fact that gas prices and other commodities were showing meaningful signs of decline, set the stage for another rally right to where the market finds itself now.
Stocks are higher to start the week with the S&P 500 up almost 1% in early trading, which is impressive given the earnings warning from NVIDIA (NVDA) just before the open. The S&P 500 was able to break its downtrend from the March high a couple of weeks ago, but if it can manage to make a higher high and clear $420, the charts will start looking a lot more kind. Click here to learn more about Bespoke’s premium stock market research service.

Bespoke’s Morning Lineup – 8/8/22 – You Don’t Have Nixon to Kick Around Anymore
See what’s driving market performance around the world in today’s Morning Lineup. Bespoke’s Morning Lineup is the best way to start your trading day. Read it now by starting a two-week trial to Bespoke Premium. CLICK HERE to learn more and start your trial.
“Because only if you’ve been in the deepest valley can you ever know how magnificent it is to be on the highest mountain.” – Richard Nixon
Below is a snippet of content from today’s Morning Lineup for Bespoke Premium members. Start a two-week trial to Bespoke Premium now to access the full report.
People always need a scapegoat, and in the Summer of 1974 with the economy stuck in a deep recession and inflation surging, the buck stopped at Richard Nixon. Mired in the Watergate scandal and with impeachment proceedings underway, Nixon announced his intention to resign from office the following day. Nixon’s resignation didn’t staunch the bleeding, and over the following two months, the S&P 500 declined another 20% before finally bottoming in early October. By the following February, though, stocks were already back at pre-resignation levels, and they didn’t look back from there. While stocks bottomed, the rest of the 1970s wasn’t a particularly good period for the economy or markets though. There are plenty of similarities between now and the early 1970s, but the differences are probably even greater, and the market backdrop isn’t nearly as bad now as it was 48 years ago today.
Today’s Morning Lineup discusses new trends in US industrial policy, earnings and market news out of Europe and the Americas, and much more.
The S&P 500 managed positive returns last week making it the third straight week of gains. That may not sound all that impressive at first, but when you consider that there were only three up weeks in the entire second quarter, it sounds like a much bigger deal. Last week’s rally was on the small side as the S&P 500 rose less than 0.5%, but six sectors managed to post gains.
Leading the way higher were Technology and Communication Services, which each rallied more than 1%, followed by Consumer Discretionary which came up just shy of the 1% mark. On the downside, three sectors also declined more than 1%, but the big loser was Energy. With a decline of 6.81% last week, XLE dropped below its 50-DMA and is the only sector heading into this week below that level. Energy may be the biggest loser recently, but it still tops the leaderboard on a YTD basis by a wide margin (+34.31%) and is one of just two sectors, along with Utilities (+5.22%), that is in the black YTD.

Start a two-week trial to Bespoke Premium to read today’s full Morning Lineup.
Bespoke Brunch Reads: 8/7/22
Welcome to Bespoke Brunch Reads — a linkfest of the favorite things we read over the past week. The links are mostly market related, but there are some other interesting subjects covered as well. We hope you enjoy the food for thought as a supplement to the research we provide you during the week.
While you’re here, join Bespoke Premium with a 30-day free trial!
Institutional Investors
Virginia pension fund invests in crypto lending in bid to boost returns
A county pension fund is trying its hand at crypto yield farming despite high profile catastrophes in the space over the past six months, operating under an impressively self-assured “blood in the streets” thesis. [Link; paywall]
SoftBank Emerges as a Big Loser of the Tech Downturn. Again. by Eliot Brown (WSJ)
It won’t surprise anyone that the investor who was mad position sizes were far too small as market surged ended up one of the biggest bagholders in the subsequent market crash and bear market. [Link; paywall]
‘Real” Estate
The Metaverse Real Estate Boom Turns Into a Bust by Aidan Ryan (The Information)
The surge in prices for property positioned in the metaverse that came as the strange concept rolled out has led to a massive bust amidst collapsing prices for everything from crypto to tech to semiconductors. [Link; payroll]
What Remote Work Debate? They’ve Been Back at the Office for a While. by Emma Goldberg (NYT)
After more uniform work-from-home policies during the pandemic, smaller cities have retreated to the office at full speed while larger metros debate the pros and cons of remote work. [Link; soft paywall]
Energy Prices
Oh, poor thing: Yacht owners moan they’re getting hit by stubbornly high diesel prices by Lydia Moynihan (NYP)
Yachts are famous gas guzzlers, swallowing vast quantities of diesel every time they leave the dock. Large yachts around 70 feet can burn over 100 gallons per hour just idling their engines. [Link]
Europe’s energy crisis: Controversy as Spain bans air conditioning from dropping below 27°C by Laura Llach (Euronews)
Even air conditioned buildings in the stifling heat of Spain offer less relief than normal thanks to EU-wide efforts to reduce natural gas consumption amidst a crunch in Russian supplies. [Link]
Natural Gas Surges With US LNG Export Terminal Set for Fast Restart by Gerson Freitas Jr, Sergio Chapa, and Diana Li (Bloomberg)
The US LNG terminal that suddenly shut down this summer and took billions of cubic feet of export capacity with it will reopen substantially sooner than estimated, ramping up output as soon as this October. [Link; soft paywall]
Power Companies Enter Peak Hurricane Season Lacking Enough Transformers by Jennifer Hiller and Katherine Blunt (WSJ)
Hurricane season regularly knocks out hundreds or thousands of electricity transformers across the country. But supply chain problems and booming demand for electrical equipment mean an under-inventoried utility network as the storms approach. [Link; paywall]
Education
Kids Are Back in Classrooms and Laptops Are Still Spying on Them by Pia Ceres (Wired)
Student monitoring software is a widespread feature of remote learning, with some terrifying side effects that spyware reading student texts on devices that have nothing to do with school work. [Link; soft paywall]
Jurisprudence
The most pro-business Supreme Court ever by Felix Salmon (Axios)
More than 80% of the decisions that the US Supreme Court made during 2020 came down on the side of business, the most of any year since at least 1921 per a new paper. [Link]
When Pigs Either Die or Fly
Scientists Revive Cells in Pigs’ Organs After Death by Amy Dockser Marcus (WSJ)
A paper published this week established cell function an hour after death in some pig organs, a possible lesson for safely harvesting human organs from donors in the future. [Link; paywall]
Air traffic controllers say co-pilot ‘jumped’ from plane (AP/MSN)
In North Carolina, a cargo plane with damaged landing gear made an emergency landing but not before the co-pilot jumped from the aircraft; he did not survive the fall into a suburban backyard. [Link]
Read Bespoke’s most actionable market research by joining Bespoke Premium today! Get started here.
Have a great weekend!
The Bespoke Report – 8/5/22 – The Bear-zatto Market
This week’s Bespoke Report newsletter is now available for members.
One of the surprise TV hits of the summer has been FX’s dark comedy The Bear, set in a struggling Chicago family restaurant beset with chaos, dysfunction, baggage, and drama. The show is an ode to work: the feel of walking into the kitchen on too little sleep, the staccato ring of a sharp knife prepping vegetables, the deep umami smell of a tended sauté pan, the gorgeous sheen of carefully frosted cakes, and the taste of a pile of family meal spaghetti. But it’s also an ode to dysfunction: fights between cousins and siblings, tragic suicides, drug abuse as a coping method, screaming at coworkers and friends, self sabotage and the sabotage of fellow chefs, or violent altercations in the workplace. The US economy and financial markets have been through a period of enormous dysfunction: manic highs in 2021 as policy stimulus and a surge in retail risk taking eventually gave way to a brutal bear market that has covered at least the first half of 2022, while the economy has bounced-back admirably from the COVID shock despite ongoing conflicts over labor supply, supply chain performance, geopolitical shocks to commodity markets, and the presence of the FOMC ever-ready to snuff out the expansion. Like The Bear’s protagonist, Carmine Berzatto, the FOMC has been tasked with keeping a fundamentally unstable situation on an even keel. Instead of struggling to pay vendors, re-organize the staff, optimize the menu, and manage utter chaos on an interpersonal level, the FOMC has had to balance strong growth in aggregate demand, high inflation, a large balance sheet, and supply-side disruptions. In The Bear, Carmine’s journey is both helped and hindered by his new hire Sydney, a woman hired to help manage the kitchen and re-orient strategy. In 2022, Sydney is playing the role of a Congress that has both helped ward off the worst outcomes (economic collapse) but hasn’t moved as fast or been as nimble as the protagonist ultimately needs. Despite being on its own learning curve, this week, Congress passed a taxation and spending bill that will boost investment in decarbonized energy, following passage last week of a bill that will generate significant semiconductors capex. The deeply divided Congress isn’t always working in perfect sync with the Fed, but the chaotic relationship ultimately does more harm than good for both. Ultimately, the FOMC is just as human in its foibles as Carmine Berzatto in The Bear: the central dramatic suspense of the show (whether Berzatto will close the restaurant…no spoilers from us!) is equally present in the question of whether the FOMC will halt what could be an unprecedented inflationary boom in favor of ‘closing the joint down’. Only time will tell, with investors left to guess just as viewers were whether the enigmatic protagonist will persevere or take the easy route out with predictable—if dysfunctional—results. We discuss all of the aspects of The “Bear-zatto” market and much more in this week’s Bespoke Report.
To read this week’s full Bespoke Report newsletter and access everything else Bespoke’s research platform has to offer, start a two-week trial to one of our three membership levels.


Crazy Moves in the Bond Market
The iShares 20+ Year Treasury Bond ETF (TLT) declined over 2% on Friday, which for a sector of the financial universe that is known for its safety, is a relatively rare occurrence. Since the ETF’s launch in 2002, only 3.1% of all trading days have been gains or losses of at least 2%. Not only was Friday a big move for TLT, but it was also the third day this week that the ETF was up or down 2% on the trading day. Talk about an uncertain environment! With investors looking to forecast the path and intensity of rate hikes against a backdrop of high inflation, stronger than expected economic data (like Friday’s Payroll report) puts upward pressure on yields, while weaker than expected data suggests the economy is cooling off causing bonds to rally and yields to fall.
As mentioned above, three of the last five trading days have seen daily moves of plus or minus 2%. Only two other periods throughout the history of TLT have seen a higher rate of 2%+ moves in TLT, those being August of 2011 and March of 2020. Click here to learn more about Bespoke’s premium stock market research service.

Since TLT was launched in 2002, there have only been 22 trading days in which the ETF had moved 2%+ three times over a trailing five-day period. Those occurrences are shown on the chart below and they are clustered around three different periods – the Financial Crisis, the US debt downgrade in 2011, and the COVID crash. Needless to say, these were all very tumultuous periods in the markets and economy.

Interestingly, there have been seven years since 2002 in which TLT has had less 2%+ percent daily moves than we have had in the last five days! For the entire year, this week’s three occurrences take the total number of 2% daily moves for TLT to 17. There are still five months left in 2022, but if there wasn’t another day with a gain or loss of 2%, this year would still rank fourth in terms of total 2%+ moves. Not only that, but if this year’s pace were to continue, it would put 2022 on track for a record twenty-nine 2% moves, surpassing the prior record of 22 from 2011.

Bad Models
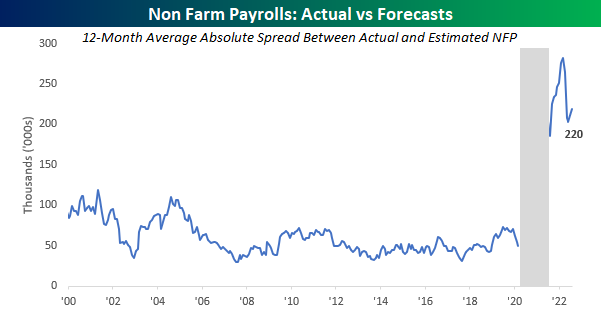
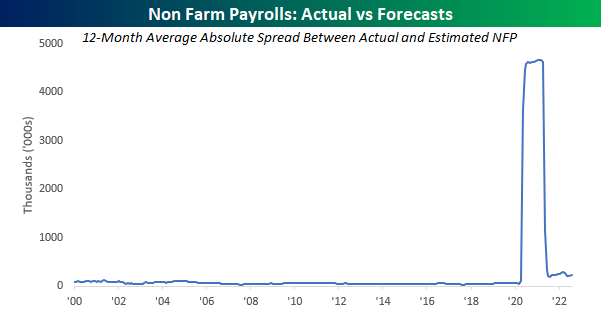
Earlier this week, the quote of the day in our Morning Lineup came from John Galbraith who once said, “Economics is extremely useful as a form of employment for economists.” Just like the broader labor market these days, it’s getting harder to find quality work in the economics profession. Friday’s release of the Non-Farm Payrolls (NFP) report for the month of July showed that the US economy created more than twice as many jobs as economists collectively forecasted (528K vs 250K), and by the individual estimates we saw, not even a single economist was even in the ballpark. While month-to-month anomalies can always pop up due to a variety of issues, ever since the COVID shock, the monthly trend in the actual versus forecasted change in NFP has been increasingly off target.
The chart below shows the 12-month moving absolute average spread between the actual monthly reported change in NFP versus the consensus forecasts. Obviously, this chart isn’t very helpful. The distortions created by COVID were unlike anything ever seen, and you can’t fault economists for not having a handle on things during that period. Nobody did. With the spread seeing a significant decline since then, have economists gotten back on track? Click here to learn more about Bespoke’s premium stock market research service.
Not at all. In the chart below, we stripped out the period where the 12-month average captures the period during the pandemic when the labor market was in chaos. Specifically, we took out the fifteen months from April 2020 through June 2021 as they include all or part of the four-month period from April through July 2020 when the NFP report was all over the map. Looking at it this way, the average spread between actual and reported Non-Farm Payrolls is now more than twice what it was in the pre-COVID period. In the months before COVID, the average actual reported change in NFP was routinely within 75K of the consensus forecast. In fact, from August 2005 through March 2020, the 12-month average never once topped 75K. In the post-COVID period, however, the 12-month average has been above 200K in 13 of the last 14 months. Forecasting the economy is no easy feat, but more than 2.5 years after COVID first reached US shores, economists still can’t seem to adjust to the realities of the current economic climate.