The Bespoke 50 Growth Stocks — 10/13/22
The “Bespoke 50” is a basket of noteworthy growth stocks in the Russell 3,000. To make the list, a stock must have strong earnings growth prospects along with an attractive price chart based on Bespoke’s analysis. The Bespoke 50 is updated weekly on Thursday unless otherwise noted. There were no changes to the list this week.
The Bespoke 50 is available with a Bespoke Premium subscription or a Bespoke Institutional subscription. You can learn more about our subscription offerings at our Membership Options page, or simply start a two-week trial at our sign-up page.

The Bespoke 50 performance chart shown does not represent actual investment results. The Bespoke 50 is updated weekly on Thursday. Performance is based on equally weighting each of the 50 stocks (2% each) and is calculated using each stock’s opening price as of Friday morning each week. Entry prices and exit prices used for stocks that are added or removed from the Bespoke 50 are based on Friday’s opening price. Any potential commissions, brokerage fees, or dividends are not included in the Bespoke 50 performance calculation, but the performance shown is net of a hypothetical annual advisory fee of 0.85%. Performance tracking for the Bespoke 50 and the Russell 3,000 total return index begins on March 5th, 2012 when the Bespoke 50 was first published. Past performance is not a guarantee of future results. The Bespoke 50 is meant to be an idea generator for investors and not a recommendation to buy or sell any specific securities. It is not personalized advice because it in no way takes into account an investor’s individual needs. As always, investors should conduct their own research when buying or selling individual securities. Click here to read our full disclosure on hypothetical performance tracking. Bespoke representatives or wealth management clients may have positions in securities discussed or mentioned in its published content.
Hurricane Claims Come In
Last week’s jobless claims number went unrevised whereas the latest week’s data rose by 9K up to 228K. That brings the seasonally adjusted number back up to the highest level since the end of August and was the first back-to-back increase since the first week of August.

On a non-seasonally adjusted basis, claims remain a hair below 200K and in line with the readings from the comparable weeks of the year in the few years before the pandemic. We would also note that the increase in claims at this point of the year is very much a regular occurrence.

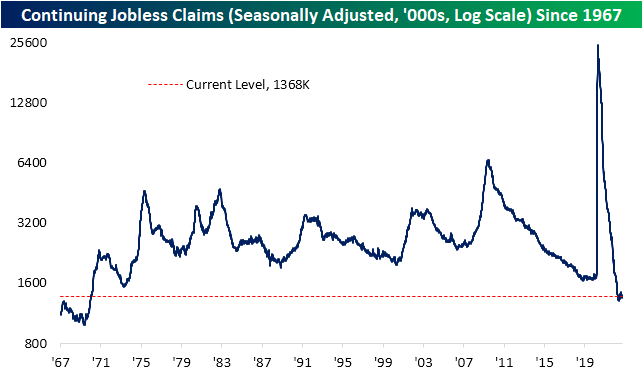
Turning to continuing claims, the latest print for data through the end of September saw a modest 3K increase to 1.368 million. That is only the highest level in three weeks as the indicator remains well below pre-pandemic levels, unlike initial claims.
On a national level, claims are moving higher but it is perhaps too early to say we are in a new trend as opposed to things like seasonality and one-off events like the weather. While 80% of states and territories saw claims move higher this week, a large share of the national move was concentrated in the Southeast likely as a result of Hurricane Ian. In the table below, we show the state-level readings for initial and continuing claims (NSA). Roughly a third of the national move in claims was thanks to claims in Florida more than tripling week over week. Now, initial claims in that state are at the highest level since May of last year. That was matched with a significant pickup in continuing claims as well. Although they have a smaller impact on national claims, other hurricane-impacted areas like Puerto Rico also saw a significant uptick in initial claims. Click here to learn more about Bespoke’s premium stock market research service.

Bespoke’s Morning Lineup – 10/13/22 – Pre Inflation Strength
See what’s driving market performance around the world in today’s Morning Lineup. Bespoke’s Morning Lineup is the best way to start your trading day. Read it now by starting a two-week trial to Bespoke Premium. CLICK HERE to learn more and start your trial.
“Inflation is the crabgrass in your savings.” – Robert Orben

Below is a snippet of content from today’s Morning Lineup for Bespoke Premium members. Start a two-week trial to Bespoke Premium now to access the full report.
Futures were higher most of the night but really picked up steam in the last hour following reports out of the UK that the Truss government was looking to reverse some of its recent tax proposals. In reaction, gilt prices are rallying, the pound is surging, and equity futures around the world have rallied. Now, if only the CPI report would cooperate. The pace of earnings is starting to pick up and this morning we got better-than-expected reports from Blackrock (BLK) and Taiwan Semi (TSM), while Delta (DAL) and Domino’s (DPZ) missed on the bottom line.
Weaker-than-expected CPI reports have become endangered over the last several months as economists just haven’t been able to keep up with the rapid increase in prices. Heading into today’s report for September, there have only been three reports in the last two years where headline CPI came in lower than expected and just one in the last year. In both cases, the 12- and 24-month totals have been at or near record lows. The average 12 and 24-month totals of weaker-than-expected reports have been 8 and 4, respectively, indicating that two-thirds of the time consensus forecasts are either at or below the actual reading. Simply put, economists have historically underestimated inflation, but the recent degree of underestimating price increases has been unprecedented to the point where betting on a higher-than-expected report has been nearly as bankable as it used to be taking the over in the NBA all-star game.

Our Morning Lineup keeps readers on top of earnings data, economic news, global headlines, and market internals. We’re biased (of course!), but we think it’s the best and most helpful pre-market report in existence!
Start a two-week trial to Bespoke Premium to read today’s full Morning Lineup.
Semis Set to Turn?
In last night’s Closer, we highlighted the diverging performance of two industries that have often been considered leading groups for the broader market: the Philadelphia Semiconductor index (SOX) and the Dow Jones Transportation Average. As of this writing, that divergence has continued today with the Transports gaining another 1% while the more new age semiconductors are down 0.7%. As a result, the ratio of the transports to the semis has continued to rally off its recent lows.
![]()
In fact, the five-day rate of change of that ratio has now risen into the double digits as it sits 12.23% above last week’s levels. Surges in the ratio like we have seen over the last week have historical precedence, but very little following the dot com era. The only recent increases that were as large or larger than the current run were in March of last year (2021) and December 2017.
![]()
In the table below, we show each time since 1994 (when the Philly Semiconductor Index begins) that the ratio mentioned above has risen by at least 10% in a one-week span without another occurrence in the prior 3 months. The current run higher in the ratio has been on the larger side of those prior instances.
However, that outperformance has not necessarily carried forward. The next week has consistently seen the Dow Transports turn lower whereas the semis have consistently posted solid gains. Looking at performance in the medium to longer term, again the semis tend to outperform with more consistently positive moves that are also much better than the norm. For example, three and six-month performances for the semis have, on average, been around three times larger than the norm for all periods. Transports, meanwhile, have seen performance that is more in line with the historical norm. Click here to learn more about Bespoke’s premium stock market research service.
![]()
Bespoke’s Morning Lineup – 10/12/22 – Is That Green on the Screen?
See what’s driving market performance around the world in today’s Morning Lineup. Bespoke’s Morning Lineup is the best way to start your trading day. Read it now by starting a two-week trial to Bespoke Premium. CLICK HERE to learn more and start your trial.
“It is well that war is so terrible, or we should grow too fond of it.” – Robert E. Lee
Below is a snippet of content from today’s Morning Lineup for Bespoke Premium members. Start a two-week trial to Bespoke Premium now to access the full report.
The big news item of the day will be the September PPI which is being released as we type this, and the results were not all that good. Headline PPI came in at 0.4% versus forecasts for an increase of 0.2%. Core PPI was in line with forecasts at 0.3%. On a y/y basis, the headline reading came in at 8.5% versus forecasts for an increase of 8.4%. Y/Y Core PPI was actually slightly weaker than expected at 7.2% versus forecasts for 7.3%. Futures were higher heading into the print along with US Treasury yields as the 10-year trades back up near 4%, but equities have now given up nearly all of their gains in the immediate aftermath of the report.
Pepsi (PEP) reported better-than-expected earnings and sales and also raised guidance this morning, and the stock is trading 2.5% higher in response. Today is really just the warmup for tomorrow, though, when we’ll get the release of CPI and banks will kick off the Q3 earnings season. In the meantime, keep an eye on the UK as officials there can’t seem to make up their minds on how long they intend to support the gilt market.
With the S&P 500 down five days in a row, the number of down days this year continues to pile up. Through Tuesday’s close, the S&P 500 has traded down on 56.9% of all trading days. That may not sound all that extreme, but since the five-trading day week began in late 1952, this year is currently on pace to have the second-highest percentage of down days in a given calendar year. The only one with a higher percentage of down days was 1974 (58.3%) when the S&P 500 was down 29.7% for the calendar year. Barring a major reversal in Fed policy, which is only taking on an increasingly hawkish stance even as economic activity shows signs of weakness, 2022 could end up in the record books.

Not only has the S&P 500 experienced a large number of down days, but the frequency of big down days has also been at historical extremes. 2022 just took out 1974 for third place in terms of the percentage of down 1% days, trailing only 2008 (29.6%) and 2002 (28.6%). Just as the S&P 500 was down nearly 30% in 1974, 2008 and 2002 were horrible years as well with declines of 38.5% and 23.4%, respectively. If it Ever Went Up, They Wouldn’t Call it Losing

Our Morning Lineup keeps readers on top of earnings data, economic news, global headlines, and market internals. We’re biased (of course!), but we think it’s the best and most helpful pre-market report in existence!
Start a two-week trial to Bespoke Premium to read today’s full Morning Lineup.
B.I.G Tips – Apprehension Ahead of Earnings Season
We’re on the cusp of another earnings season as Thursday will unofficially kick off the Q3 reporting period when the major banks and brokers start to report their results. Once again this quarter, there’s no shortage of concerns for investors and analysts to factor into their models, so the upcoming period promises to be volatile. For a more detailed rundown of the earnings schedule for the upcoming season, please see our Earnings Explorer Tool (available to all Institutional clients) on the Tools section of our website, and to see our quarterly preview of the upcoming earnings season with respect to analyst sentiment heading into it, start a two-week free trial to either Bespoke Premium or Bespoke Institutional.

Inflation and Labor Still A Problem
The NFIB released its latest small business survey this morning with data as of the month of September. As we discussed in today’s Morning Lineup, the report showed sentiment rebounded in September although labor market indicators decelerated further. That was also reflected in the report’s survey of what businesses consider to be their most important problem. While those reporting ‘cost of labor’ as the biggest problem went unchanged, the percentage of respondents reporting quality of labor as their biggest concern dropped four percentage points to 22%. While there was an even lower reading as recently as July, it was the biggest drop since last December, and the current level has fallen out of the top decile of historical readings.

While the lower reading in labor market-related problems seems to reaffirm the slowing employment situation, inflation concerns ramped up modestly in September. 30% of businesses (versus 29% in August) reported inflation as their biggest concern. Additionally, another inflation-adjacent reading also rose with 5% reporting the cost or availability of insurance to be their biggest problem.

On a combined basis, government-related concerns saw a net lower reading last month as well. Concerns around requirements and red tape rose up to a 5% share of responses, but those gains were offset by a two percentage point drop in the share of respondents seeing taxes as their biggest issue. With inflation and labor concerns remaining front and center of small business problems, government-related concerns continue to be muted to a historic degree.

While the bulk of responses view labor or inflation as their biggest issues—62% of combined responses report one of these to be their biggest problem—there was a considerable pickup in those choosing “other” as their response last month. That reading rose from 5% to 8% bringing it from a 14th percentile reading all the way up to the 65th percentile. That is now the highest reading since May when it came in at an elevated 11%. Unfortunately, the report does not provide further detail as to what those “other” concerns specifically are but geo-political issues are likely part of the mix. Click here to learn more about Bespoke’s premium stock market research service.

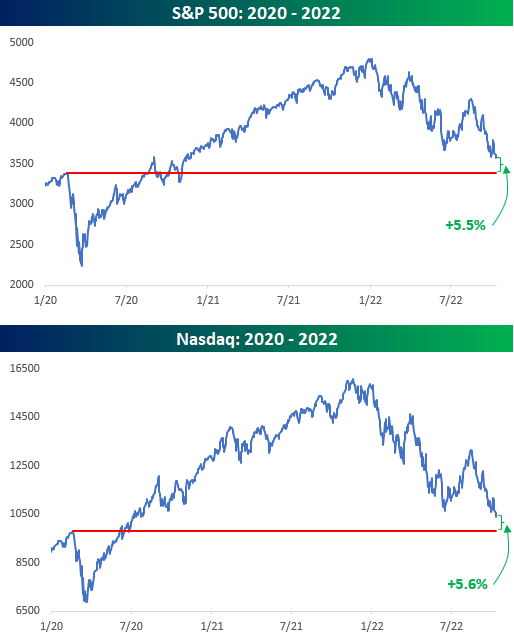
So Much for the Positive Wealth Effect
As the weakness in equities continues, we wanted to provide an update on where the major averages stand relative to their pre-COVID highs in February 2020. In the case of the S&P 500 and Nasdaq, they’re both still up, but the gains are quickly fading. It has now been just about two and a half years since the pre-COVID high for the S&P 500, and from that peak to this morning, the S&P 500 is up just 5.5% and the Nasdaq is up 5.6%. On an annualized basis, that works out to less than 2.5%. What’s that phrase people kept saying about irrational moves in stock prices?
As if equity market returns relative to the pre-COVID high weren’t pedestrian enough, keep in mind that once you take the impact of inflation into account, investors are actually now solidly in the red. The charts below show the performance of the S&P 500 and Nasdaq on an inflation-adjusted basis by adjusting historical prices based on headline CPI. After adjustments, the S&P 500 and Nasdaq are both down 7.7% from their February 2020 highs. As bad as the investing backdrop has been for equities, long-term US Treasuries have fared much worse than that. On a nominal basis, long-term US Treasuries have declined 28%, and after adjusting for inflation, the declines have been well over 30%. Click here to learn more about Bespoke’s premium stock market research service.

Bespoke’s Morning Lineup – 10/11/22 – The Roller Coaster Continues
See what’s driving market performance around the world in today’s Morning Lineup. Bespoke’s Morning Lineup is the best way to start your trading day. Read it now by starting a two-week trial to Bespoke Premium. CLICK HERE to learn more and start your trial.
“Sometimes the wheel turns slowly, but it turns.” – Lorne Michaels
Below is a snippet of content from today’s Morning Lineup for Bespoke Premium members. Start a two-week trial to Bespoke Premium now to access the full report.
Equity futures were sharply lower this morning but have rebounded sharply in the last hour. There’s no specific catalyst to the move, but the BoE’s expansion of its bond-buying program has certainly helped. The monthly look at small business sentiment from the NFIB came in slightly higher than expected (92.1 vs 91.6) and increased slightly relative to August’s reading. There are no other economic data on the calendar today, but Cleveland Fed president Loretta Mester will be speaking at noon, and remember that in late September she made some rather hawkish comments suggesting that hell or high water wouldn’t deter the Fed from hiking rates to combat inflation.
Between value and growth stocks yesterday, we saw a modest divergence where the S&P 500 Growth ETF (IVW) traded at a new low while the Value ETF (IVE) did not. At face value, that divergence would sound like a negative for growth stocks. Looking at the price charts of each ETF, though, shows that while the growth ETF made a new low yesterday breaking through its September and summer lows, the value ETF had already broken below its summer lows in late September. So yes, value has outperformed over the last few days, but the technical picture for both is lousy.

Our Morning Lineup keeps readers on top of earnings data, economic news, global headlines, and market internals. We’re biased (of course!), but we think it’s the best and most helpful pre-market report in existence!
Start a two-week trial to Bespoke Premium to read today’s full Morning Lineup.
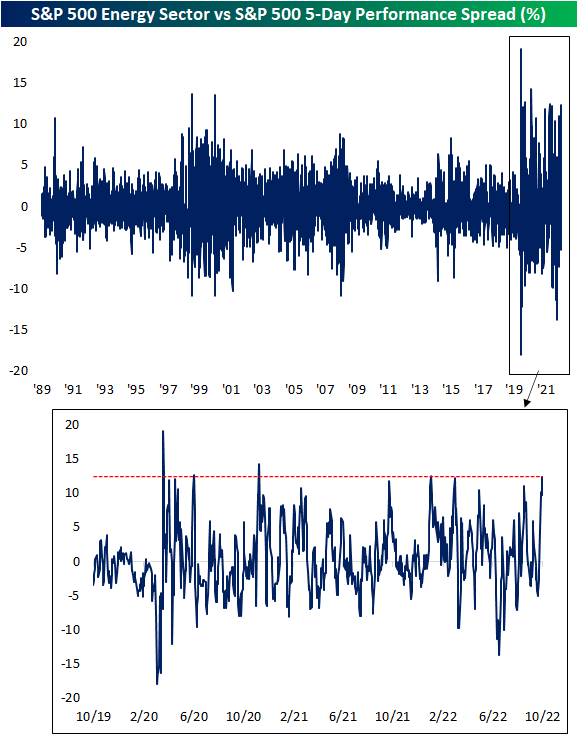
Energy Surges Without the S&P
Taking a glance across sector ETFs in our Trend Analyzer tool, performance last week through Friday’s close wasn’t fully lost as many sectors managed to hold onto their gains from earlier in the week while others like Real Estate (XLRE), Utilities (XLU), and Consumer Discretionary (XLY) finished more firmly in the red. As was the case earlier this year, the most standout sector has continued to be Energy (XLE). Although the sector has been pretty much trending sideways since the late spring and remains down double digit percentage points from its 52-week high, short term performance has been impressive. Last week the sector ETF rose 13.6% to move from one standard deviation below its 50-day to one standard deviation above. Meanwhile, every other sector remains oversold.

Compared to the S&P 500’s modest gains on the week, Energy’s outperformance has little precedence prior to the pandemic. Below we show the spread of the five day performance of the S&P 500 Energy sector and the S&P 500. Rounding out last week with a high of 12.4 percentage points, the spread hit the highest level since the first week of January. Prior to that, March, June, and November 2020 were the only other recent occurrences with as large of a spread. In our data going back to 1990, the only other time that Energy has outperformed the broader market by as much in a one week span was October 2000 and April 1999. Click here to learn more about Bespoke’s premium stock market research service.