Bespoke’s Morning Lineup – 12/7/22 – Down-cember
See what’s driving market performance around the world in today’s Morning Lineup. Bespoke’s Morning Lineup is the best way to start your trading day. Read it now by starting a two-week trial to Bespoke Premium. CLICK HERE to learn more and start your trial.
“Theory is splendid but until put into practice, it is valueless.” – James Cash Penney

Below is a snippet of content from today’s Morning Lineup for Bespoke Premium members. Start a two-week trial to Bespoke Premium now to access the full report.
December just keeps getting lousier and lousier as futures are negative, putting the S&P 500 on pace for five straight losses to kick off what has historically been one of the more positive months of the year. The culprit for this morning’s weakness is negative trade data out of China, and the action in oil over the last couple of days has been signaling that weakness. The just released reports on Nonfarm Productivity and Unit Labor Costs came in better than expected providing a boost to futures but at this point, not enough to push them into positive territory.
It hasn’t been a healthy start to the month of December for the market, but the Health Care sector has held up better than a lot of others with its decline of less than 1.3%. The sector has had a strong run from its October lows, and technicians are salivating over the impending ‘golden cross’ for the sector. A golden cross occurs when a security’s short-term moving average crosses above a longer-term one as both are rising, and it’s considered a positive technical pattern. In the case of the Health Care sector, we’re looking at the 50 and 200-day moving averages and barring any major moves, that crossover will occur tomorrow.

With a lot of technical patterns, the theoretical doesn’t always translate to reality. The table below lists the thirteen prior golden crosses for the Health Care sector since the start of 1990, and for each one, we list the sector’s performance following that occurrence. As shown at the bottom of the table, while median returns over the following week and month were better than the average for all periods since 1990, median returns three and six months later were actually below the long-term average for all periods. One year later, the Health Care sector was positive 12 out of 13 times for a median gain of 9.2%, and while the consistency of positive returns was better than average, the median return of 9.2% was basically right in line with the historical average. Historically speaking, golden crosses for the Health Care sector haven’t been bad, but they haven’t necessarily been followed by better-than-average returns either.

Our Morning Lineup keeps readers on top of earnings data, economic news, global headlines, and market internals. We’re biased (of course!), but we think it’s the best and most helpful pre-market report in existence!
Start a two-week trial to Bespoke Premium to read today’s full Morning Lineup.
Bonds Catch a Bid as Stocks Sink
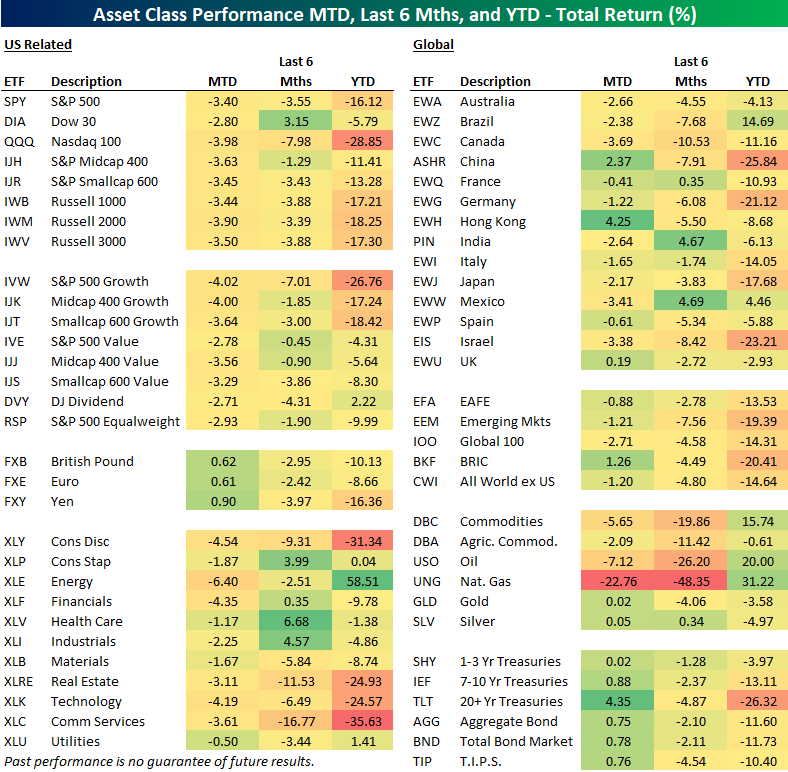
US equity markets have gotten off to a very weak start to December with four consecutive declines to start the month (and futures on Wednesday pointing to a fifth straight day). As shown below, SPY and most other major US index ETFs are already down more than 3% MTD, with growth underperforming value by a bit. Energy (XLE) is down most of the US sector ETFs followed by Consumer Discretionary (XLY) and Financials (XLF). Utilities (XLU) is down the least so far in December at just -0.50%.
International equity markets have held up a little better than the US. The All-World ex-US ETF (CWI) and the Emerging Markets ETF (EEM) are both down just 1.2% MTD, and the All-World ex-US ETF is now outperforming SPY on a YTD basis because of the recent divergence.
For most of the year heading into December, we saw the bond market fall in tandem with stocks, but recently as stocks have dropped, bonds have caught a bid. As shown in the bottom right corner of our ETF matrix below, Treasury ETFs of all durations are up on the month, with the 20+ Year Treasury (TLT) up the most at 4.35%.
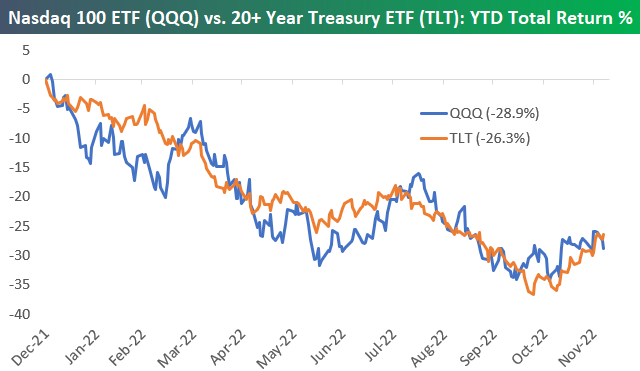
The chart below of the year-to-date percentage change (total return) of the Nasdaq 100 (QQQ) and the 20+ Year Treasury ETF (TLT) is a great way to highlight how closely stocks and bonds have tracked each other this year. So far this month, QQQ is down 3.98%, while TLT is up 4.35%, but this performance divergence over the last four days hardly shows up yet on the chart. Click here to learn more about Bespoke’s premium stock market research service.
Bespoke’s Morning Lineup – 12/6/22 – Low-Energy Energy
See what’s driving market performance around the world in today’s Morning Lineup. Bespoke’s Morning Lineup is the best way to start your trading day. Read it now by starting a two-week trial to Bespoke Premium. CLICK HERE to learn more and start your trial.
“Sometimes, you can learn more from criticism than you can from flattery.” – Doug McMillon
Below is a snippet of content from today’s Morning Lineup for Bespoke Premium members. Start a two-week trial to Bespoke Premium now to access the full report.
It’s been a quiet morning for both earnings and economic news, and futures are doing little in response after yesterday’s drubbing. JP Morgan Chase (JPM) CEO Jamie Dimon was on CNBC earlier and said he expects to see a recession in 2023. That echoes comments from UAL CEO Scott Kirby who also expects to see a mild Fed-induced recession while noting that business travel has plateaued. Other CEOs appearing on CNBC this morning didn’t go as far as to use the r-word, but Union Pacific (UNP) CEO Lance Fritz sees the economy and consumer slowing driven by weakness in housing, and Walmart CEO Doug McMillon said he sees the low-end consumer being pressured as the percentage of consumers making more than $100K per year visiting stores increases.
Yesterday, we were talking about the mixed signals coming from the equity market. Today, it’s the Energy sector’s turn. Energy-related commodities were all the rage earlier this year when Russia invaded Ukraine, setting off the potential for major supply disruptions in both the global natural gas and oil markets. At one point earlier this year, WTI was up over 64% YTD and natural gas was up 160%. That helped to push the Energy sector to a gain of over 70% on the year while just about every other area of the market was down YTD, and in many cases, down big.
Since the initial hysteria in Energy markets earlier this year, energy-related commodities have come crashing back down to earth. Over the last six months, WTI is down 35%, and natural gas is down 40%. With declines of that magnitude, you would expect to see Energy stocks under heavy pressure, but during that same span, the Energy sector is down less than 1.5% and still up 58% YTD. To be sure, even after the recent big declines in energy commodities, they’re still positive YTD, although both natural gas (51%) and crude oil (3%) have trailed the gains in Energy equities.
One explanation given for the outperformance of Energy stocks versus the commodities has been the Biden Administration’s release of oil from the Strategic Petroleum Reserve (SPR) which has acted as an artificial weight on prices. That’s certainly a valid argument, but natural gas has not had to contend with increased supply from an SPR and yet it too is down just as much as crude oil in the last six months. Just when you think you have the market figured out, it throws you a curveball.

Our Morning Lineup keeps readers on top of earnings data, economic news, global headlines, and market internals. We’re biased (of course!), but we think it’s the best and most helpful pre-market report in existence!
Start a two-week trial to Bespoke Premium to read today’s full Morning Lineup.
Bespoke Market Calendar — December 2022
Please click the image below to view our December 2022 market calendar. This calendar includes the S&P 500’s historical average percentage change and average intraday chart pattern for each trading day during the upcoming month. It also includes market holidays and options expiration dates plus the dates of key economic indicator releases. Click here to view Bespoke’s premium membership options.

Lumber Lingers to New Lows
Front-month lumber has fallen through critical levels of support at the past few months lows. In the first year of the pandemic, lumber had a brief time in the limelight as the thinly traded commodity posted massive gains from mid-2020 to mid-2021 on tight supplies amidst strong housing demand. After peaking in the spring of 2021, it has erased all of its pandemic gains. So far in December alone, it has fallen over 8% with current levels (red dotted line) down to the lowest since June 2020.

Lumber’s shaky technical picture has poor sentiment data to boot. Recent data from the Commitments of Traders report from the CFTC has shown an overwhelming share of open interest is positioned bearishly in lumber futures. As shown below, a net 48.29% of open interest is short, slightly off the lows last month but still down around some of the most pessimistic levels on record.
As we do each Monday, in tonight’s Closer, we will provide a more complete rundown of the positioning in other assets per the CFTC data.

Given it is a key input for construction, the decline in lumber prices has largely been a result of weakness in the housing sector (which we discussed in aggregate in last week’s Matrix of Economic Indicators). Like lumber, the charts of various construction/housing-related areas leave something to be desired. For example, front-month copper is running up to and failing to take out the past year’s downtrend line while Weyerhaeuser (WY)—a publicly traded American timberland company—does the same. Meanwhile, stocks in the S&P 1500’s homebuilder and building and products industries have both run into resistance at their summer highs. Click here to learn more about Bespoke’s premium stock market research service.

Bespoke’s Morning Lineup – 12/5/22 – Tip the Glass
See what’s driving market performance around the world in today’s Morning Lineup. Bespoke’s Morning Lineup is the best way to start your trading day. Read it now by starting a two-week trial to Bespoke Premium. CLICK HERE to learn more and start your trial.
“Once, during Prohibition, I was forced to live for days on nothing but food and water.” – W. C. Fields
Below is a snippet of content from today’s Morning Lineup for Bespoke Premium members. Start a two-week trial to Bespoke Premium now to access the full report.
It’s been a weak start to the trading week this morning as major averages in Europe and futures in the US are lower. While China rallied overnight, economic data in the EU didn’t do anything to encourage investors as PMI data for the services sector was generally weaker than expected, remaining in contractionary territory. Retail Sales in the region also declined slightly more than expected, falling 1.8% versus forecasts for a decline of 1.7%. Here in the US, the S&P 500 is on pace to open about 0.5% lower, treasury yields are modestly higher and crude oil is higher after OPEC+ announced plans to keep production levels intact. The only area of the market showing any strength this morning is crypto where bitcoin and Ethereum are both up nearly 1%. Overall, there’s no real catalyst for the weaker tone besides the fact that Morgan Stanley’s Mike Wilson said the rally has little upside left in the tank.
The equity market finds itself at an interesting juncture right now with almost as many conflicts as a high school lunchroom. Despite declines on five of the last six trading days, thanks to a 3%+ rally last Wednesday, the S&P 500 managed to finish the week up just over 1%. Similarly, while the S&P 500 also closed above its 200-day moving average (DMA) for the first time since the spring, the downtrend from the all-time high at the start of the year remains firmly in place. For every positive, it seems, there’s a negative.
In the European equity market, it’s a similar setup. The STOXX 600 was three weeks ahead of the S&P 500 in getting above its 200-DMA, and it also managed to break its downtrend on that same day. While those are positive technical developments, the current 16%+ rally is at least temporarily running out of gas right at the same levels that rallies in May and August both stalled out. If all of this confusion is enough to make you want to drink, look on the bright side; at least you can now do that legally now as Prohibition ended 89 years ago today.

Our Morning Lineup keeps readers on top of earnings data, economic news, global headlines, and market internals. We’re biased (of course!), but we think it’s the best and most helpful pre-market report in existence!
Start a two-week trial to Bespoke Premium to read today’s full Morning Lineup.
Bespoke Brunch Reads: 12/4/22
Welcome to Bespoke Brunch Reads — a linkfest of the favorite things we read over the past week. The links are mostly market related, but there are some other interesting subjects covered as well. We hope you enjoy the food for thought as a supplement to the research we provide you during the week.
While you’re here, join Bespoke Premium with a 30-day trial!
Compulsion
I’m Scared of My Baby Monitor by Damon Beres (The Atlantic)
Many of the products billed as reducing stress or keeping us safe are better thought of as acute vectors for stress and anxiety that we otherwise wouldn’t have. [Link; soft paywall]
Britain Opened the Door to Online Gambling. Now It’s Living With the Consequences by Gavin Finch, Harry Wilson and Ann Choi (Bloomberg)
Long before online sports gambling platforms proliferated in the US, Britain unleashed the industry on its citizens at scale. The results have been brutal including hundreds of suicides. [Link; soft paywall]
Sports Excess
When V.I.P. Isn’t Exclusive Enough: Welcome to V.V.I.P. by Sarah Lyall and Christina Goldbaum (NYT)
Rules don’t apply to the highest-paying guests at the FIFA World Cup in Qatar, but there is always an additional level of extreme luxury and exclusivity to achieve. [Link; soft paywall]
This Florida Home’s Memorabilia Collection Gives the Baseball Hall of Fame a Run for Its Money by John Sandman (WSJ)
A former health care executive has built a monumental shrine to baseball in a sprawling six bedroom, twelve bathroom house with more square footage than 15 starter homes. [Link; paywall]
Subterranean Situations
What Are Manhattan’s Street Chimneys? by Taku Ward (The Nib)
A fascinating infographic explaining why Manhattan is filled with odd, orange-and-white temporary “street chimneys” belching steam throughout the year. [Link]
Elon Musk’s Boring Company Ghosts Cities Across America by Tedd Mann and Julie Bykowicz (WSJ)
Big promises that never turn into anything are the hallmark of Elon Musk’s Boring Company, a venture that is incapable of actually delivering on anything it commits to in wave of vaporware glitz and glam. [Link; paywall]
Health Care
Google Health strikes deal with iCAD to commercialize mammography AI by Heather Landi (Fierce Healthcare)
Google Health is using artificial intelligence models to better-diagnose breast cancer, and its latest step towards commercialization is a deal that will improve models’ accuracy. [Link]
How diabetes med Ozempic became a fad weight-loss drug by Yasmin Gagne (Fast Company)
Multiple forms of the same bioactive drug (semaglutide) are proving wildly popular…but may be leading to weight loss seekers taking doses from patience that have greater medical need. [Link]
Real Estate
Where tighter monetary policy hits homeowners hardest by Neil Irwin and Courtenay Brown (Axios)
Not all housing markets have the same degree of exposure to changes in short-term interest rates, though of course exposure to short-term rate changes can be a very sharp double-edged sword. [Link]
U.S. Government to Backstop Mortgages Above $1 Million in High-Cost Areas by Andrew Ackerman (WSJ)
A few very pricey markets will see homes worth $1mm qualify for status as a conforming loan that can be backed by Fannie Mae and Freddie Mac starting next year. [Link; paywall]
Electric Vehicles
BEVs: Not Just in California Anymore by John Howard (Wards Auto)
Battery electric vehicle (BEV) adoption is surging across the country, with some of the fastest adoption coming in some unlikely places including Oklahoma City, Dallas, Houston, and Tampa. [Link]
Tesla’s Lithium Lead at Risk as Rivals Make Supply Deals by David Stringer, Yvonne Yue Li, and Gabrielle Coppola (Bloomberg)
Original equipment manufacturers (OEMs) that don’t have large BEV businesses already are setting up supply chains for their rapidly scaling battery lineups, in a process that could leave Tesla with less supply. [Link; soft paywall]
Artificial “Intelligence”
OpenAI invites everyone to test new AI-powered chatbot—with amusing results by Benj Edwards (Ars Technica)
Basic text prompts ar enough for ChatGPT to spew out an impressive range of responses that read remarkably close to human-written language. [Link]
This AI Chatbot Is a Shockingly Competent Macro Pundit by Joe Weisenthal (Bloomberg)
If you want bland, consensus commentary on macroeconomics and financial markets, the OpenAI model is surprisingly effective. [Link; paywall]
Disinformation
On TikTok, Chinese State Media Pushes Divisive Videos About U.S. Politicians by Emily Baker-White and Iain Marin (Forbes)
Chinese government accounts are editorializing US politics at epic scale, generating millions of follows and views; none were disclosed as productions of the Chinese government’s propaganda system. [Link; soft paywall]
Flight In Luxury
Alibaba founder Jack Ma living in Tokyo since China’s tech crackdown by Kana Inagaki and Leo Lewis (FT)
After the Chinese government cracked down on the companies controlled by China’s richest man, he has surfaced living a low profile existence near Tokyo that also includes jaunts to Israel and the US. [Link; paywall]
Credit Dries Up
Cash-Hungry Companies Get Creative Raising Capital by Corrie Driebusch (WSJ)
Low stock prices and pressure to preserve cash are forcing companies to place equity through private funding rounds that offer investors preferred stakes with lower risk than common stock in the same companies. [Link; paywall]
Read Bespoke’s most actionable market research by joining Bespoke Premium today! Get started here.
Have a great weekend!
The Bespoke Report — Equity Market Risk Gauge — December 2022
This week’s Bespoke Report newsletter is now available for members.
In this week’s newsletter, we’ve updated our Equity Market Risk Gauge for the month of December, and we also take a look at market technicals, improving internals, international equity market outperformance, interest rate movements, and the dollar’s recent weakness.
To see our updated Equity Risk Gauge and access everything else Bespoke’s research platform has to offer, join Bespoke Institutional and get half off for the first three months!


Bespoke’s Morning Lineup – 12/2/22 – If This is the Good News Spare Me the Bad News
See what’s driving market performance around the world in today’s Morning Lineup. Bespoke’s Morning Lineup is the best way to start your trading day. Read it now by starting a two-week trial to Bespoke Premium. CLICK HERE to learn more and start your trial.
“The indictment, in a lot of ways, that was the turning point.” – Jeffrey Skilling
Below is a snippet of content from today’s Morning Lineup for Bespoke Premium members. Start a two-week trial to Bespoke Premium now to access the full report.
History has a way of repeating itself, and just as the FTX bankruptcy is all anyone can talk about these days, it was 21 years ago today that Enron filed bankruptcy, and it was 14 years ago this month that the Madoff Ponzi scheme broke. There’s something about December and bear markets! The only difference between FTX and the Enron and Madoff scandals is that back then the masterminds of the scandals weren’t doing everything they could do to get in front of a camera, and the media wasn’t obliging them. As they say in show biz, though, any publicity is good publicity.
In any discussion of the economy these days, economists typically cite employment as an area of strength, and rightly so. When many other sectors of the economy are contracting or simply stalled out, people look for bright spots. At 3.7%, the Unemployment Rate and jobless claims are at the low end of their historical ranges, and the number of job openings in the JOLTS report is still 2.5 million above its pre-COVID peak. That’s the good news.
Less positive is the fact that momentum in US employment is clearly weakening. We saw it yesterday with Continuing Jobless Claims which are up over 20% in the last six months. Even the JOLTS report, which showed levels of job openings well above their pre-COVID peak, is still down 1.5 million from its high this March.
Today’s employment report will show another example of the labor market losing steam. Economists are forecasting Non-Farm Payrolls to 200K during the month of November, and any reading below last month’s level of 261K will be the weakest monthly reading since the end of 2020. The trend is clearly lower as the three-month average has been steadily trending lower all year.

The weaker momentum within the employment sector also comes as workers are making less. For nearly two years now, wage growth hasn’t been enough to even keep up with inflation. Over the last two years, y/y wage growth adjusted for inflation has declined at an average rate of just over 1%, and November’s report will be the 20th straight month that the reading was negative. And this is the good news!

Our Morning Lineup keeps readers on top of earnings data, economic news, global headlines, and market internals. We’re biased (of course!), but we think it’s the best and most helpful pre-market report in existence!
Start a two-week trial to Bespoke Premium to read today’s full Morning Lineup.