Bespoke Brunch Reads: 2/12/23
Welcome to Bespoke Brunch Reads — a linkfest of the favorite things we read over the past week. The links are mostly market related, but there are some other interesting subjects covered as well. We hope you enjoy the food for thought as a supplement to the research we provide you during the week.
While you’re here, join Bespoke Premium with a 30-day trial!
Frauds
The Great Gatsby of Gold Took Their Millions—and Vanished by Emily Shugerman (The Daily Beast)
An investment manager who promised investors that he would shepherd their savings via physical precious metals certificates ended up absconding with millions in client assets. [Link]
Commodity Trader Trafigura Faces $577 Million Loss After Uncovering Nickel Fraud by Archie Hunter and Jack Farchy (Bloomberg)
One of the world’s largest metals traders may have bought bogus nickel by the hundreds of millions. The metal is a favorite for fraudsters because of relatively high value-weight ratios but less scrutiny and security than precious metals. [Link; soft paywall, auto-playing video]
‘Sam? Are you there?!’ The bizarre and brutal final hours of FTX by Joshua Olver (FT)
A detailed look at leadership of the crypto trading giant as its entire business model evaporated over the course of a couple days last fall, leading to frantic calls trying to borrow billions in order to meet client redemptions. [Link; paywall]
Platform Demise
Elon Musk fires a top Twitter engineer over his declining view count by Zoë Schiffer and Casey Newton (Platformer)
When engineers tried to explain to the irate CEO of Twitter that people might be losing interest in his whole narrative (as opposed to his own tweets’ reach being suppressed by the company’s algorithm) one was fired. There are now only two principal engineers left at the company. [Link]
Tiktok’s enshittification by Cory Doctorow (Pluralistic)
As platforms grow, they stop optimizing for users and start optimizing for advertisers and other paying customers, creating negative feedback loops of bad experiences which eventually doom the audiences advertisers are trying to access. [Link]
Big Mistakes
‘As bad as it gets without body bags.’ by James Fallows (Breaking The News)
Some background on a harrowing incident at Austin’s airport which would likely have led to a disastrous mid-air collision if not for some quick thinking by a very attentive FedEx flight crew. [Link]
Your jailbroken ChatGPT might violate OpenAI’s safety guidelines when role-playing as ‘DAN’ by Clint Rainey (Fast Company)
OpenAI has built guardrails into its popular ChatGPT chatbot, but a set of instructions posted on Reddit appear to show how to get around the restraints that have been placed on the AI system by its creators. [Link]
Government Chaos
A single Republican holdout doomed the GOP’s ‘skinny budget’ on Monday by Jerod Macdonald-Evoy (AZ Mirror)
A single Republican state House legislator in Arizona is preventing the passage of a budget until the 2022 election can be re-done as she claims that the election was rigged. With a one vote majority, that means the state is faced with a difficult path to keeping government operating. [Link]
Moldova’s Pro-Western Government Collapses as Fallout From Ukraine War Worsens by James Hookway (WSJ)
The small neighbor to Ukraine, which has also been put under pressure by Russia, saw its pro-EU government resign this week after a brutal series of economic shocks related to the war in Ukraine. [Link; paywall]
Fungus
Fungal infections are becoming more common. Why isn’t there a vaccine? by Berkeley Lovelace Jr (CNBC)
While fungal infections are less of a threat than bacteria or viruses, a warmer planet is making them more common with some fungal infections untreatable. But no vaccine currently exists. [Link]
Texas
How the Crispy Dog Became San Antonio’s Signature Snack by José R. Ralat (Texas Monthly)
A cheese-stuffed dog fried in a tortilla shell is a famed snack for San Antonians, but the demise of small family restaurants that popularized the treat is making it harder to find in the city. [Link]
Investing
The Retreat of the Amateur Investors by Gunjan Banerji (WSJ)
First-time investors went from near-overnight millionaires thanks to free-to-trade apps and lots of leverage to working in delis after a year-long bear market that hit momentum and growth plays especially hard. [Link; paywall]
Real Estate
Boomer Dads Are Driving Real-Estate Agents Nuts by Adriane Quinlan (Curbed)
Millennials are relying on their parents for advice buying homes as well as funding, which has Boomer Dads more involved in real estate transactions than has historically been the case. Realtors, at least, are not fans of this arrangement. [Link]
Superbowl
Patrick Mahomes Is the NFL’s Half-Billion Dollar Quarterback. He’s Still a Bargain. by Andrew Beaton (WSJ)
While a half-billion dollar contract may sound impossible to live up to, the Kansas City Chiefs’ Patrick Mahomes has turned out to be worth much more than the Chiefs pay him. [Link; paywall]
Read Bespoke’s most actionable market research by joining Bespoke Premium today! Get started here.
Have a great weekend!
The Bespoke Report – 2/10/23 – Flesh Wound
This week’s Bespoke Report newsletter is now available for members. (Log in here if you’re already a subscriber.)
While the market is still right in the thick of earnings season, it was a quiet week in terms of news and macro data. After the deluge of both earnings reports and economic data to kick off February, and ahead of next week’s busy slate, investors could use a break. With the vacuum of info, though, investors chose to focus on the looming inflation report next week and expectations for a big jump relative to December’s deflationary reading. Based on the surge in rates, especially at the short end of the curve, investors are bracing for a hot number.
View this week’s Bespoke Report newsletter by starting a one-month trial, or click the image below to view our membership options page.

The Bespoke Triple Play Report — 2/10/23
An earnings triple play is a stock that reports earnings and manages to 1) beat analyst EPS estimates, 2) beat analyst sales estimates, and 3) raise forward guidance. You can read more about “triple plays” at Investopedia.com where they’ve given Bespoke credit for popularizing the term. We like triple plays as an indication that a company’s business is firing on all cylinders, with above-expectations results and an improving outlook. A triple play is indicative of positive “fundamental momentum” instead of pure fundamentals, and there are always plenty of names with both high and low valuations on our quarterly list.
Bespoke’s Triple Play Report highlights companies that have recently reported earnings triple plays, and it features commentary from management on triple-play conference calls, company descriptions and analysis, and price charts. Bespoke’s Triple Play Report is available at the Bespoke Institutional level only. You can sign up for Bespoke Institutional now and receive a 14-day trial to read this week’s Triple Play Report, which features 14 stocks. To sign up, choose either the monthly or annual checkout link below:
Bespoke Institutional – Monthly Payment Plan
Bespoke Institutional – Annual Payment Plan

Bespoke’s Morning Lineup – 2/10/23 – A Volatile Rally
See what’s driving market performance around the world in today’s Morning Lineup. Bespoke’s Morning Lineup is the best way to start your trading day. Read it now by starting a two-week trial to Bespoke Premium. CLICK HERE to learn more and start your trial.
“Losing a Super Bowl destroys all the good things that happened to get you there.” – Don Shula

Below is a snippet of content from today’s Morning Lineup for Bespoke Premium members. Start a two-week trial to Bespoke Premium now to access the full report.
Just like one bad trade can ruin a trader’s year, one loss can ruin an entire season. Don’t take our word for it, just ask any of the players on the rosters or the fans of the 56 prior teams who have come up on the losing end. The 2007 Patriots are considered one of the best teams in NFL history, but given how that season ended, you’d have a hard time finding anyone on that roster who would call the season a success. Whatever you do, don’t ask Rodney Harrison.
On what has been the quietest week in terms of economic data all year, it’s been a disappointing one for equities. Futures are indicated to open moderately lower, putting the S&P 500 on pace to trade down on four of five days this week. Weakness today coincided with the European open as stocks on the continent have been trending lower all morning. The Nasdaq has been even weaker. Over the last five trading days, the Nasdaq has been down over 0.99% (not quite 1%) four times, and today, it’s on pace for another 1% decline.
Through Thursday, there have only been 27 trading days this year, and yet 16 have been moves of 1% or more. Since 1972, this is the tenth year where there have been 15 or more 1% daily moves, and last year there were actually 17 at this point. What’s unique about this year, though, is how strong stocks have been during this period of heightened volatility.
Volatility is usually a characteristic of a weak stock market rather than a strong one. Of the nine prior years where the Nasdaq had at least fifteen 1% daily moves in the first 27 trading days of the year, it was down YTD six times, and the largest YTD rally was 7.2% in 2000 (21 1% daily moves). This year, the Nasdaq is up over 12%! The other years were 1999 (19) and 2001 (16), and in those years it was up 5.3% and 3.7% YTD, respectively.

Our Morning Lineup keeps readers on top of earnings data, economic news, global headlines, and market internals. We’re biased (of course!), but we think it’s the best and most helpful pre-market report in existence!
Start a two-week trial to Bespoke Premium to read today’s full Morning Lineup.
The Bespoke 50 Growth Stocks — 2/9/23
The “Bespoke 50” is a basket of noteworthy growth stocks in the Russell 3,000. To make the list, a stock must have strong earnings growth prospects along with an attractive price chart based on Bespoke’s analysis. The Bespoke 50 is updated weekly on Thursday unless otherwise noted. There were four changes to the list this week.
The Bespoke 50 is available with a Bespoke Premium subscription or a Bespoke Institutional subscription. You can learn more about our subscription offerings at our Membership Options page, or simply start a two-week trial at our sign-up page.

The Bespoke 50 performance chart shown does not represent actual investment results. The Bespoke 50 is updated weekly on Thursday. Performance is based on equally weighting each of the 50 stocks (2% each) and is calculated using each stock’s opening price as of Friday morning each week. Entry prices and exit prices used for stocks that are added or removed from the Bespoke 50 are based on Friday’s opening price. Any potential commissions, brokerage fees, or dividends are not included in the Bespoke 50 performance calculation, but the performance shown is net of a hypothetical annual advisory fee of 0.85%. Performance tracking for the Bespoke 50 and the Russell 3,000 total return index begins on March 5th, 2012 when the Bespoke 50 was first published. Past performance is not a guarantee of future results. The Bespoke 50 is meant to be an idea generator for investors and not a recommendation to buy or sell any specific securities. It is not personalized advice because it in no way takes into account an investor’s individual needs. As always, investors should conduct their own research when buying or selling individual securities. Click here to read our full disclosure on hypothetical performance tracking. Bespoke representatives or wealth management clients may have positions in securities discussed or mentioned in its published content.
Jobless Claims Above Expectations
After a few weeks of declines, jobless claims rose this week coming in at 196K on a seasonally adjusted basis compared to forecasts of a more modest increase to 190K. Albeit higher, jobless claims remain at healthy levels with this week marking the fourth in a row with a sub-200K reading.

Before seasonal adjustments, claims are at a point of the year in which they tend to trend lower. As for the most recent reading, claims rose from 225K to 234K. As shown in the second chart below, while claims do tend to fall at this point of the year, the current week of the year (as well as next week) has been less consistent with declines only around half the time. In other words, on a non-seasonally adjusted basis, claims have flattened out a bit and should continue to be watched as that plateau is not necessarily going completely against usual seasonal patterns.

Continuing claims similarly rose by more than expected this week reaching 1.688 million, the highest level in a little over a month.
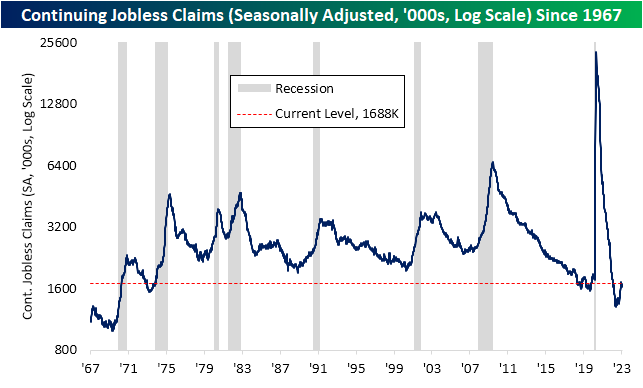
While both continuing and initial claims were higher this week, the past few months have generally seen a much more pronounced rise in the former than the latter. That marks a reversal from what was observed last year when initial claims were rising without continuing claims following suit. As a result of that move, the ratio of initial to continuing claims had surged well above what has historically been the norm, peaking in the summer. Fast forward to today, that ratio moved back below the low from early last spring to reach the lowest level since October 2020. Click here to learn more about Bespoke’s premium stock market research service.

Bespoke’s Morning Lineup – 2/9/23 – Claims Out
See what’s driving market performance around the world in today’s Morning Lineup. Bespoke’s Morning Lineup is the best way to start your trading day. Read it now by starting a two-week trial to Bespoke Premium. CLICK HERE to learn more and start your trial.
“I am a warrior, so that my son may be a merchant, so that his son may be a poet.” – John Quincy Adams
Below is a snippet of content from today’s Morning Lineup for Bespoke Premium members. Start a two-week trial to Bespoke Premium now to access the full report.
After a weak showing yesterday, bulls are attempting to rebound this morning as S&P 500 futures are up over 0.50%, and the Nasdaq is priced to open up by 1%. It’s been an extremely quiet week for economic data, but we just got two reports this morning with initial and continuing jobless claims coming out at 8:30. Both reports came in slightly higher than expected with initial claims exceeding forecasts by 6K and continuing claims topping forecasts by 28K.
Not only are US futures rising this morning, but stocks in Europe have also been marching higher. In fact, Germany’s DAX is up over 1% and is actually trading at a 52-week high. Bear what?

Today’s 52-week high for the DAX broke a streak of 314 trading days that the index has gone without trading at a 52-week high. As shown in the chart below, the streak that just ended was hardly extreme as there have been nine other periods where the index went longer without a 52-week high, including an 883 trading day stretch that ended in September 2003.

The DAX may be trading at a 52-week high from the perspective of a German investor, but for US investors, there’s still some climbing out of the hole left to go. On a dollar-adjusted basis, the DAX remains just over 6% below its 52-week high. In order to reach a new high, the dollar-adjusted DAX can get there one of two ways. It can either rally from here, or it can merely trade sideways and as the 52-week window continues to drop higher prices from last February, the bar will get increasingly set lower.

Our Morning Lineup keeps readers on top of earnings data, economic news, global headlines, and market internals. We’re biased (of course!), but we think it’s the best and most helpful pre-market report in existence!
Start a two-week trial to Bespoke Premium to read today’s full Morning Lineup.
Refis Rise
Mortgage rates have come off of recent lows with the 30-year national average from Bankrate.com currently at 6.53%. While rates are not making new lows, those are much more attractive levels than last fall when they peaked well above 7%. On a rolling 3-month basis, the decline in mortgage rates continues to rank as some of the largest since the late 1990s (after the largest increase since the 1990s).

Given the alleviation on the rates front, purchase applications have been rebounding. The Mortgage Bankers Association’s weekly purchase application index is currently 19.2% above the post-pandemic low put in place in the first week of the year.

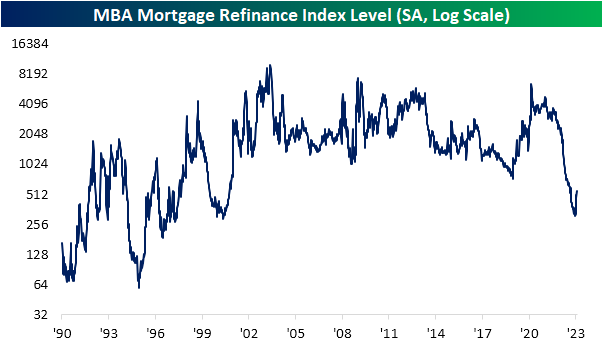
When rates were rising rapidly, massively stifling demand last year, refinance applications had taken a much larger hit than purchase applications. At the worst levels during the holidays, refinance applications reached the lowest level since May 2000. Since the start of the year, though, refinance applications have surged. Although there is still plenty of lost ground still to make up as applications continue to run below the past two decades’ range, the 68% month-over-month increase in applications has been the largest jump since March 2020 when applications doubled. Of all weekly readings since 1990, the current one-month increase ranks in the top 5% of all month-over-month moves on record. Click here to learn more about Bespoke’s premium stock market research service.

Bespoke’s Morning Lineup – 2/8/23 – All Quiet
See what’s driving market performance around the world in today’s Morning Lineup. Bespoke’s Morning Lineup is the best way to start your trading day. Read it now by starting a two-week trial to Bespoke Premium. CLICK HERE to learn more and start your trial.
“I have civilized my own subjects; I have conquered other nations; yet I have not been able to civilize or to conquer myself” – Peter the Great
Below is a snippet of content from today’s Morning Lineup for Bespoke Premium members. Start a two-week trial to Bespoke Premium now to access the full report.
They say that you should never short a dull market, but that’s what seems to be the case this morning as futures are trading modestly lower despite a very quiet macro backdrop both here and abroad. Earnings season remains in full swing and a number of stocks are seeing big moves, but none of them are impacting much more than their respective shares let alone the broader market.
It’s hard to call the day-to-day performance of the equity market this year anything but impressive. Despite last Friday’s strong employment report and a continued hawkish (although no longer hawkish with a capital H) rhetoric from FOMC officials, the S&P 500 has managed to keep its rally intact. Just yesterday, it closed right near its YTD high from last Thursday. At the index level, every major US index ETF is currently at ‘overbought’ levels (greater than one standard deviation above its 50-day moving average) and all of them are in the green YTD with all but one (Dow Jones-DIA) up at least 8%.

Where things stand this year is a far cry from a year ago. At this point last year, all but one index ETF (DIA) was trading at oversold levels, they were all down YTD, and all but one (DIA) was down over 5% YTD.

Comparing the performance of these index ETFs this year versus last year provides an even clearer picture of the complete reversal. Indices that were down the most last year at this point like the Nasdaq 100 and the Russell 2000 are among this year’s biggest winners. Meanwhile, indices that experienced the least ‘damage’ at this point in 2022, like the Dow, have lagged so far this year. Another example? Of the 14 index ETFs we track in our Trend Analyzer, the seven ETFs that were down less than 7% YTD in 2022 are the only ones up less than 10% YTD in 2023.

Our Morning Lineup keeps readers on top of earnings data, economic news, global headlines, and market internals. We’re biased (of course!), but we think it’s the best and most helpful pre-market report in existence!
Start a two-week trial to Bespoke Premium to read today’s full Morning Lineup.
People All Over AI
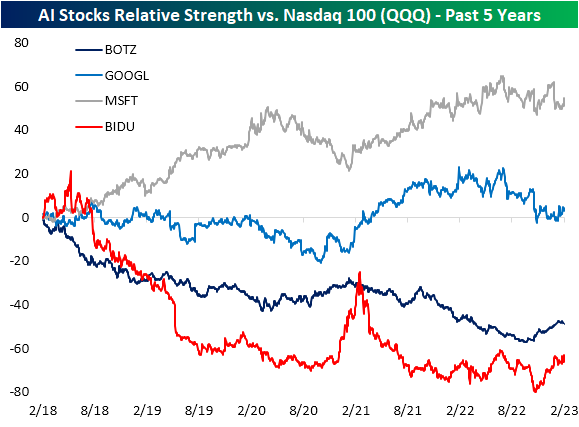
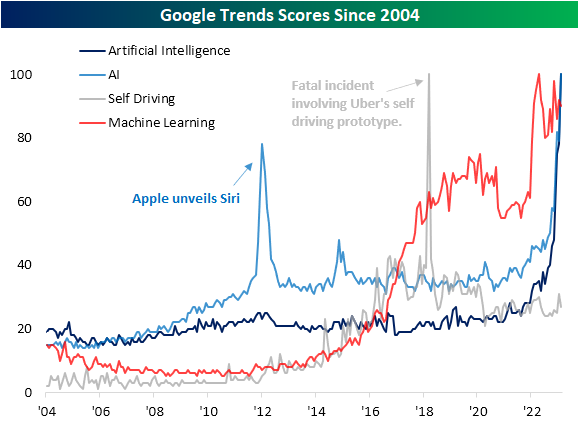
In today’s Morning Lineup post, we compared Chat GPT’s rapid emergence into the mainstream to the rise of a number of other products. While Artificial Intelligence, or AI, has been a buzzword for some time now, this year it certainly has been in the spotlight more than in the past. Given the popularity of Chat GPT, some mega-caps like Alphabet (GOOGL) and Baidu (BIDU) have jumped in on the opportunity to announce their own versions. To quantify how in focus AI has become, below we show the Google Trends scores for a handful of related terms. Readings of 100 would indicate the peak in searches for a given topic globally.
Searches for “Artificial Intelligence” or its abbreviation have reached a new record while the field of “Machine Learning” has similarly seen searches rip higher and remain elevated in the past year. One interesting area which has not seen searches rise much is in regards to the automotive industry. Searches for “self-driving” have not picked up much within the range of the past few years. That is also well below the record from March 2018 when searches spiked due to a fatal incident involving Uber’s self-driving car. That being said, it is worth noting that even before the Chat GPT craze, these searches had been moving higher quite rapidly.
As we discussed earlier, although the broad topic of AI is in vogue, related stocks have not gotten much of a boost in reaction to this news. For those having made announcements regarding AI in recent days like Alphabet (GOOGL), Microsoft (MSFT), and Baidu (BIDU), relative strength versus tech more broadly (proxied by the Nasdaq 100 ETF (QQQ)) has not done anything too notable in terms of long term trends. For MSFT and GOOGL, relative strength has been sideways at best over the past year, and BIDU has been moving higher in recent months, but that follows a few rough years for the stock relative to US tech. The same can be said for a more encapsulating basket of AI-related stocks proxied by the Global X Robotics and Artificial Intelligence ETF (BOTZ). While the relative strength has been trending lower (meaning underperformance versus tech more broadly) the past few months have seen a rebound. Click here to learn more about Bespoke’s premium stock market research service.