Aug 18, 2025
See what’s driving market performance around the world in today’s Morning Lineup. Bespoke’s Morning Lineup is the best way to start your trading day. Read it now by starting a two-week trial to Bespoke Premium. CLICK HERE to learn more and start your trial.
“If you’re afraid – don’t do it, – if you’re doing it – don’t be afraid!” – Genghis Khan

Below is a snippet of commentary from today’s Morning Lineup. Start a two-week trial to Bespoke Premium to view the full report.
Given some of the stronger inflation data, in hindsight, last week could have been worse. Looking at futures this morning and the performance of international markets overnight and this morning, it appears as though investors thought the same over the weekend. Futures are lower, but the losses are admittedly modest, so maybe it’s just the bulls taking a breather. This week will be a busy week for earnings from retailers, which should shed some light on how tariffs are impacting results, but for today, things are pretty quiet as the only report on the calendar is Homebuilder Sentiment at 10 AM, and the only earnings report of note is Palo Alto Networks (PANW) after the close.
The end of August is a popular time for vacations, and the Fed is no exception as the Kansas City Fed hangs up its ‘gone fishing’ sign and holds its annual meeting every year at the Jackson Lake Lodge in Grand Teton National Park. Fed officials are only human, so like the rest of us, they’ll never turn down the opportunity for a ‘work’ conference that happens to be at one of the most beautiful and scenic places in the world. The conference is so ‘intense’ that the chair of the Federal Reserve himself (or herself) even makes the trip to give a speech every year.
With Fed officials from around the world attending the conference every year, members of the media who follow the Fed also attend the conference each year. With all these policymakers, cameras, and microphones in one place, the result is that many newsworthy events have ended up taking place. In 2010, Fed Chair Ben Bernanke laid the groundwork for quantitative easing, which became a staple of Fed policy in the ensuing years. Then in 2014, ECB chief Mario Draghi acknowledged that inflation expectations in Europe were dangerously below the central bank’s 2% target, setting the stage for more fiscal and monetary stimulus.
More recently, back in 2022, when inflation was still raging, markets were hoping that Powell would use the conference as an opportunity to take a kinder and gentler approach to markets reeling from an aggressive run of rate hikes. Shortly after he stepped up to the podium, however, he dashed any of those hopes. He started his speech with, “Today, my remarks will be shorter, my focus narrower, and my message more direct.” Then he finished with the promise that “We are taking forceful and rapid steps to moderate demand so that it comes into better alignment with supply, and to keep inflation expectations anchored. We will keep at it until we are confident the job is done.” In other words, the beatings will continue!
With Powell scheduled to speak at the end of the week, and facing intense pressure from the President to cut rates (who knows maybe President Trump will hire one of those planes you often see at the beach towing a message behind it to further criticize Powell), anticipation to Friday’s speech is already high, and investors are expecting volatility, but how volatile does the market really get around the Jackson Hole speech?
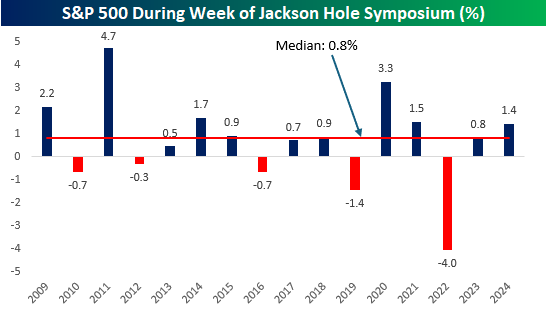
The chart below shows the S&P 500’s performance in the week of the Jackson Hole conference every year since the end of the Financial Crisis in 2009. More often than not, it’s been a positive week. Of the 16 years shown, the S&P 500 has only been down five times, with only two years where the drop was more than 1% (2019 and 2022). Overall, the S&P 500’s median performance has been a gain of 0.8%.
Aug 15, 2025
See what’s driving market performance around the world in today’s Morning Lineup. Bespoke’s Morning Lineup is the best way to start your trading day. Read it now by starting a two-week trial to Bespoke Premium. CLICK HERE to learn more and start your trial.
“The greatest danger occurs at the moment of victory” – Napoleon Bonaparte
Below is a snippet of commentary from today’s Morning Lineup. Start a two-week trial to Bespoke Premium to view the full report.
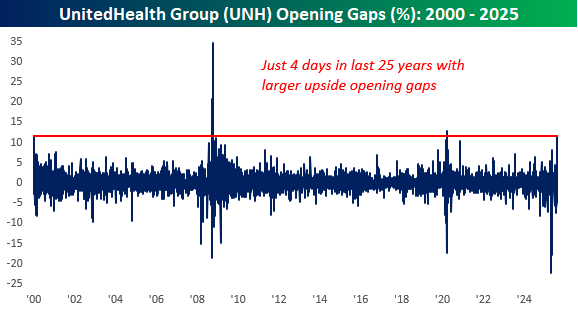
It may be a summer Friday, but there’s plenty of economic data to deal with this morning as Retail Sales and Import Prices were released at 8:30. At 9:15, we’ll get updates on Industrial Production and Capacity Utilization, and then at 10, Business Inventories and preliminary Michigan Sentiment will hit the tape. Heading into all the data, futures were mixed. Dow futures are sharply higher, but that’s all due to an 11% rally in UnitedHealth (UNH) following news that Berkshire Hathaway (BRK/b) has acquired a $5 bln stake in the company. Based on its current price, UNH is on pace to have its fifth-largest upside opening gap in the last 25 years.
It’s worth noting, though, that with the stock trading at $303 in the pre-market, it’s still trading more than 20% below its average closing price in Q2. We have no way of knowing Buffett’s cost basis on the position, but the odds are that Buffett is still underwater or barely positive on the position.
In Asia overnight, the Nikkei reversed Thursday’s losses following a better-than-expected GDP report and finished the day at another record with gains of over 1.5%. Chinese stocks were also higher, but economic data for the world’s second-largest economy missed forecasts as Retail Sales and Industrial output both came in weaker than expected.
European equities are higher across the board with modest gains as the STOXX 600 is up 0.20, led by France and Italy.
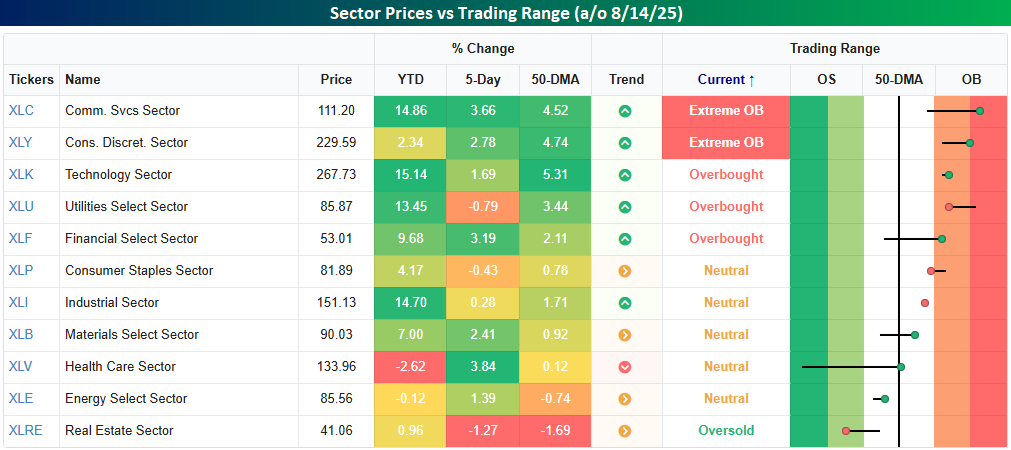
Looking through the various sectors and where they stand relative to their short-term trading ranges, we noted an interesting collection of sectors trading at overbought levels. Topping the list were Communication Services and Consumer Discretionary, which closed yesterday at ‘extreme’ overbought levels (2+ standard deviations above 50-DMA). Behind these two sectors, Technology, Utilities, and Financials all finished the day yesterday at overbought levels (1+ standard deviation above 50-DMA). It’s perfectly normal to see most of these sectors trading at overbought levels at a time when the market is in rally mode. The one exception is Utilities. Given its more defensive characteristics, Utilities tend to lag when the market is hitting all-time highs.
Utilities has been doing anything but lagging the broader market these days. As noted in last night’s Sector Snapshots report, the sector closed at overbought levels for the 27th day in a row yesterday.
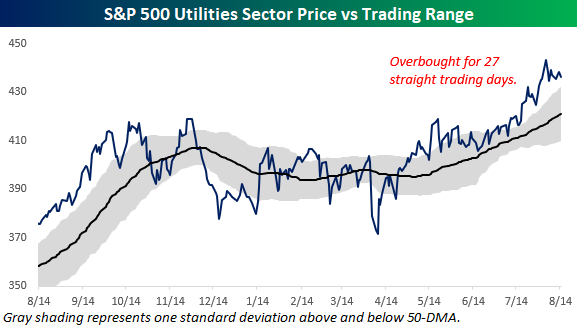
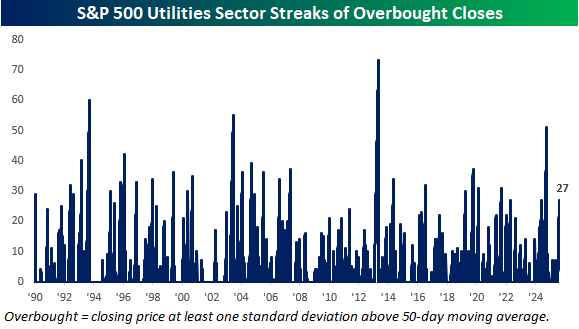
At 27 days, the current streak of overbought closes for the Utilities sector is the longest since last October. As the chart below illustrates, though, this current streak is hardly extreme. The streak last October ended at 51 trading days, and there have been many other longer streaks in recent years.
Aug 14, 2025
See what’s driving market performance around the world in today’s Morning Lineup. Bespoke’s Morning Lineup is the best way to start your trading day. Read it now by starting a two-week trial to Bespoke Premium. CLICK HERE to learn more and start your trial.
“Don’t dream it, be it” – Dr Frank-N-Furter, Rocky Horror Picture Show
Below is a snippet of commentary from today’s Morning Lineup. Start a two-week trial to Bespoke Premium to view the full report.
Heading into this morning’s PPI and jobless claims reports, equity futures were all up less than 0.05% while the 10-year yield was unchanged. The July PPI report came in much higher than expected, though, and equity futures have moved lower, but not necessarily by as much as you would expect given the magnitude of the miss. While we’ll have to look further into the report for details, jobless claims remained subdued and came in lower than expected. It’s also worth pointing out that interest rates have barely budged higher.
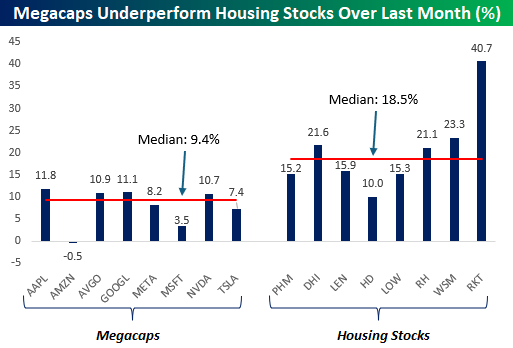
Quick question. Which group has done better over the last month? Megacaps or housing stocks? Most people would instinctively say the megacaps, but as the numbers show, the housing-related stocks have really surged over the last four weeks. The chart below compares the performance of the eight trillion-dollar megacap tech-like stocks to a group of eight housing-related stocks over the last month. For the housing basket, we’ve chosen a few homebuilders (Pulte, DR Horton, and Lennar), a couple of home improvement stocks (Home Depot and Lowe’s), housing retailers (RH and Williams Sonoma), and a mortgage company (Rocket Companies).
Of the eight megacap stocks, their performance over the last month has ranged between a decline of 0.5% and a gain of 11.1% for a median gain of 9.4%. Under any environment, 9.4% is impressive, but it pales in comparison to what the housing-related stocks have done. All eight of the stocks shown are up at least 10%, and their median gain has been nearly twice the gain of the megacaps (18.5%). HD is also the only stock in the group that isn’t outperforming all eight of the megacaps.
Aug 13, 2025
See what’s driving market performance around the world in today’s Morning Lineup. Bespoke’s Morning Lineup is the best way to start your trading day. Read it now by starting a two-week trial to Bespoke Premium. CLICK HERE to learn more and start your trial.
“Ideas come from everything” – Alfred Hitchcock
Below is a snippet of commentary from today’s Morning Lineup. Start a two-week trial to Bespoke Premium to view the full report.
Following yesterday’s CPI, traders are looking to extend the rally this morning, as futures indicate a gain of approximately 0.25% at the open. This morning, in an interview on Bloomberg TV, Treasury Secretary Scott Bessent expressed a view that the Fed should cut rates by 50 bps in September. Additionally, for anyone concerned that the Administration might end the monthly release of Non-Farm Payrolls, Bessent stated that he would not support such a move.
There’s no economic data on the calendar, but we will hear from multiple Fed Presidents throughout the day. Overnight, Asian stocks rallied, led by the Hang Seng, which surged 2.6% while the Nikkei added another 1.3% on top of Tuesday’s gains. The gains came even as a 5-year JGB auction was met with little demand. The gains in Asia flowed into Europe this morning as well, as the STOXX 600 is up 0.4% as inflation data in Germany and Spain was in line with expectations.
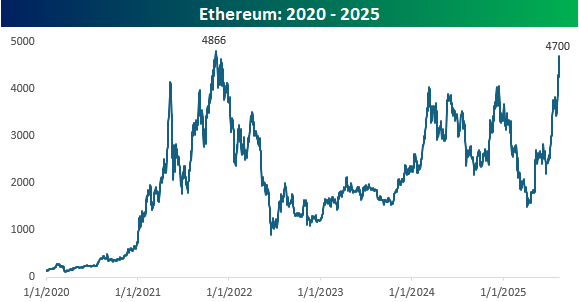
Known by most as either the ‘other crypto’ besides Bitcoin or the Bitcoin bridesmaid, Ethereum looks to be walking down the aisle on its own lately as the world’s second-largest cryptocurrency has surged from under $1,500 in April to $4,700 this morning. Over the last week, Ethereum’s price has broken out above the highs from Q4 of last year to new 52-week highs.
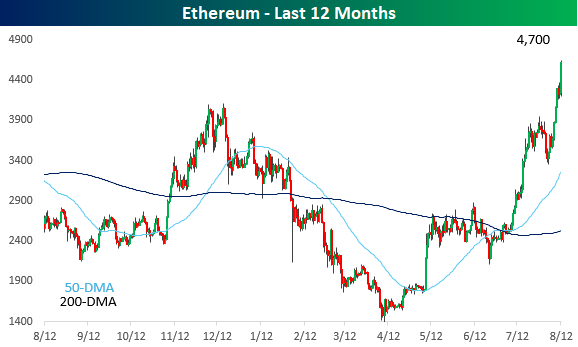
From a longer-term perspective, Ethereum is now not far from its all-time high of just under $4,900, and this morning, Standard Chartered raised its year-end price target to $7,500 and sees it trading as high as $25,000 by the end of 2028. That’s the beauty of dramatic price targets; they generate headlines when they’re made, but no one ever looks back to see if they actually panned out (hint: they seldom do).
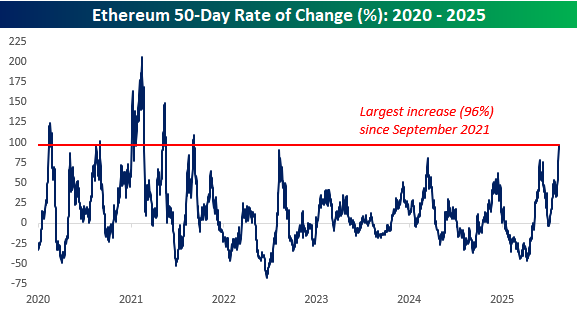
This latest surge in Ethereum has been extreme to say the least, with the 50-day rate of change rising to 96%. A move of that magnitude hasn’t been seen since September 2021.
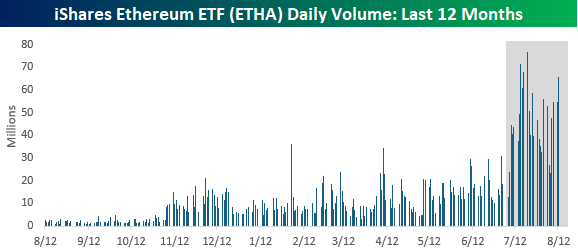
Along with the surge in price, volume in Ethereum has also surged. The chart below shows the daily volume in the iShares Ethereum ETF (ETHA) over the last year. From the start of 2025 through the end of Q2, average daily volume in ETHA was 12.3 million shares. Since the start of July, though, average daily volume has been more than 3.5 times that at just under 44 million shares per day.
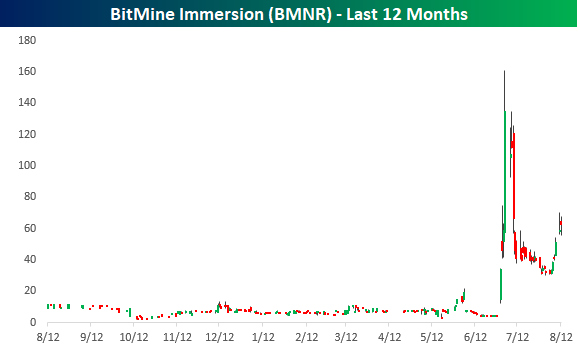
So, what’s behind the surge in Ethereum prices and volume over the last 6 or 7 weeks? As shown in the chart below, the move into overdrive coincided with the announcement at the end of June that BitMine Immersion (BMNR) would become an Ethereum treasury company, sending that stock from under $5 to as high as $161. While it pulled back quickly, at yesterday’s closing price of $62.44, the stock is still up 1,364% since June 27th!
Aug 12, 2025
See what’s driving market performance around the world in today’s Morning Lineup. Bespoke’s Morning Lineup is the best way to start your trading day. Read it now by starting a two-week trial to Bespoke Premium. CLICK HERE to learn more and start your trial.
“Reading the record, it is striking how many calamities that I anticipated did not in fact materialise.” – George Soros
Below is a snippet of commentary from today’s Morning Lineup. Start a two-week trial to Bespoke Premium to view the full report.
After a quiet day yesterday, futures aren’t doing much this morning either as investors await the release of July CPI. European markets started the day higher but have been selling off throughout the day (sound familiar?), and Asia had a mixed session, although Japan rallied more than 2% after being closed for trading on Monday. While Japanese stocks traded higher, there was literally no trading in Japan’s 10-year JGBs. That was the first time that had happened since March 2023.
July CPI came in right in line with expectations as the headline reading increased 0.2% and core rose 0.3%. On a y/y basis, headline CPI was a tenth weaker than expected at 2.7% while the core reading was a tenth higher than expected (3.1%). The initial reaction to the move was slightly lower yields and higher stock prices.
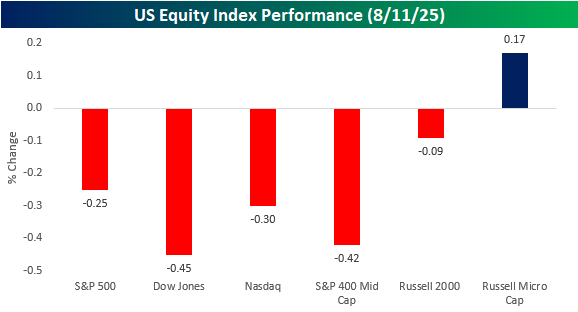
It’s hard to read too much into market activity on a quiet day in August, but the trend of intraday weakness continued to start the week as the S&P 500, as measured by SPY, closed lower than it opened for the tenth time in the last fifteen trading days. When the bell finally rang, the S&P 500 finished down 0.25%, the Dow was down 0.45%, while the Nasdaq fell 0.30%. Besides those major large-cap indices, mid-caps slumped 0.42% while small caps held up relatively well with a decline of 0.09%. The only small ray of sunshine yesterday was in the Russell Microcap Index, which finished the day 0.17% higher. When we say small, we mean it, though. The combined market cap of the companies in the index is just $426 billion, which is smaller than Netflix (NFLX), and the average market cap of companies in the index is under $400 million, with an M!
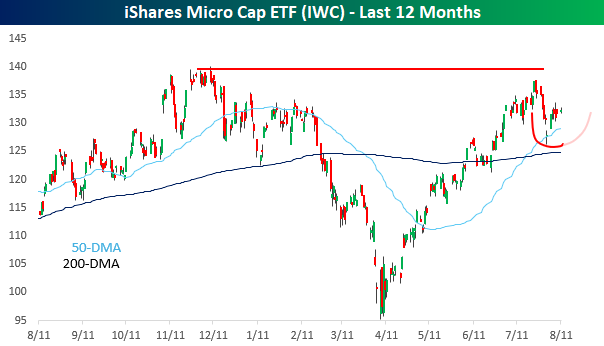
Looking at the performance of micro-caps, as measured by the iShares Microcap ETF (IWC), after testing the Q4 highs in late July, they pulled back to the 50-day moving average, where they bounced to kick off August. It’s still early, but if the bounce holds, the index could be rounding out the right side of a cup and handle formation.
Aug 11, 2025
See what’s driving market performance around the world in today’s Morning Lineup. Bespoke’s Morning Lineup is the best way to start your trading day. Read it now by starting a two-week trial to Bespoke Premium. CLICK HERE to learn more and start your trial.
“As I grow older, I pay less attention to what men say. I just watch what they do.” – Andrew Carnegie
Below is a snippet of commentary from today’s Morning Lineup. Start a two-week trial to Bespoke Premium to view the full report.
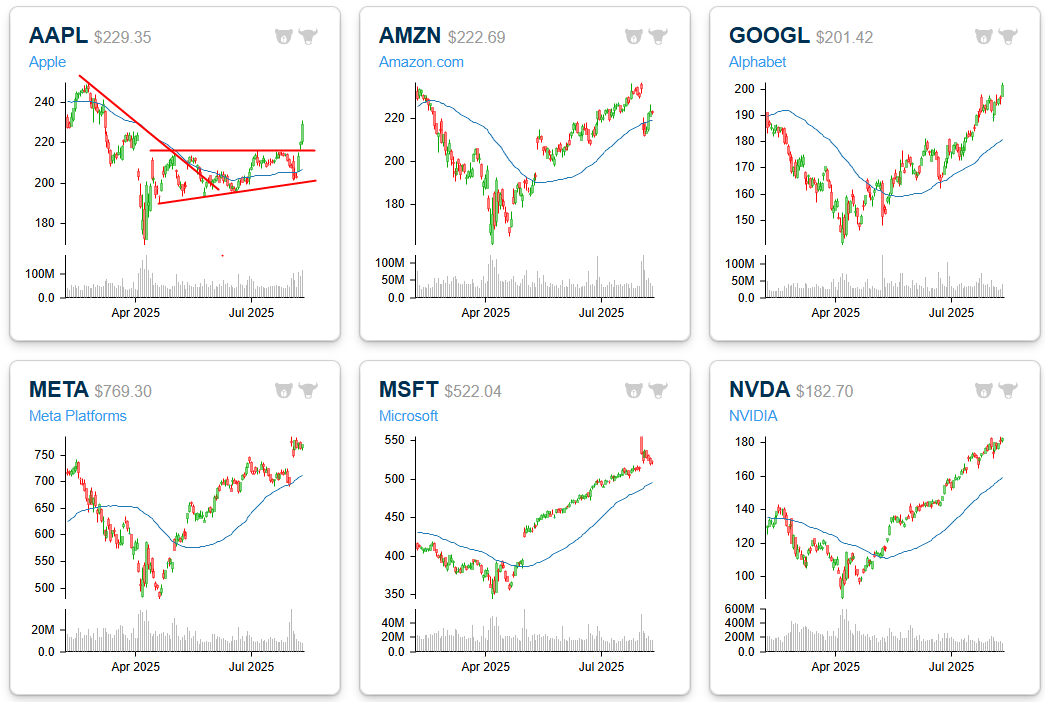
Below are six-month price charts of the mega-caps. A few months ago, pretty much all of these charts were in downtrends, but now that Apple (AAPL) has recovered and broken above resistance, all six look to be trending higher.