Nov 10, 2025
See what’s driving market performance around the world in today’s Morning Lineup. Bespoke’s Morning Lineup is the best way to start your trading day. Read it now by starting a two-week trial to Bespoke Premium. CLICK HERE to learn more and start your trial.
“When they call the roll in the Senate, the Senators do not know whether to answer ‘Present’ or ‘Not Guilty’.” – Theodore Roosevelt

Below is a snippet of commentary from today’s Morning Lineup. Start a two-week trial to Bespoke Premium to view the full report.
US equity futures are strong to start the week as the government shutdown nears an end, lifting investor spirits. Pretty soon, we may even have economic data again! The S&P 500 is indicated to open higher by just shy of 1% while the Nasdaq is up 1.5%. It may be strange to think that the market rallied in early October when the shutdown first started, and now it’s rallying when the government is poised to reopen! But investors are breathing a sigh of relief. A short shutdown is easily digestible, but the longer it lasted, the greater potential it had to ground US air travel to a halt, and that would have had major economic implications. And that’s just one of many ways the shutdown impacts overall economic activity, not to mention the hundreds of thousands of employees who haven’t been getting paid.
As stock futures rally, treasury yields are 3 to 4 bps higher, crude oil is only fractionally higher at just over $60, but gold is surging with a gain of 2.5% and back above $4,100. Meanwhile, crypto has also responded very well to the news of the shutdown ending, as Bitcoin is back above $106K and Ether trades above $3,600.
Asia was the first market to open following news that the shutdown was coming to an end, and markets started the week with broad-based gains. South Korea surged 3.0% followed by Hong Kong (+1.6%) and Japan (1.3%). Chinese inflation came in stronger than expected, reversing September’s deflationary reading (-0.3% y/y up to 0.2% y/y), but PPI remained negative as it has for an astonishing 37 straight months with a 2.1% y/y decline. There’s also some relief as the Chinese government relaxed some of its restrictions on rare earth exports and resumed exports of Nexperia chips.
Europe picked up right where Asia left off this morning, and the STOXX 600 is up 1.5% even as November investor confidence, as measured by Sentix, declined to -7.4 from -3.9 and below expectations for -5.4. Leading the way higher, Italy and Germany are up over 2%, but every major national equity benchmark is up at least 1%.
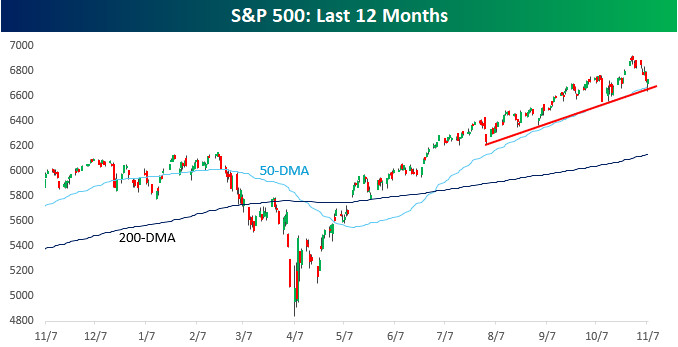
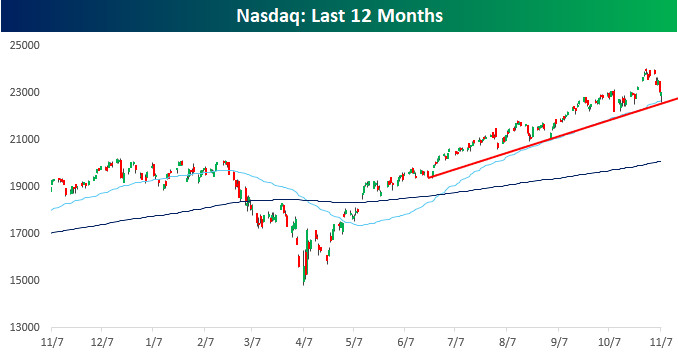
This morning’s rally to start the week comes as the S&P 500 and Nasdaq both successfully tested short-term uptrend lines and their 50-DMAs on Friday. If the morning gains can hold through the trading session, bulls will likely feel even more emboldened.
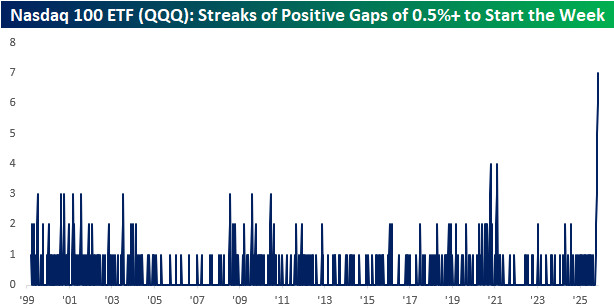
With today’s rally, both the S&P 500 and Nasdaq are on pace to gap up to start the week for the seventh straight week. That’s an impressive run and just the 15th such streak for the S&P 500 SPDR ETF (SPY) since it launched in 1993 and the 11th streak of seven or more weeks since the Nasdaq 100 ETF (QQQ) started trading in 1993. The chart below shows streaks of positive starts to the week for QQQ since it started trading in 1999, and the current streak is the longest since the 10-week record streak that ended in June of last year.
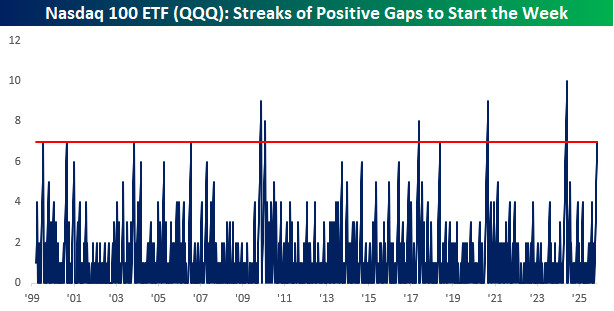
What’s even more impressive about the streak in QQQ is that every one of the positive opens has seen QQQ gap up at least 0.5% at the open. That’s the longest streak of 0.5%+ upside gaps to start a week in the ETF’s history.
Nov 7, 2025
See what’s driving market performance around the world in today’s Morning Lineup. Bespoke’s Morning Lineup is the best way to start your trading day. Read it now by starting a two-week trial to Bespoke Premium. CLICK HERE to learn more and start your trial.
“There is a crack in everything, that’s how the light gets in.” – Leonard Cohen
Below is a snippet of commentary from today’s Morning Lineup. Start a two-week trial to Bespoke Premium to view the full report.
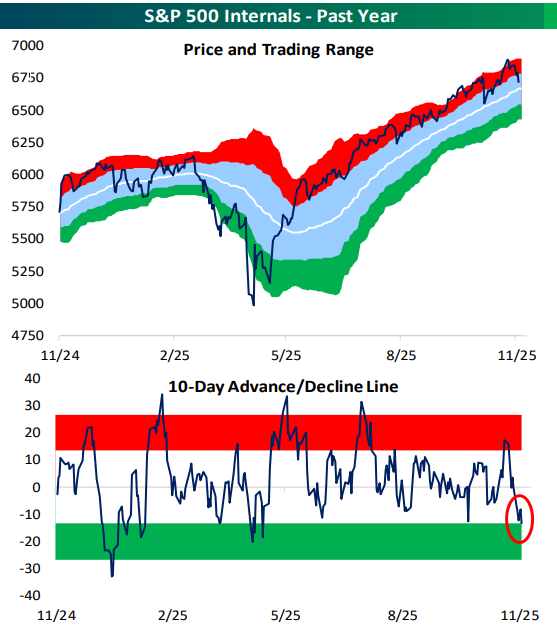
While the S&P 500’s price remains above its 50-day moving average (for now at least), its 10-day advance/decline line has moved into oversold territory for the first time since the April tariff tantrum. This is indicative of an oversold market in the short-term, even though price looks neutral on the surface.
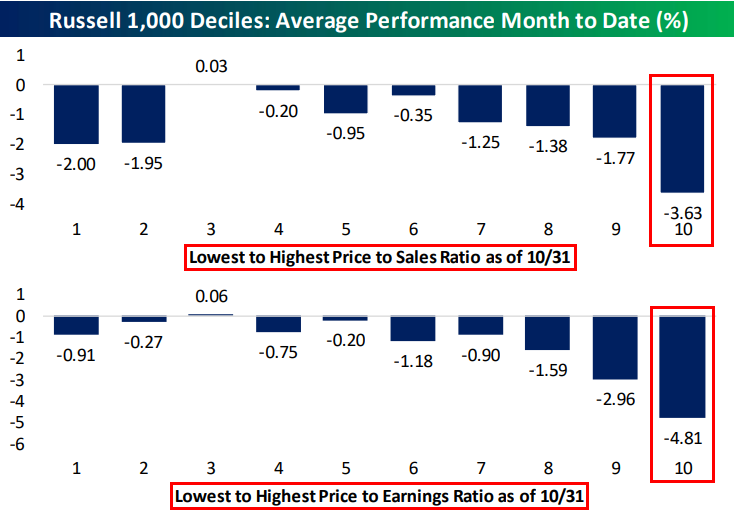
Futures are trading lower once again this morning as the bears have taken control. So far this month, the year’s biggest winners have been hit the hardest, but those are also the names with the most lofty valuations. Below are decile charts showing the performance of Russell 1,000 stocks month-to-date based on price-to-sales and price-to-earnings ratios. Decile 10 in each chart contains the stocks with the highest of these two valuation metrics. Stocks in the decile that contains the highest price-to-sales ratios are down an average of 3.6% this month, while stocks in the decile that includes the highest P/E ratios are down 4.8%. Other deciles aren’t down nearly as much.
Nov 6, 2025
See what’s driving market performance around the world in today’s Morning Lineup. Bespoke’s Morning Lineup is the best way to start your trading day. Read it now by starting a two-week trial to Bespoke Premium. CLICK HERE to learn more and start your trial.
“The problem with socialism is that you eventually run out of other peoples’ money.” – Margaret Thatcher
Below is a snippet of commentary from today’s Morning Lineup. Start a two-week trial to Bespoke Premium to view the full report.
We’re now in the back half of the Q3 earnings season, and probably the most consequential data point we’re seeing coming out of this season is continued strength in forward guidance.
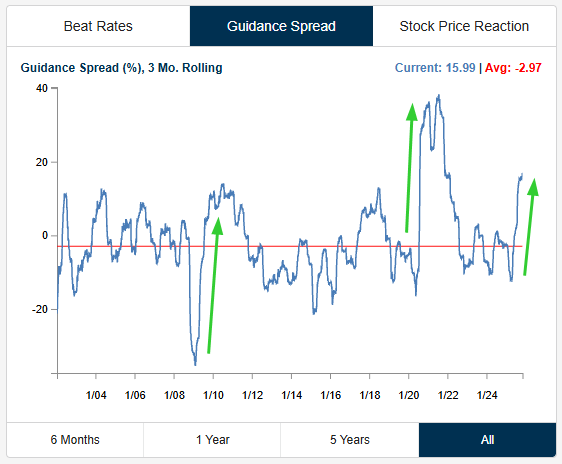
Last earnings season was the first one following the tariff tantrum of the spring, and investors were pleasantly surprised that more companies raised guidance than lowered guidance. That trend has continued in a big way this season, and with more than 1,000 companies reporting Q3 numbers thus far, we’ve seen 14% raise guidance compared to just 6% that have lowered guidance. As shown below, our guidance spread chart, which shows the percentage of companies raising minus lowering guidance on a rolling three-month basis, has spiked to a level we’ve only seen once before, which was the period coming out of the COVID Crash in 2020. These big spikes in guidance have historically happened in the early part of periods following max uncertainty.
Nov 5, 2025
See what’s driving market performance around the world in today’s Morning Lineup. Bespoke’s Morning Lineup is the best way to start your trading day. Read it now by starting a two-week trial to Bespoke Premium. CLICK HERE to learn more and start your trial.
“When it is darkest there is always light ahead.” – Roald Amundsen
Below is a snippet of commentary from today’s Morning Lineup. Start a two-week trial to Bespoke Premium to view the full report.
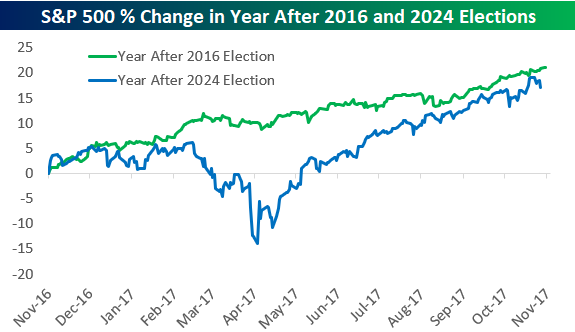
While New York City elected a democratic socialist to be its next mayor last night, today is the first anniversary of the 2024 Presidential Election. Below is a look at the S&P 500’s percentage change over the last year compared to its change in the year after President Trump’s first election victory in 2016. While the two paths diverge in the middle part of the chart because of the “tariff tantrum” seen earlier this year, the full-year performance for the S&P following the 2016 and 2024 Elections is now very similar. We’ll be looking at stock market performance during the Presidential Election Cycle in more detail in today’s Chart of the Day, so keep an eye out for that if you have an interest.
Below is our asset class performance matrix showing total returns across a range of ETFs in the year after the 2024 Election versus the year after the 2016 Election.
While large-cap domestic equity ETFs posted strong gains in the first year after Trump’s 2016 and 2024 wins, there are a lot of areas that have done a lot worse this time around.
The biggest disparities show up in small and mid-cap ETFs. In the year after the 2016 Election, we saw similar 20%+ gains across the market-cap spectrum. This time around, small-caps and mid-caps have been left in the dust, while large-caps have surged.
As an example, the S&P 500 Growth ETF (IVW) is up 27.8% since last year’s Election, while the Smallcap 600 Growth ETF (IJT) is up just 0.55%.
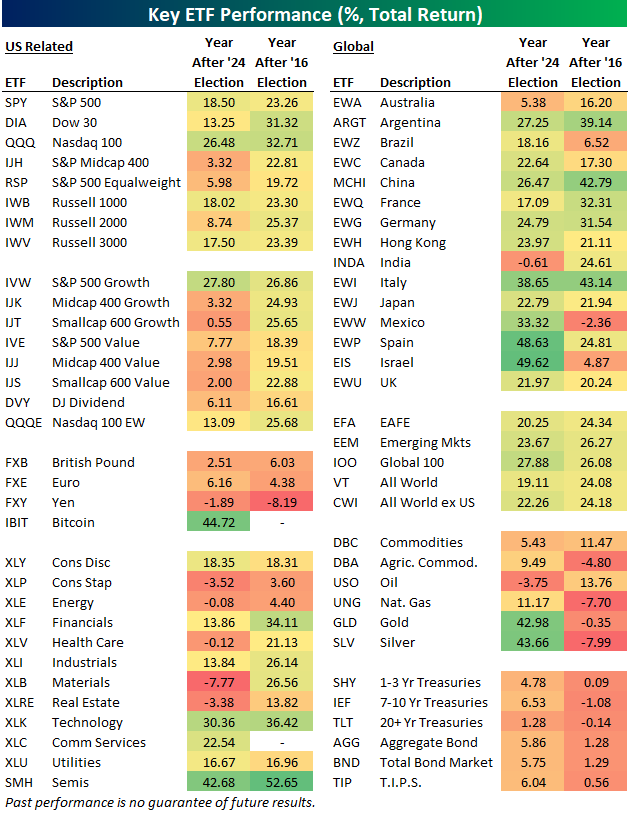
Looking at sector ETFs, Technology (XLK) and Consumer Discretionary (XLY) were up similar amounts, but Health Care (XLV), Materials (XLB), and Real Estate (XLRE) have been much weaker in the last year compared to the year after the 2016 Election.
Outside of the US, we’ve seen most country ETFs post huge gains since the 2024 Election, while their returns were much more muted in the year after the 2016 Election.
Finally, gold (GLD) and silver (SLV) have been two of the best performing ETFs in the entire matrix since Trump’s 2024 victory, but they were down in the year after his first victory.
Nov 4, 2025
See what’s driving market performance around the world in today’s Morning Lineup. Bespoke’s Morning Lineup is the best way to start your trading day. Read it now by starting a two-week trial to Bespoke Premium. CLICK HERE to learn more and start your trial.
“America’s health care system is neither healthy, caring, nor a system.” – Walter Cronkite
Below is a snippet of commentary from today’s Morning Lineup. Start a two-week trial to Bespoke Premium to view the full report.
After a strangely subdued reaction to its earnings report after the close yesterday, shares of Palantir (PLTR) are down nearly 8% in the pre-market as investors had some time to sleep on it overnight. An 8% decline is nothing to dismiss, but it’s also important to remember that PLTR is a volatile stock. In its history as a public company, the average one-day reaction to earnings has been a gain or loss of over 15%, and based on where it’s trading now, shares of PLTR are back to where they were just last Tuesday.
The decline in PLTR comes as a cloud of concern envelops the market over how fast stocks have rallied and where valuations have gone. Right on cue, a Bloomberg article says as much with the headline below. While the headline sounds scary enough, the details read a lot less scary. Essentially, it quotes various Wall Street CEOs, among them Morgan Stanley CEO Ted Pick and Goldman Sachs CEO David Solomon, suggesting that the market could see a pullback of 10% to 20% at some point in the next 12 to 24 months. Solomon was quoted as saying, “Of course, it’s likely there will be a 10% to 20% drawdown in equity markets over the next 12 months,” but even he admitted that pullbacks like that can come at any time and from any level.

Concerns are concerns, though, and when investors worry, they sell. With that, futures on the S&P 500 and Nasdaq are both indicated to open down by more than 1%, following a down session in Asia and Europe, where stocks are also broadly lower by around 1% or more.
Even with the sharp decline in equities, bond yields are only modestly lower as the 10-year yield still hangs around 4.1%. Crude oil prices are also down more than 1%, which suggests that investors are also concerned about the health of the economy, given the ongoing shutdown. We’ll be watching the level of airport delays; the more they rise, the more likely it is that policymakers in DC reach an agreement to open the government back up. Thanksgiving is just three weeks away, and no one on either side of the aisle wants to face the wrath of Americans who can’t get home for the holiday.
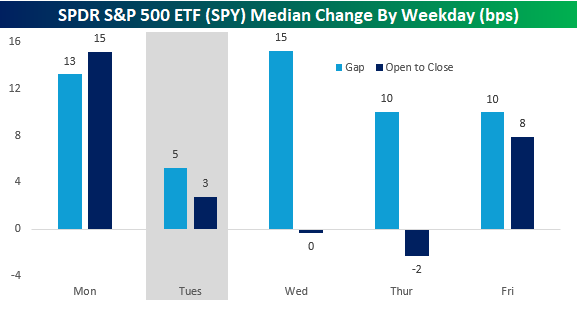
Given the scope of the pre-market declines, it must be Tuesday. As shown in the chart below, the S&P 500’s median opening gap on Tuesdays this year has been just five basis points (bps), which is less than half the next closest weekdays (Thursdays and Fridays), so the day has had a knack for weakness. From the open to close, Tuesday isn’t the weakest day of the week, but it’s still much weaker than the median gains of 15 bps on Monday and 8 bps on Friday.
Nov 3, 2025
See what’s driving market performance around the world in today’s Morning Lineup. Bespoke’s Morning Lineup is the best way to start your trading day. Read it now by starting a two-week trial to Bespoke Premium. CLICK HERE to learn more and start your trial.
“It would be a mistake to think something is wonderful just because it looks great.” – Anna Wintour
Below is a snippet of commentary from today’s Morning Lineup. Start a two-week trial to Bespoke Premium to view the full report.
Last week may have been the peak week of earnings season in terms of the market cap of companies reporting, but we have another busy week in store for investors, and it’s picking up right where it left off last week. Of the companies reporting so far today, 89% have reported better than expected EPS forecasts, and 75% have topped sales forecasts, so you can’t ask for much more than that. Even in terms of guidance, 3 companies have raised forecasts while only one lowered.
In response to the better-than-expected reports, equity futures are also picking up right where they left off last week, as markets look to open the week higher with the Nasdaq leading the way. Today’s positive open for the Nasdaq will be the ninth straight positive start to a week for the index, which is only the longest streak since summer 2024, but still tied for the second longest in the index’s history.
In Asia, Japan was closed for the day, but other indices in the region were broadly higher even as South Korea’s manufacturing PMI moved into contraction territory. In Europe, most manufacturing PMIs were also in line with forecasts, and the STOXX 600 responded by rallying 0.5% while Germany rallied more than 1%.
Outside of equities, the 10-year yield is slightly lower at 4.09% ahead of a busy week for Fed speakers, who have mostly sounded more skeptical of a December rate cut, as concerns over inflation linger even as there are signs that the labor market is stabilizing.
Crude oil prices are essentially unchanged even as OPEC+ announced over the weekend that it would increase output by 137K barrels per day, but then pause those increases beginning in January. WTI is starting the month just over $60 per barrel after declining 2% in October, taking its monthly losing streak to three months.
Gold prices are starting off the month back above $4,000 per ounce as other metals also trade higher, but the troubles for digital gold continue as bitcoin prices trade down close to 2% and barely hangs on to $108K. Ethereum prices are down twice as much as they barely hang on to $3,700.
With just two months left in the year, over the weekend, we looked at asset class performance, country performance, and individual stock performance for October and various other time periods. Make sure to take a look at that rundown of where things stand heading into year-end. Even though the major averages may be looking good, not everything looks great.
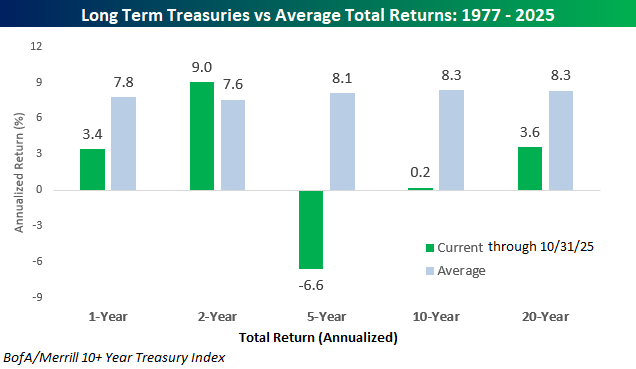
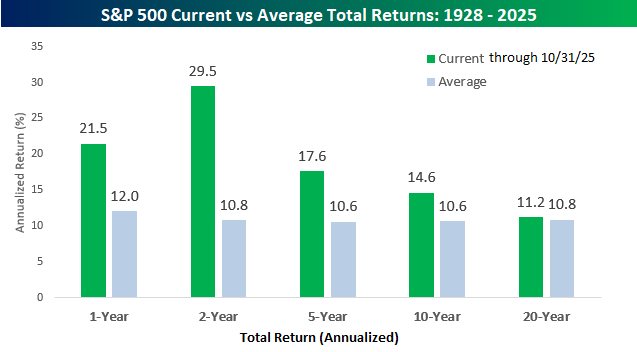
Taking a high-level look at equity market returns, whether you’re looking at the short-term or long-term, it has been a friendly environment. Over the last year, the S&P 500’s total return has been a gain of 21.5% which is nearly twice the historical average of 12.0%, but over the last two years, the 29.5% annualized gain has been nearly triple the long-term average. Looking out over longer-term time periods, though, over the last five, ten, and twenty years, returns aren’t as strong, but they’re still above the long-term average.
While equity market investors have been on a highway paved in green, the treasury market has been a world of pain. Over the last year, long-term treasuries, as measured by the BofA/Merrill 10+ Year Treasury Index, have posted positive returns, but at 3.4% it’s still less than half of the long-term average. Over the last two years, the annualized gain of 9.0% is actually slightly above average. Still, looking back further than that, it’s been a painful five, ten and twenty years for anyone who has loaned money to the US Treasury.