May 5, 2026
Bespoke’s Conference Call Recaps use AI to summarize lengthy earnings calls. The commentary below is AI-generated and then edited by Bespoke for quality control. As always, none of these summaries should be construed as recommendations to buy or sell any securities, and investors should do their own research and/or consult with a financial professional before making any investment decisions.
Our latest recap available to Bespoke subscribers covers Shopify’s (SHOP) Q1 2026 earnings call.

Shopify (SHOP) is a commerce platform that allows businesses of all sizes to build, manage, and scale online and offline retail, handling everything from storefronts and payments to logistics and marketing. It’s essentially the backbone of a huge chunk of internet commerce. Shopify put up another big quarter with GMV hitting $101B (+35%) and revenue up 34% to $3.2B. The biggest theme on the call was AI. Management made it clear this isn’t theoretical anymore, with AI writing over half of Shopify’s code and tools like Sidekick seeing 4x usage growth as merchants use it to automate tasks and build apps. Early signs from AI-driven shopping are notable, with traffic to Shopify stores up 8x and orders up nearly 13x, suggesting platforms like ChatGPT and Google AI could become real demand drivers as AI search channels. Enterprise momentum is building as large retailers ditch legacy systems, while international growth remains strong (Europe GMV +48%). Payments continues to scale, and management sees AI lowering the barrier to starting businesses, keeping the pipeline of new merchants strong. Despite better-than-expected results, guidance came up short of what analysts were looking for, sending shares down as much as 14% on 5/5…
Continue reading our Conference Call Recap for SHOP by becoming a Bespoke Institutional subscriber. You can sign up for Bespoke Institutional now and receive a 14-day trial to read our newest Conference Call Recap. To sign up, choose either the monthly or annual checkout link below:
Bespoke Institutional – Monthly Payment Plan
Bespoke Institutional – Annual Payment Plan
May 5, 2026
See what’s driving market performance around the world in today’s Morning Lineup. Bespoke’s Morning Lineup is the best way to start your trading day. Read it now by starting a two-week trial to Bespoke Premium. CLICK HERE to learn more and start your trial.
“If you don’t use your experience, your past is wasted” – Alan Shepard

Below is a snippet of commentary from today’s Morning Lineup. Start a two-week trial to Bespoke Premium to view the full report.
Yields are behaving themselves this morning as the 10-year US Treasury yield is unchanged at around 4.44%, and near the highest levels since last summer.
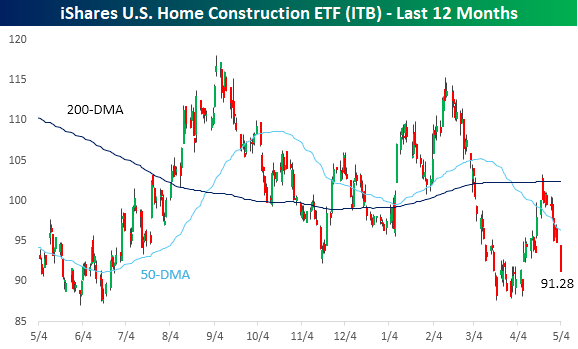
While rising yields haven’t had much of an impact on the overall equity market yet, the same can’t be said for homebuilders. In early February, the iShares US Home Construction ETF (ITB) was near 52-week highs and above $115. Yesterday, it closed at $91.28, or more than 20% below those levels from two months ago. While the S&P 500 is up over 13% from its March lows, ITB has only rallied 3%.
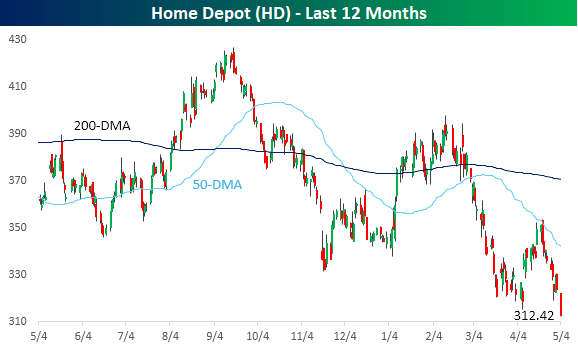
Rising yields have been more painful for housing-related stocks. Home Depot (HD) is a perfect example. Yesterday, the world’s largest home improvement retailer closed at a 52-week low of $312.42. The stock is down over 20% from its February high and over 26% from its 52-week high.
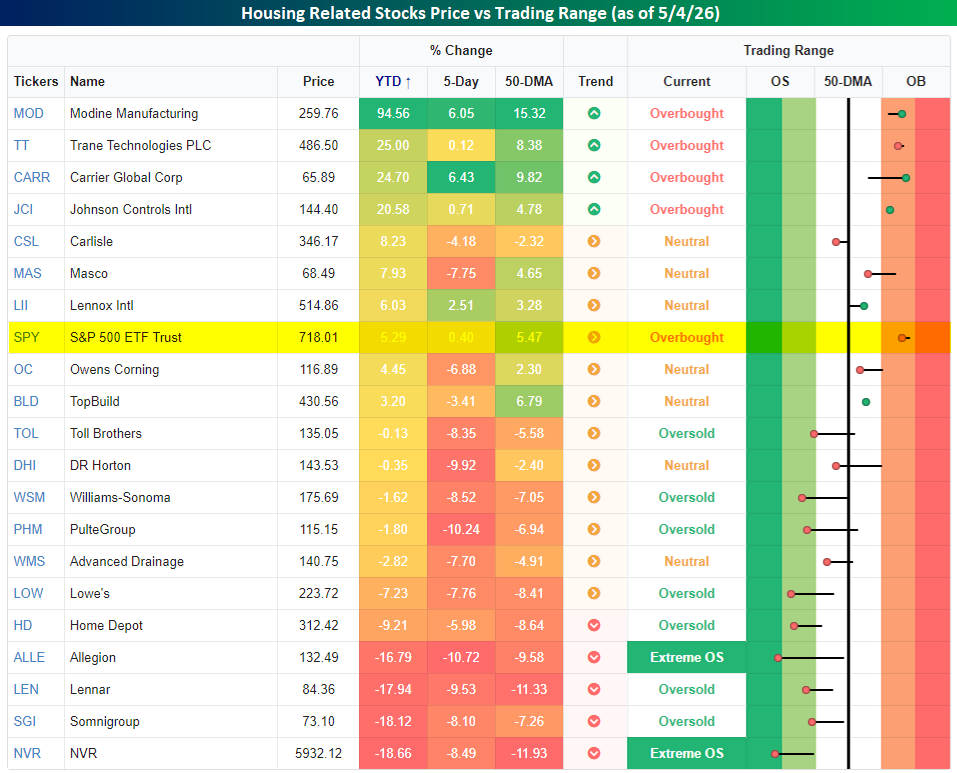
Looking more broadly at housing-related stocks. The snapshot below from our Trend Analyzer shows the 20 largest components in the SPDR S&P Homebuilders ETF (XHB), and the majority are not only underperforming the S&P 500 on a YTD basis, but they’re also down. The last week has been especially painful for the group, as all but six of them are down just as yields have started to spike.
There are some bright spots in terms of performance this year. Stocks like Modine Manufacturing (MOD), Trane Technologies (TT), Carrier Global (CARR), and Johnson Controls (JCI) are all up over 20% YTD, and they’re the only overbought stocks on the list. The rally in these four stocks really has nothing to do with housing, though. They’re all rallying due to the massive demand for cooling in AI data centers.
Turning to the markets this morning, futures are higher with the S&P 500 indicated to open up 0.4% and the Nasdaq rallies 0.6%. As mentioned above, yields have been behaved with the 10-year right around yesterday’s close of 4.44%. Oil prices are giving back some of yesterday’s gains, falling over 2% to just under $104 per barrel in WTI. Lastly, gold prices are up about 1%, while Bitcoin is up over 1% and back above $81K.
In Asia overnight, Japan, China, and South Korea were closed, while Hong Kong dropped 0.8%. In Europe, markets are all open and generally higher. The STOXX 600 is up 0.5%, led higher by Spain (1.35%) and Germany (1.0%). The UK is the main laggard, falling 1.3%.
In the US today, we’ll get service sector PMIs from S&P and ISM, along with New Home Sales and JOLTS.
Start a two-week trial to Bespoke Premium to continue reading today’s full Morning Lineup.
May 4, 2026
See what’s driving market performance around the world in today’s Morning Lineup. Bespoke’s Morning Lineup is the best way to start your trading day. Read it now by starting a two-week trial to Bespoke Premium. CLICK HERE to learn more and start your trial.
“Nothing is impossible, the word itself says ‘I’m possible’!” – Audrey Hepburn
Below is a snippet of commentary from today’s Morning Lineup. Start a two-week trial to Bespoke Premium to view the full report.
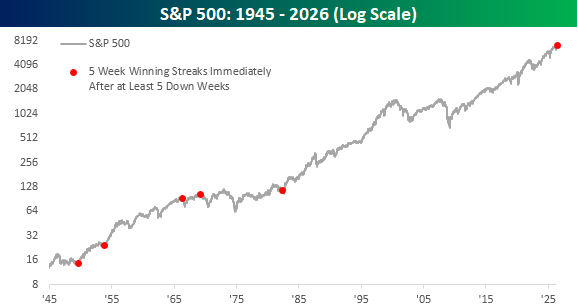
16-year-old, meet market. If you think the life of a 16-year-old is an emotional roller-coaster where ‘life isn’t fair’ turns into ‘top of the world’ on a dime, the market has been doing a stellar impression lately. From the end of February right through all of March, the S&P 500 declined for five straight weeks. Once March ended, though, the pendulum swung completely in the opposite direction with five straight weeks of gains. There hasn’t been any in between.
It has been very uncommon for the S&P 500 to experience at least five weekly declines followed by at least five weekly gains. Since WWII, there have been 32 other losing streaks of at least five weeks, and there have been 120 streaks of at least five-week gains. However, there have only been five other periods when a five-week winning streak came immediately after a streak of at least five weeks of losses. The last one was way back in 1982, so the teenagers out there (and maybe even their parents) won’t remember that one.
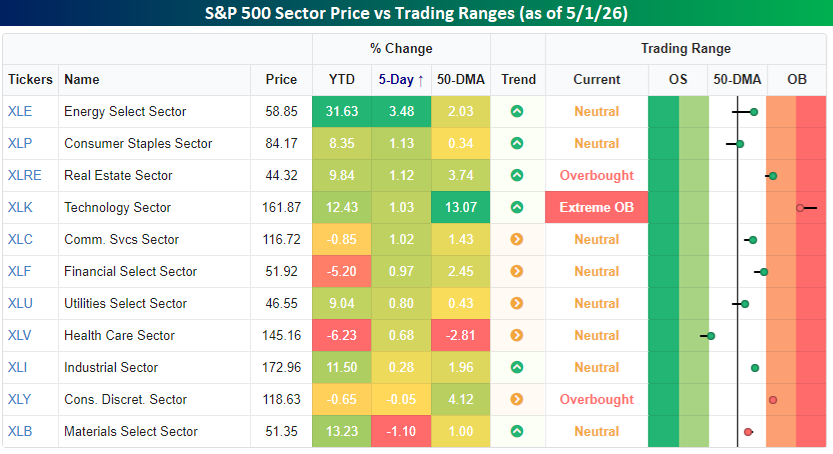
Last week also saw a notable shift in a pattern that has been prevalent ever since the war started. For the last nine weeks, it seemed as though whatever was good for oil prices and the energy sector was bad for all other stocks and vice versa. Last week, though, Energy was the top-performing sector, gaining 3.48%, but the only other stocks to finish the week lower were Materials (-1.10%) and Consumer Discretionary (-0.05%). In fact, four other sectors rallied more than 1%, including Technology (1.03%) and Communication Services (1.02%). The market won’t be able to ignore rising energy prices in perpetuity, but it is a welcome respite.
It’s been a volatile morning for equity futures as conflicting headlines from the Middle East caused a sharp pullback in futures earlier this morning. Reports that Iran fired on a US ship erased earlier gains in equities and a sharp increase in oil prices. US officials have refuted the reports, though, and we’ve reclaimed a decent amount of the earlier losses, and the S&P 500 is now just down 0.2% while the Nasdaq is flat.
In Asia, Japan and China were closed for a holiday, but South Korea surged over 5% while Hong Kong rallied 1.2%. Manufacturing PMIs for both South Korea and Singapore both expanded more than expected.
European stocks returned from last Friday’s holiday with losses. The STOXX 600 is down over 0.5%, led lower by Spain, which is down over 1% while France and Italy are both underperforming. Like Asia, Manufacturing PMIs for countries in the region have generally been stronger than expected.
Looking ahead to the US today, the only economic report on the calendar is Factory Orders at 10 AM. NY Fed President Williams will be speaking at the Yale Club just before 1 PM, and after the bell, Palantir (PLTR) will report Q1 earnings.
Start a two-week trial to Bespoke Premium to continue reading today’s full Morning Lineup.
May 1, 2026
To read our weekly Bespoke Report newsletter and access everything else Bespoke’s research platform offers, start a two-week trial to Bespoke Premium. This week, we are sending out our Global Macro Update deck instead of our traditional Bespoke Report. This report is filled with dozens of charts reviewing the current state of the global economy and where it’s headed next. Our two biggest areas of focus are the AI boom and the war in Iran. We discuss a range of trade ideas based on those two themes as well as the outlook for the global economy writ large and the Federal Reserve going forward. Give it a read!

May 1, 2026
Bespoke’s Conference Call Recaps use AI to summarize lengthy earnings calls. The commentary below is AI-generated and then edited by Bespoke for quality control. As always, none of these summaries should be construed as recommendations to buy or sell any securities, and investors should do their own research and/or consult with a financial professional before making any investment decisions.
Our latest recap available to Bespoke subscribers covers Alphabet’s (GOOGL) Q1 2026 earnings call.

Alphabet (GOOGL) runs one of the world’s most influential digital ecosystems, spanning Search, YouTube, Android, Chrome, and Google Cloud, along with a growing portfolio of AI models and infrastructure. Search grew 19% as AI Overviews and AI Mode drove higher usage and more complex queries, while also opening new ad opportunities. Cloud revenue grew 63% past $20B, with backlog nearly doubling to $460B, fueled by enterprise demand for Gemini models and infrastructure. That demand is so strong that compute constraints are limiting growth, pushing CapEx to $35.7B in the quarter. Ads are evolving with better targeting and early agentic commerce tests, while YouTube continues to benefit from TV viewing and subscription growth. The company is also monetizing its infrastructure edge, including selling TPUs externally, and strengthening its enterprise pitch with the Wiz cybersecurity acquisition. Shares rose 10% on 5/1 in reaction to strong EPS and revenue results versus estimates…
Continue reading our Conference Call Recap for GOOGL by becoming a Bespoke Institutional subscriber. You can sign up for Bespoke Institutional now and receive a 14-day trial to read our newest Conference Call Recap. To sign up, choose either the monthly or annual checkout link below:
Bespoke Institutional – Monthly Payment Plan
Bespoke Institutional – Annual Payment Plan
May 1, 2026
Bespoke’s Conference Call Recaps use AI to summarize lengthy earnings calls. The commentary below is AI-generated and then edited by Bespoke for quality control. As always, none of these summaries should be construed as recommendations to buy or sell any securities, and investors should do their own research and/or consult with a financial professional before making any investment decisions.
Our latest recap available to Bespoke subscribers covers Caterpillar’s (CAT) Q1 2026 earnings call.

Caterpillar (CAT) makes the heavy equipment and engines that keep the physical economy running. Think excavators for construction, trucks for mining, and large engines that power oil fields and data centers. Caterpillar put up a strong quarter with sales up 22% to $17.4B and backlog hitting a record $63B, largely driven by a surge in demand for power equipment tied to data centers. Management is leaning hard into that trend, planning to nearly triple large engine capacity versus 2024 as orders stretch years into the future. North America construction remains steady thanks to infrastructure spending and non-residential work, while mining is improving on stronger demand for copper and gold and an aging equipment base. Tariffs are still a drag (now expected at $2.2B–$2.4B this year), but came in lighter than expected this quarter. On better-than-expected results, CAT shares rallied almost 10% on 4/30…
Continue reading our Conference Call Recap for CAT by becoming a Bespoke Institutional subscriber. You can sign up for Bespoke Institutional now and receive a 14-day trial to read our newest Conference Call Recap. To sign up, choose either the monthly or annual checkout link below:
Bespoke Institutional – Monthly Payment Plan
Bespoke Institutional – Annual Payment Plan