Mar 20, 2026
See what’s driving market performance around the world in today’s Morning Lineup. Bespoke’s Morning Lineup is the best way to start your trading day. Read it now by starting a two-week trial to Bespoke Premium. CLICK HERE to learn more and start your trial.
“The longest way must have its close – the gloomiest night will wear on to a morning.” ― Harriet Beecher Stowe

Below is a snippet of commentary from today’s Morning Lineup. Start a two-week trial to Bespoke Premium to view the full report.
A negative week is on pace to finish with a negative session as the S&P 500 looks to finish lower for the fourth week in a row and the sixth down week in the last seven. S&P 500 and Nasdaq futures are both down about 0.5% but off their overnight lows. Where we close, though, will depend almost entirely on the price of oil, which is down 1% to $95.15 per barrel. Treasury yields are modestly higher, with the 10-year yield just under 4.3%, while gold is up 1.3% and Bitcoin is holding above $70K.
In Asia overnight, most major equity indices in the region were lower, although the KOSPI rallied 0.3% to finish up 5.4% for the week. In Europe, we’re seeing more muted performance to close out the week. The STOXX 600 is down 0.1%, which would put it down more than 2% for the week, but Spain has bucked the negative trend, rallying 1% today and putting it into positive territory for the week.
There’s no economic or major earnings data on the calendar today, so geopolitical headlines will dictate the market’s performance.
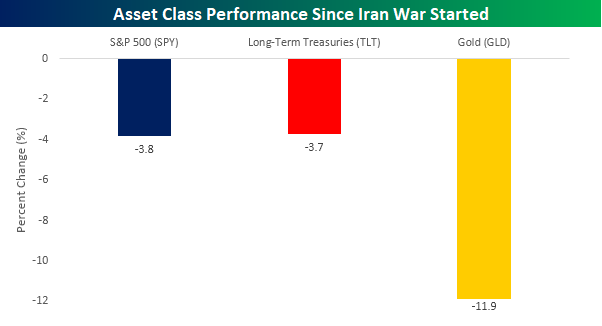
Heading into today’s session, the S&P 500 is down nearly 4% this month, which is unsurprising given the war in the Middle East. It’s only natural in times of geopolitical uncertainty for investors to move out of riskier assets into the safety of treasuries or even gold, the ultimate port in geopolitical storms. So, how are those two asset classes doing this month? Long-term treasuries, as proxied by the iShares 20+ Year Treasury ETF (TLT), are down 3.7%, which is basically in line with the S&P 500, while gold (GLD) is down more than triple either of the other two, with a decline of 11.9%. Just when you think you have it all figured out.
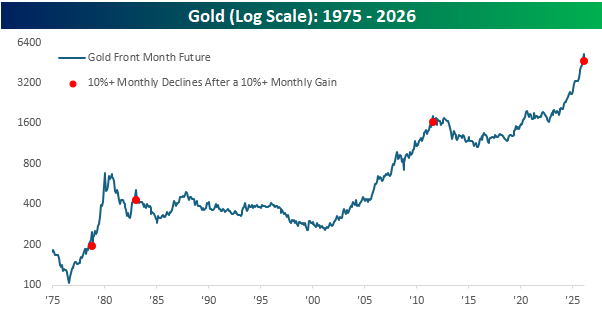
Gold’s double-digit percentage decline this month is on pace for the largest monthly decline in the commodity since June 2013 and, if it holds, would rank as the eighth largest one-month decline in gold since at least 1975. What’s even more interesting is that this month’s decline follows a double-digit percentage gain in February.
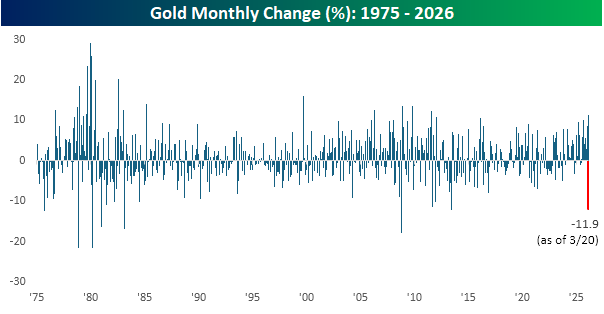
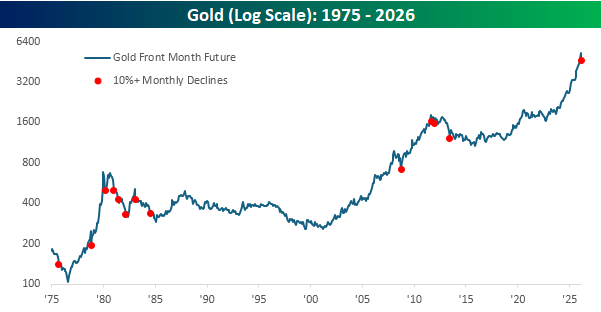
The chart below shows gold’s performance since 1975, and each red dot shows months when it declined 10% or more. Most of these declines occurred either early on or well into longer-term downtrends. There were some exceptions, though. The decline in October 2008 occurred right near the low for that period, and after the decline in November 1978, gold more than tripled over the next year.
Looking at just the periods when gold declined by at least 10% following a double-digit percentage gain. Here, the sample size is much smaller, with just three other occurrences. The two most recent, in 2011 and 1983, were followed by years of weakness, while the one other occurrence in 1978 was the one period where gold quickly tripled.
Mar 19, 2026
Log-in here if you’re a member with access to the Closer.
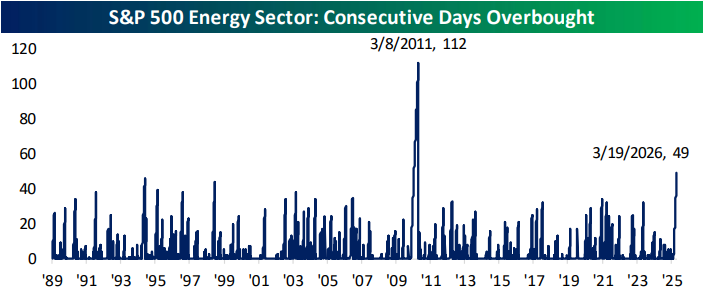
- The Energy sector has now traded in overbought territory for 49 consecutive trading days; the second longest streak of overbought readings on record.
- Intraday, crude oil futures continue to be driven by extreme lurches in positioning and weak liquidity.
- Data from the Federal Reserve’s Flow of Funds report showed that the corporate financing gap remains negative despite the boom in AI investment.
See today’s full post-market Closer and everything else Bespoke publishes by starting a 14-day trial to Bespoke Institutional today!
Mar 19, 2026
See what’s driving market performance around the world in today’s Morning Lineup. Bespoke’s Morning Lineup is the best way to start your trading day. Read it now by starting a two-week trial to Bespoke Premium. CLICK HERE to learn more and start your trial.
“If you don’t understand what the professor is saying, don’t dismiss the possibility that he might be wrong.” – Paul Volcker
Below is a snippet of commentary from today’s Morning Lineup. Start a two-week trial to Bespoke Premium to view the full report.
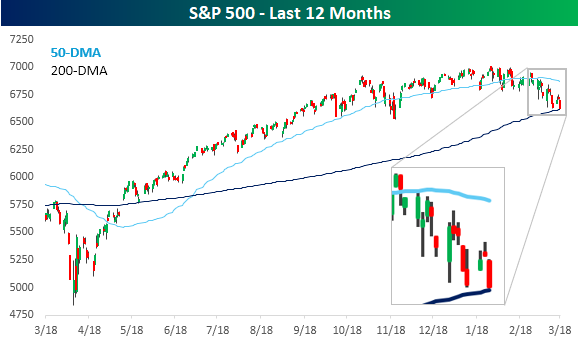
After a relatively strong start to the week, where it looked like the market would be able to look past the spike higher in energy prices, continued tensions in the Middle East and the stubbornly high level of crude oil prices have pushed the S&P 500 back into the red for the week, with further downside in store for today. S&P 500 futures are trading down 0.4%, which would put the S&P 500 below its 200-day moving average (DMA). The Nasdaq, which already closed below its 200-DMA yesterday, is expected to add to that breakdown with a decline of 0.5%.
International markets had a terrible night, with most major averages in the region down at least 2% and in most cases much more. That’s the same trend in Europe as well, with the STOXX 600 down over 2%, as is the case with most indices in the region.
As we’ve been pointing out all along, the declines are all about energy prices, and this morning, they’re not helping out as WTI trades up 2% to more than $98 per barrel, while Brent trades up by nearly 7% to $115 per barrel. The spread between Brent and WTI is now a monstrously high $16+ per barrel.
Treasury yields are moving higher as investors fear the inflationary impacts of rising energy prices, and the 10-year yield is now testing 4.3%. Gold prices are plunging more than 5% to under $4,700 per ounce, and Bitcoin is back below $70K.
The economic calendar is relatively busy this morning with jobless claims and Philly Fed at 8:30, while New Home Sales and Wholesale Inventories will hit the tape at 10 AM. Jobless claims came in lower than expected on an initial basis but slightly higher than expected on a continuing basis, while the Philly Fed was actually better than expected. With everything going on in the Middle East, though, the data is basically meaningless.
As the quote of the day notes, in many aspects of life, change has a way of happening slowly and then all at once. For months, the S&P 500 has been trading in a sideways range, consolidating the gains from the April lows. Then, all of the sudden we have a day like yesterday where the S&P 500 sells off a not necessarily dramatic 1.4%, but then all of the sudden, we’re looking at an S&P 500 whose 50-day moving average (DMA) has just started to slope downward just as the index is on the verge of trading below its 200-DMA for the first time since last spring. Steady uptrend to sideways range and now a potential downtrend? Change happens slowly until it doesn’t.
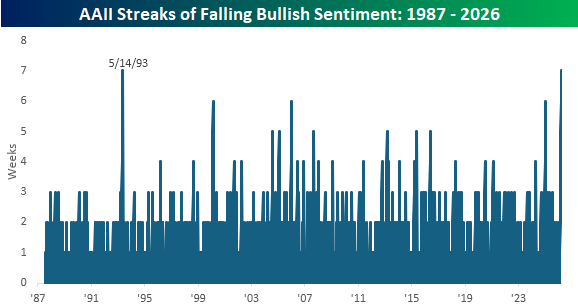
With the S&P 500 slowly (and now more suddenly) trending lower, investor sentiment has also been on the decline. In the latest survey from the American Association of Individual Investors (AAII), bullish sentiment declined from an already low level of 31.9% to 30.4%, which is the lowest level since last September, as the uptrend in sentiment since the lows early last year has been firmly broken.
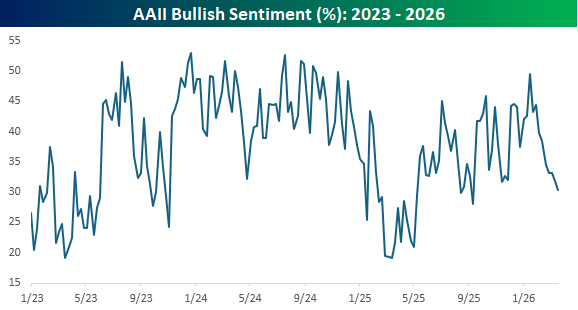
With this week’s decline, bullish sentiment has now declined for a record seven straight weeks. That’s now tied with the seven-week streak from May 1993 for the longest weekly losing streak in the survey’s history. Behind these two streaks, there were three others (Feb 2000, Jan 06, and Jan 2025) that lasted six weeks. Based on how the market traded yesterday, if we don’t see an improvement in the next couple of days, we would expect that this current streak could move into first place all on its own.
Mar 18, 2026
Log-in here if you’re a member with access to the Closer.
- Today’s Federal Reserve policy statement contained no material surprises and Fed Chair Powell’s presser was also mostly unremarkable.
- DRAM/NAND memory producer Micron (MU) blew the doors off earnings with revenues 21% above estimates and triple what they were a year ago.
- The latest PPI release showed that costs were broadly accelerating even before the recent leap in gasoline and diesel prices.
See today’s full post-market Closer and everything else Bespoke publishes by starting a 14-day trial to Bespoke Institutional today!
Mar 18, 2026
Bespoke’s Conference Call Recaps use AI to summarize lengthy earnings calls. The commentary below is AI-generated and then edited by Bespoke for quality control. As always, none of these summaries should be construed as recommendations to buy or sell any securities, and investors should do their own research and/or consult with a financial professional before making any investment decisions.
Our latest recap available to Bespoke subscribers covers Williams-Sonoma’s (WSM) Q4 2025 earnings call.

Williams-Sonoma (WSM) is a premium home furnishings retailer operating a multi-brand portfolio including Pottery Barn, West Elm, and Williams-Sonoma, selling furniture, décor, kitchenware, and design services through a digital-first, omnichannel model. WSM delivered a 3.2% Q4 comp and 20.3% operating margin despite tariff headwinds and weak housing turnover, gaining share while maintaining full-price selling. Management emphasized resilience to tariffs through sourcing and pricing actions, with margin pressure expected to be front-half weighted in 2026. Growth is being driven by product newness, collaborations, and emerging brands, while B2B (+10% FY growth) and Rejuvenation remain key white-space opportunities. The company is pivoting back to retail expansion (20 new stores, 19 repositions) after years of optimization. Pottery Barn lagged in Q4 due to weak décor assortment, but is being reset with stronger product and brand positioning. WSM reported weaker revenue on better-than-expected EPS, resulting in shares up as much as 6% on 3/18…
Continue reading our Conference Call Recap for WSM by becoming a Bespoke Institutional subscriber. You can sign up for Bespoke Institutional now and receive a 14-day trial to read our newest Conference Call Recap. To sign up, choose either the monthly or annual checkout link below:
Bespoke Institutional – Monthly Payment Plan
Bespoke Institutional – Annual Payment Plan
Mar 18, 2026
See what’s driving market performance around the world in today’s Morning Lineup. Bespoke’s Morning Lineup is the best way to start your trading day. Read it now by starting a two-week trial to Bespoke Premium. CLICK HERE to learn more and start your trial.
“If you don’t understand what the professor is saying, don’t dismiss the possibility that he might be wrong.” – Paul Volcker
Below is a snippet of commentary from today’s Morning Lineup. Start a two-week trial to Bespoke Premium to view the full report.
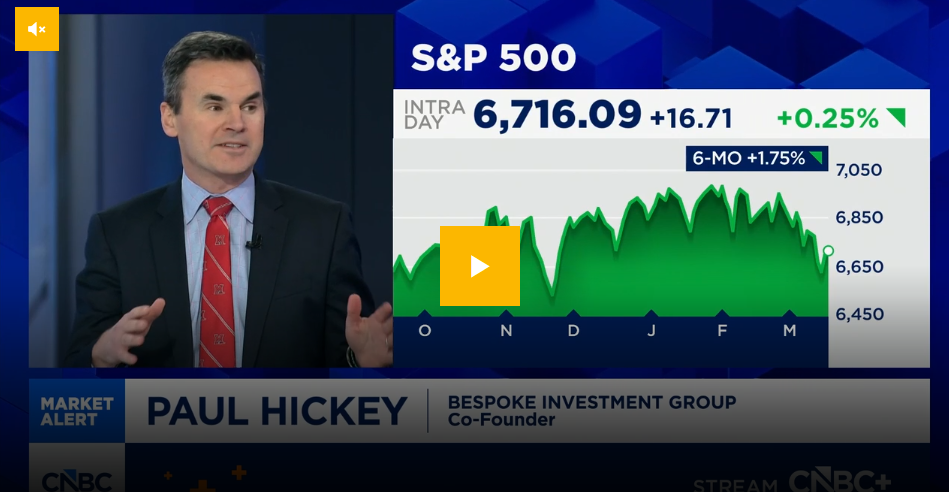
Paul Hickey appeared on CNBC Overtime yesterday to discuss the sideways trending market and volatility underneath the surface. To view the segment, click on the image below.
Futures are still green, but they have given up most of their earlier gains as we approach the opening bell. It appears some of the weakness may be tied to reports of a strike on some Iranian energy facilities. Conversely, oil prices are lower but have erased most of their earlier losses. Treasury yields are basically unchanged, gold is down close to 2%, while Bitcoin is down over 2% and back below $73K.
Equities in Asia had a very strong session overnight, with the Nikkei up 2.9%, while South Korea surged 5.0%. Other major indices in the region were also green but by less than 1%. Catalysts behind the move include a lack of continued upside in oil prices, stronger-than-expected export orders in Japan, and positive comments from Samsung related to AI chip demand being strong.
European stocks have also started the day on a positive note, with the STOXX 600 up 0.6%, led higher by Spain, Italy, and France, which are all up over 1%. Besides lower oil prices, February CPI also rose less than expected (0.6% vs 0.7%). Tomorrow, we’ll also get policy decisions from the ECB, BoE, and SNB.
The economic calendar is busy this morning with PPI at 8:30, followed by Factory Orders and Durable Goods at 10 AM Eastern. After that, attention will shift to the FOMC, where Powell & Co are widely expected to leave rates unchanged at 2 PM. Investors will be focused on the press conference and summary of economic projections, but with all the uncertainty around oil supplies, take them with a grain of salt. The PPI just hit the tape and the numbers were much higher than expected, so that has pushed futures into negative territory.
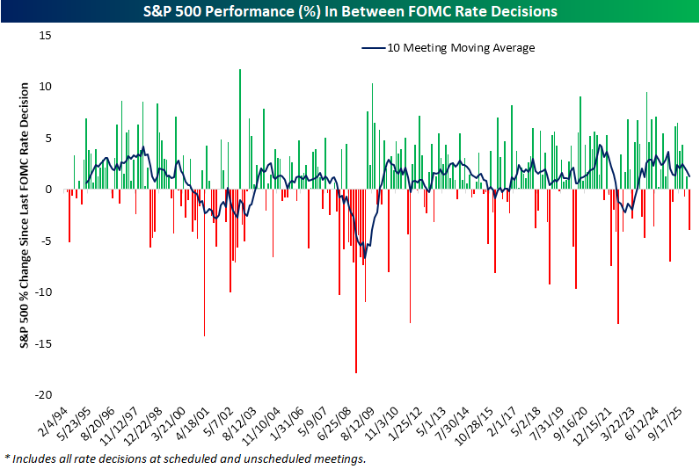
In our FOMC meeting preview report sent out yesterday, we highlighted some of the key trends surrounding Fed days. The report included an overview of the market’s performance leading up to meetings and how it performs on the day of the announcement, how the market performs based on what the FOMC does (or doesn’t do), as well as how it performs on an intraday basis based on different scenarios.
One of the charts included showed the performance of the S&P 500 between FOMC meetings, and heading into today’s announcement, the S&P 500 is down about 4% since its last meeting in January. As shown, that ranks as the worst inter-meeting performance in a year and also ranks in the 15th percentile of all inter-meeting periods since 1994, when the Fed first started announcing its rate decisions on the day of its meetings. It gets worse than the last six weeks, but not much worse!
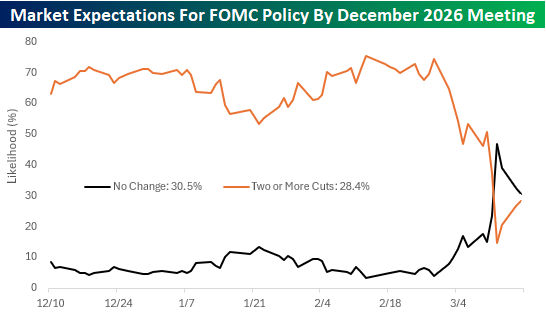
The market is currently pricing in a greater than 99% likelihood of no change in rates by the Fed today, and with the war in Iran taking center stage, there is not likely to be nearly as much attention put on Powell’s penultimate press conference this afternoon. When it comes to policy, though, there have been some major shifts in market expectations for policy between now and the last meeting for 2026 in December.
The chart below shows the change in expectations for various policy levels since the Fed last cut rates in December. While the market is currently pricing in an almost one in three chance of no change in rates between now and December, less than three weeks ago, the market was pricing in a less than 5% chance of no change in rates. Instead, the odds were heavily on cuts with a 41% chance of two cuts, a 29% chance of three cuts, a 15% chance of four cuts, and just a 17% chance of only one cut. Today, the trend has completely reversed. There’s now a greater than 70% likelihood of one cut or less, and barely more than a one in four chance of two or more cuts.
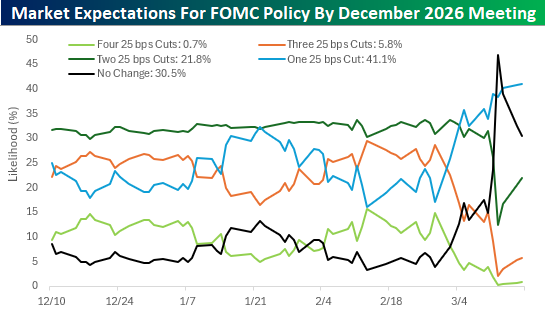
To show the shift more clearly, the chart below shows the change in market pricing for no change in rates versus two or more cuts. For three months, market expectations were pretty steady, but then that quickly changed at the end of February with one word – Iran.