Chart of the Day: Drudge Headline Indicator
This content is for members onlyChart of the Day: Earnings and Revenue Beat Rates
In today’s Chart of the Day sent to paid subscribers, we focus on the earnings and revenue “beat rates” for companies that have reported their Q2 numbers so far this season. Were analysts too bullish or bearish on earnings coming into this reporting period, and what impact might that have on the market? Sign up for a free Bespoke research trial below to view today’s Chart of the Day.
Chart of the Day: VIX Below 12
The VIX Volatility index, otherwise known as the “fear gauge,” closed below 12 yesterday for the first time in just over a year. Below is a chart of the VIX going back to 1990, with green shading denoting sub-12 levels.

In today’s Chart of the Day sent to paid subscribers, we analyzed historically low readings for the VIX and how the equity market typically performs during these periods and beyond. Sign up for a free Bespoke research trial below to view today’s Chart of the Day.
Chart of the Day – Earnings Declines vs Market Returns
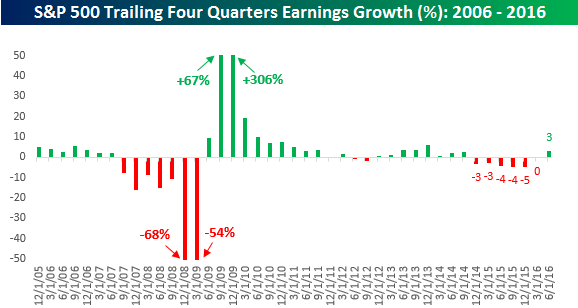 On a trailing one-year basis, as reported earnings for the S&P 500 have declined for six straight quarters, which is the longest streak since the Financial Crisis. Based on where analyst estimates currently stand, the S&P 500 is set to break that streak in the coming quarter.
In today’s Chart of the Day sent to paid subscribers, we looked at prior periods where the S&P 500 saw at least four quarters of earnings declines on a trailing one year basis, and then calculated the S&P 500’s performance during the streak and after. Sign up below for a free trial today to view.
Chart of the Day – GOP Convention Starts Off Election Season
The GOP convention is under way in Cleveland, so we took the time to look through historical stock market returns following conventions, with a specific focus on which party goes first in a given year. The table below shows which party went first, the date of the convention, and the election day that followed, with the number of trading days between.
In today’s Chart of the Day sent to paid subscribers, the full table is included along with charts of the S&P 500 for each year divided into years when each party went first. Sign up below for a free trial today to view.