Chart of the Day – S&P 500 Strong Mornings
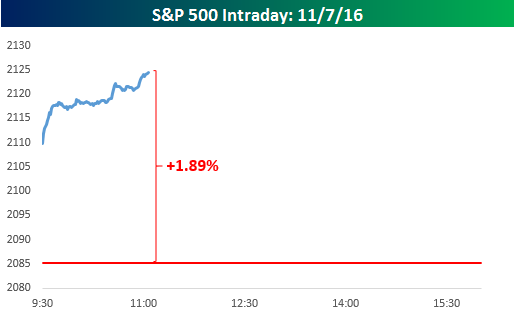 The S&P 500 opened up strong and has built on those gains so far this morning. After gapping up over 1% at the open, the S&P 500 is currently trading up just under 2%% after the 90 minute mark. Since the S&P 500 first crossed 2,000 to the upside in the summer of 2014 and around the time when this long period of consolidation began there have been 36 prior days where the S&P 500 was up over 1% at 11 AM with 14 of those prior occurrences coming in 2016.
In today’s Chart of the Day, we looked at how the S&P 500 performed for the remainder of the day as well as the day and week after each of these prior occurrences. You can see today’s Chart of the Day by starting a 14-day free trial to Bespoke’s premium research below, and if you decide that the service isn’t for you, there is no obligation whatsoever.
Chart of the Day – Big Move In Our Market Timing Model
This content is for members onlyChart of the Day – Does it Pay to Wait?
This content is for members onlyChart of the Day – Last Hour Misery in October
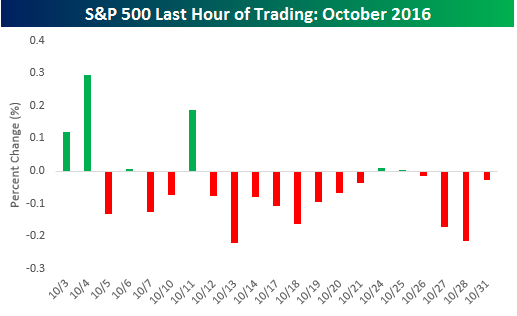 If you are a bull and aren’t an early riser, October wasn’t the month for you. As shown in the chart to the right, of the 21 trading days in the month, the S&P 500 was up in the last hour of trading just six times. Even worse, in the last 14 trading days of October, the S&P 500 traded up in the last hour of trading just twice, and the best it could muster in those two days was a gain of 0.009%! Using our S&P 500 Intraday Database, we looked to see how October 2016 stacks up against other months going back to 1983 and found the lack of upside momentum in the last hour of trading was one of the weakest we have seen of any month since 1983.
In today’s Chart of the Day, we looked at other months where the S&P 500 saw such a preponderance of days where the S&P 500 was down in the last hour of trading and calculated how the overall market performed going forward. See today’s Chart of the Day by starting a 14-day free trial to Bespoke’s premium research below.