Chart of the Day: Kennametal (KMT)
This content is for members onlyChart of the Day – S&P 500 Intra-Month Performance in April
This content is for members onlyChart of the Day: Rupee Ripping
This content is for members onlyChart of the Day: Smart Money Checkup
The “Smart Money Indicator” suggests that the “smart money” trades at the end of the trading day once all of the day’s events have shaken out, while the “dumb money” trades at or near the open in reaction to the day’s news. We like to track the intraday action of the market over time. While we’re not totally on board with the “Smart Money” theory, we do like to see the market finishing the trading day strong. Buying in the final hour or two of the trading day means investors are comfortable owning shares overnight. A market that opens up strong and then drifts lower throughout the trading day is one we’d prefer to avoid.
Below is a chart showing the average intraday pattern that the S&P 500 took from the close on Election Day 2016 (11/8/16) through the index’s last all-time closing high made on March 1st. This was a period where the market experienced a major move higher, and aside from slight pullbacks from 10 AM to 11 AM ET and 2PM to 2:30 PM, investors were buying, buying, buying all day long. The buying was especially strong in the final hour of trading, which suggests institutional investors were rushing to put money to work. The post-election move through the end of February was a massive buying event that brought quite a bit of new money into the market.
So how has the intraday pattern looked since the market peaked on March 1st? Have investors been selling into the close or stepping in to “buy-the-dip” late in the day? In today’s Chart of the Day (available to all paid clients), we answer these two questions and provide a chart of the S&P’s intraday pattern during the month of March. Start a no-obligation two-week free trial to Bespoke’s research platform to see the report now.
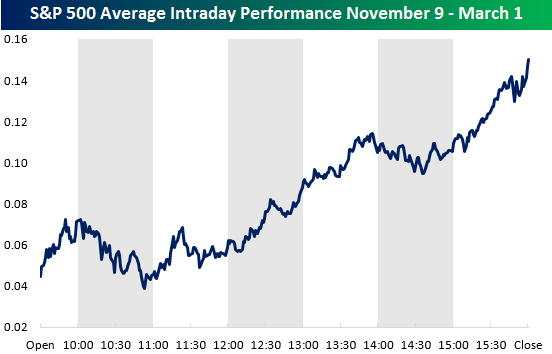
Chart of the Day – Consumer Confidence Blowout
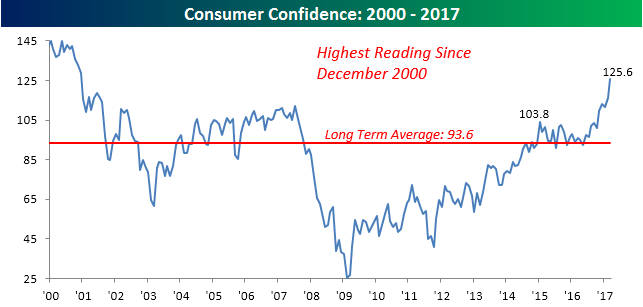
To say that this morning’s Consumer Confidence report was better than expected would be a major understatement. With economists expecting the headline index to fall slightly to 114.0, the actual reading blew the roof off of estimates coming in at 125.6, which was the best reading since December 2000. In terms of how the report came in relative to expectations, today’s report was the fifth biggest beat since at least 1999 and just the seventh time that the actual reading has exceeded expectations by ten or more points.
In today’s Chart of the Day (available to all paid clients), we took a closer look at days where Consumer Confidence exceeded expectations by a large margin to see how the market traded on an intraday basis. Sign up for a free-trial below to check it out!