B.I.G. Tips — A Busy End To The Macro Week Abroad
This content is for members onlyRetail Sales: The Streak Ends
When it comes to the September Retail Sales report, it has historically been one of the worst ones relative to expectations. Based on data from our Economic Indicators Database, the headline reading has only exceeded consensus expectations five times going back to 2001. That’s less than a third of the time! This year was no exception as we saw a big miss relative to expectations on the top line and a similar miss after stripping out Autos and Gas.
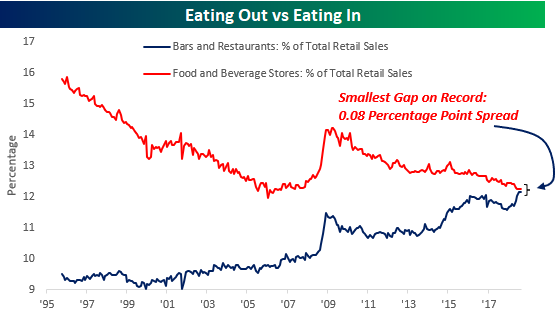
Our monthly update on Retail Sales, always highlights a number of key trends reflecting changing habits of the US consumer. This month’s report was no different. One interesting trend we wanted to highlight was the shift from ‘eating in’ to ‘eating out’. For several years now, we’ve seen Bars and Restaurants increase their share of total sales at the expense of Food and Beverage Stores. As shown in the chart below, though, this shift is on the verge of a major inflection point where Bars and Restaurants will overtake Food and Beverage stores in terms of their total share of retail sales. The house of tomorrow may not have a kitchen!
For anyone with more than a passing interest in the changing behavior of US consumers, make sure to check out this report. To see it, sign up for a monthly Bespoke Premium membership now!
B.I.G. Tips — Nasdaq 100 (QQQ), S&P 500 (SPY) Testing Key Support
This content is for members onlyAugust Employment Report Preview
Heading into Friday’s Non-Farm Payrolls (NFP) report for August, economists are expecting an increase in payrolls of 194K, which would be an increase from July’s weaker than expected reading of 157K. In the private sector, economists are also expecting an increase of 194K. The unemployment rate is expected to tick down to 3.8% from last month’s reading of 3.9%. Average hourly earnings are expected to grow at a rate of 0.2% versus 0.3% last month, so a stronger than expected reading here may not be greeted positively by the market. Finally, average weekly hours are expected to be unchanged at 34.5

Ahead of the report, we just published our eleven-page preview of the July jobs report. This report contains a ton of analysis related to how the equity market has historically reacted to the monthly jobs report, as well as how secondary employment-related indicators we track looked in July. We also include a breakdown of how the initial reading for July typically comes in relative to expectations and how that ranks versus other months.
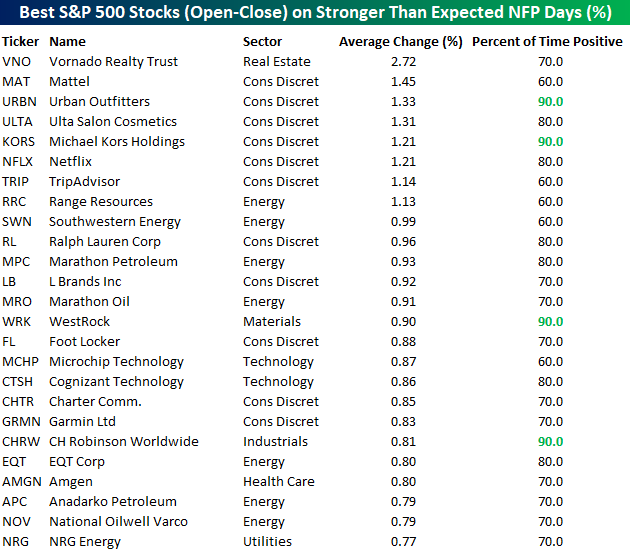
One topic we cover in each month’s report is the S&P 500 stocks that do best and worst from the open to close on the day of the employment report based on whether or not the report comes in stronger or weaker than expected. In other words, which stocks should you buy, and which should you avoid? The table below highlights the best-performing stocks in the S&P 500 from the open to close on days when the Non-Farm Payrolls report has been better than expected over the last two years.
Of the top performing stocks on days when NFP beats expectations, eight sectors are represented, but Consumer Discretionary leads the way with eleven. Vornado (VNO) has been the best performing stock with an average open to close gain of 2.72%, but it is followed by six stocks in the Consumer Discretionary sector which have all gained 1%+ from the open to close. Urban Outfitters (URBN), Michael Kors (KORS), and CH Robinson (CHRW) have all been up 90% of the time.
For anyone with more than a passing interest in how equities are impacted by economic data, this report is a must-read. To see the report, sign up for a monthly Bespoke Premium membership now!