Jan 22, 2016
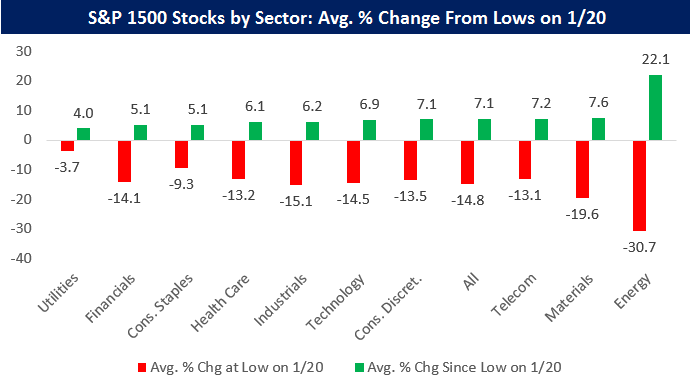
At the lows on Wednesday, the average stock in the S&P 1500 was down 14.8% year-to-date. The average Energy stock was down more than double that at -30.7%!
Since Wednesday’s lows, though, we’ve seen a rip-roaring rally. As you can see in the chart below, the average S&P 1500 stock is up 7% since then, while the average Energy stock is up 22%.
If you’re looking for more color on the bounce we’ve seen over the last two days and whether it has any staying power, subscribe to one of our three subscription services now. If you sign up between now and Sunday, you’ll receive a 20% discount for the life of your membership! Simply choose one of the offerings below to gain access to some of the best research you’ll find anywhere. (Here’s a matrix of the products included with each level of service.)
Newsletter Annual – $316/yr (20% off)
Newsletter Monthly – $39/mo (20% off)
Premium Annual – $795/yr (20% off)
Premium Monthly – $79/mo (20% off)
Institutional Annual – $1595/yr (20% off)
Institutional Monthly – $155/mo (20% off)
Jan 15, 2016
The pain in the US equity market continues apace, but bulls might take some comfort going into the long weekend as the S&P 500 tested and bounced off of its August lows.
If you’re looking for more color on the market’s declines over the last two days, the reasons why, and where we expect things to go from here, start your Bespoke experience with a Bespoke Newsletter membership. We’ve just published our weekly Bespoke Report newsletter that covers everything you need to know about this week’s declines. With a Newsletter membership, you’ll also gain access to our popular 2016 outlook piece. Sign up for just $44/month here. Have a great weekend!
Jan 8, 2016
It wasn’t just a rough week for US equities, it was the roughest opening week for the S&P 500 in the index’s history. In the process, the chart of the S&P 500 and other major averages really broke down during the week with both the Russell 2000 (Small Caps), S&P 400 (Mid Caps) breaking through their lows from 2015. Can it get any worse than this week?
If you’re looking for more color on the market’s declines over the last two days, the reasons why, and where we expect things to go from here, start your Bespoke experience with a Bespoke Newsletter membership. We’ve just published our weekly Bespoke Report newsletter that covers everything you need to know about this week’s declines. With a Newsletter membership, you’ll also gain access to our popular 2016 outlook piece. Sign up for just $44/month here. Have a great weekend!

Dec 18, 2015
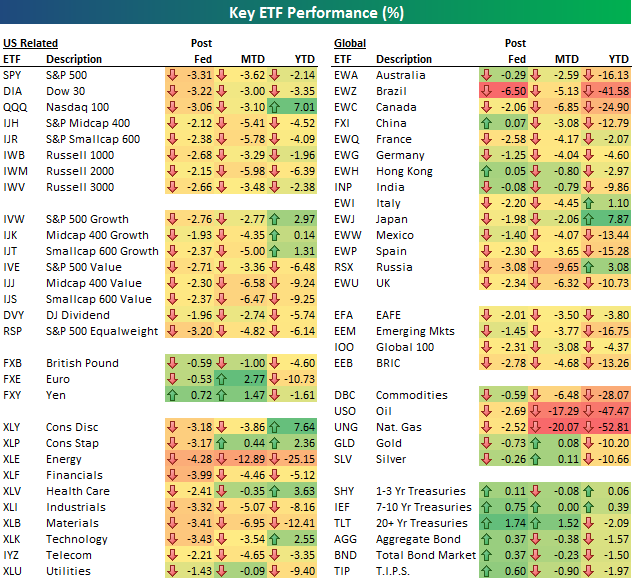
Another rough week for stocks as oil prices continued to plummet and the Fed hiked rates for the first time in seven years.
If you’re looking for more color on the market’s declines over the last two days, the reasons why, and where we expect things to go from here, start your Bespoke experience with a Bespoke Newsletter membership. We’ve just published our weekly Bespoke Report newsletter that covers everything you need to know about this week’s declines. With a Newsletter membership, you’ll also gain access to our popular 2016 outlook piece. Sign up for just $44/month here. Have a great weekend!
Dec 11, 2015
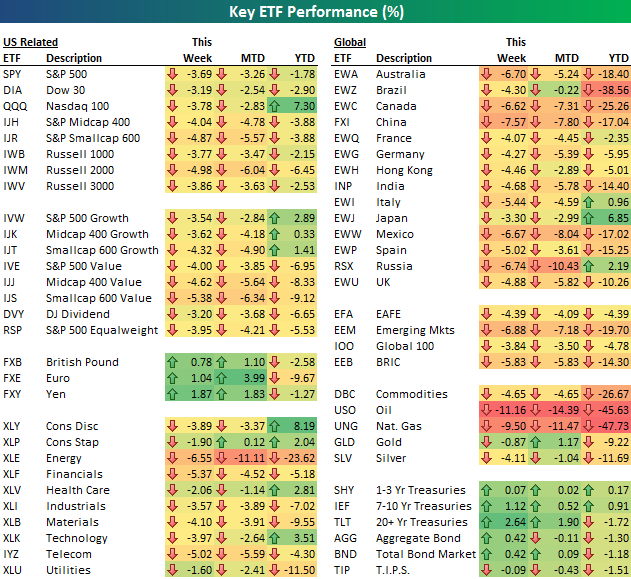
Talk about a rough week for stocks. Check out the carnage across the board in our key ETF matrix below. There weren’t a lot of areas to hide this week, that’s for sure.
If you’re looking for more color on this week’s steep market drop, the reasons why, and where we expect things to go from here, start your Bespoke experience with a Bespoke Newsletter membership. We’ve just published our weekly Bespoke Report newsletter that covers everything you need to know about this week’s declines. You can sign up and get your first month free at this checkout page. Have a great weekend!
Dec 4, 2015
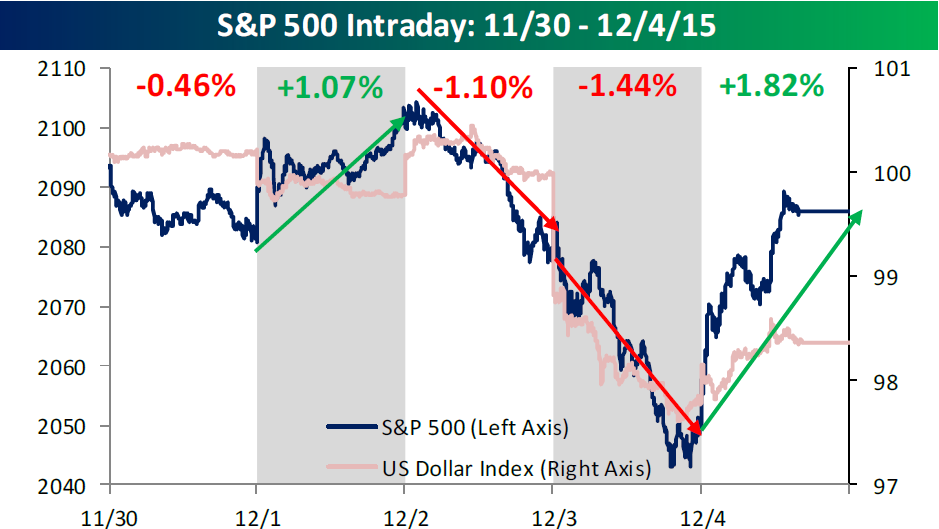
It’s always nice to end the week on a good note with a gain of close to 2% in the S&P 500, even if that 2% gain was still only barely enough to push the index into the black. In what was, by any standards, a volatile week for the equity market, the S&P 500 was whipped around by central bank jawboning and actions that pushed currencies and various asset classes around like a rag doll. After starting off the week with a relatively mild decline of 0.46%, the S&P 500 rallied 1.07% on Tuesday and then gave back all of those gains on Wednesday. On Thursday, ECB President Mario Draghi unveiled additional stimulus measures in the form of lower rates and added QE, but after a big buildup into the event, investors found themselves completely underwhelmed and sold anything they could get their hands on. At the end of the day, the S&P 500 was down 1.44% with a very important jobs report on deck for Friday. Friday’s jobs report came in better than expected, but with a December rate hike already fully priced into the markets, investors reacted positively sending the S&P 500 up 2% for the day and just over one point on the week. You wouldn’t think it, but with four straight daily moves of 1%+ up or down, the S&P 500 hasn’t seen this much day to day volatility since the August lows.
We’ve just published our weekly Bespoke Report newsletter, which is available to all Bespoke Newsletter, Bespoke Premium and Bespoke Institutional subscribers. You can read this week’s Bespoke Report by starting a 14-day free trial to our research services below.
[thrive_leads id=’60014′]