Nov 11, 2016
Sometimes words just can’t do it justice, and while it seems like we have been using that phrase a lot recently, this week is certainly a fitting use of it. After the market rallied for two days to start the week on market expectations of a Clinton victory (or so the market thought) it followed with another two days of gains after Trump staged one of the biggest political upsets in US history. It was a perfect heads bulls wins, tails bears lose scenario!
On Friday things settled down a bit as the bond market was closed in observance of Veterans Day, but there was more than enough action in the week’s first four days to fill a whole month let alone a week. Before we go any further, we would like to extend a big thank you to all of our country’s veterans and their families. Again, words just can’t do it justice on how much you are all appreciated and we know how tough a job it must be.
While everyone is aware of what happened to markets this week, we wanted to quickly recap some of the major moves we saw across asset classes, and also mix in what investors can expect going forward. From there, we will recap the week’s economic data and where things stand with earnings season, and then finally give a brief recap of sentiment and emotions. We’ve all had a busy week, and hopefully this weekend we can all get some rest, because while there were fireworks this week, something tells us that they have only just begun.
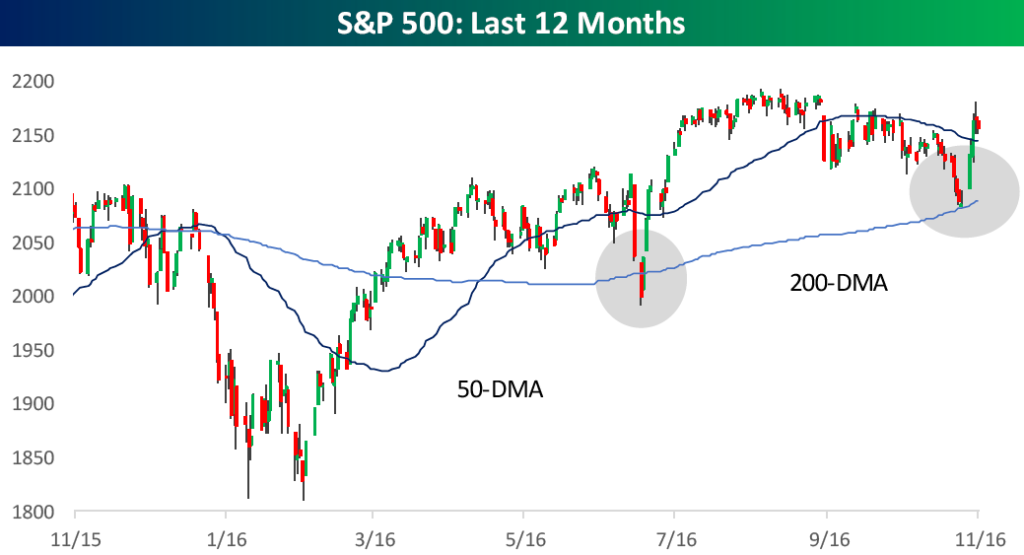
While politics seemingly drove this week’s trading, the seeds of the rally were planted in the technicals. As we pointed out in last week’s report, in the sell-off that lasted through one week ago, the S&P closed last Friday right above its 200-DMA. Then on Monday, the S&P 500 bounced and hasn’t looked back. As long time Bespoke clients are aware, we realize that while every different approach to investing has its flaws, they also have their strengths that should be tracked and studied. In terms of technicals, if you are going to focus on anything, you should always be aware of a security’s or asset class’ long-term moving averages. This week’s bounce was actually the second time in six months that the S&P 500 successfully bounced right at or around its rising 200-DMA.
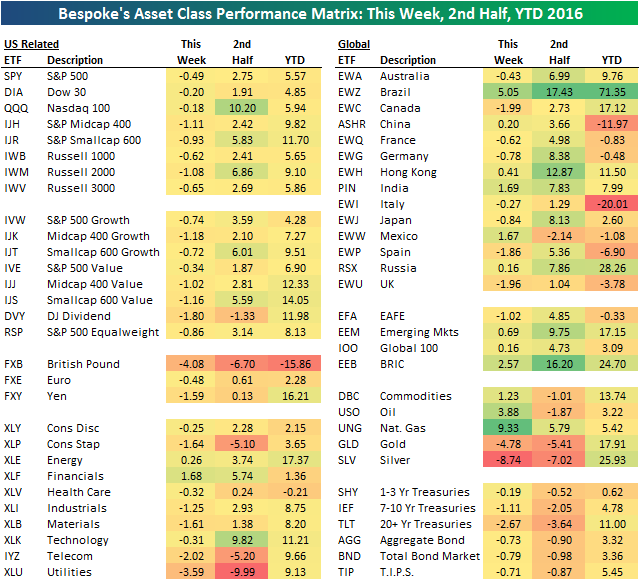
If you’d like to see the rest of this week’s 40-page report covering the election and possible implications going forward, we cover it and much more in this week’s Bespoke Report newsletter, which we just sent to Bespoke subscribers. You can try out Bespoke’s subscription platform and read this week’s Bespoke Report by starting a 14-day free trial. Below is a look at recent asset class performance using our key ETF matrix.
Have a great weekend!
Nov 4, 2016
The S&P 500 finished the last full week before Election Day on a nine-day losing streak. Talk about election anxiety. There have only been 12 prior nine-day losing streaks for the S&P 500 throughout its history going back to 1928, and the last one was 36 years ago in 1980! If you’d like to see how the market has traded in the days and weeks following these epic losing streaks, we cover it and much more in this week’s Bespoke Report newsletter, which we just sent to Bespoke subscribers. You can try out Bespoke’s subscription platform and read this week’s Bespoke Report by starting a 14-day free trial. Below is a look at recent asset class performance using our key ETF matrix.
Have a great weekend!
Oct 21, 2016
Halloween is still more than a week away, but financial assets put their zombie costumes on early this year, as major equity averages and other asset classes meander around awkwardly and aimlessly. The S&P 500 traded to an all-time high more than two-months ago in mid-August and then quickly went catatonic, trading in a range of less than three percentage points. Eight years ago, in 2008, the S&P 500’s average daily move was 3% per day on its way to a peak of 4% that December. These days we can’t even get 3% in two months. Looking at the charts of the major US equity benchmarks, it is a similar picture. The DJIA, Nasdaq, and Russell 2000 are all hanging around right near their August highs, pinned between their 50 and 200-day moving averages.
In our just-published Bespoke Report newsletter, we analyze this week’s action, including economic data, earnings, and sentiment. You can read the entire report by starting a 14-day free trial to our paid content.

Have a great weekend!
Oct 14, 2016
US equity markets finished the week solidly in the red, led lower by small-caps and biotechs. The Russell 2,000 small-cap ETF (IWM) fell 1.95% on the week, putting it down 3% for the quarter already. Even still, IWM is up 6.93% year-to-date, which is more than 200 basis points better than the S&P 500’s (SPY) change.
You can view the recent performance of all asset classes in our key ETF matrix below.
We analyze this week’s action, the Fed, economic indicators, sentiment and more in this week’s Bespoke Report newsletter. You can read the entire report by starting a 14-day free trial to our paid content.

Have a great weekend!
Oct 7, 2016
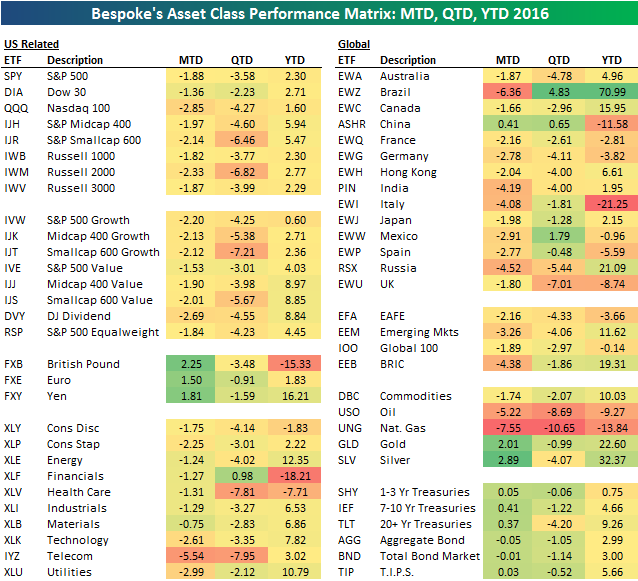
It was a relatively quiet week for US equity markets, but high dividend paying sectors like Utilities and Telecom have struggled recently as interest rates have risen. Below is our asset class performance matrix, which highlights the recent performance of ETFs across the financial spectrum.
While oil was up nearly 4%, gold and silver both tanked. The Brazilian stock market (EWZ) was up another 5%, putting it up a whopping 71.35% on the year. That’s by far the best ETF in the matrix in terms of year-to-date performance.
We analyze this week’s action, the Fed, economic indicators, sentiment and more in this week’s Bespoke Report newsletter. You can read the entire report by starting a 14-day free trial to our paid content below.
Have a great weekend!
